
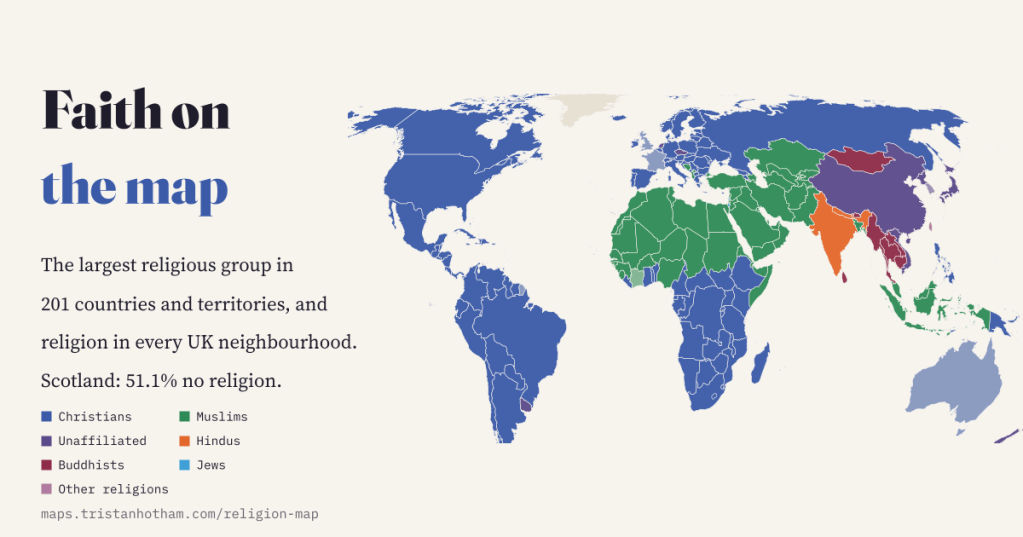
Christianity’s centre has moved to sub-Saharan Africa, the number of people with no religion is growing fast, and in Scotland no religion is now the majority answer. I mapped the world’s religions and every neighbourhood in the UK, and found that the biggest divide at home is not between places but between generations.
Religion is one of the oldest ways people have of saying who they are, and one of the hardest things to count. A census can only ask; a survey can only sample; a map of churches and mosques only shows what someone has drawn. But put the best open sources side by side and a clear picture emerges.
For the world I used Pew Research Center’s estimates of the religious make-up of 201 countries and territories in 2010 and 2020. For the UK I put together the censuses of England and Wales (2011 and 2021), Scotland (2022) and Northern Ireland (2021, with a series going back to 1861). And for the buildings, I counted the 1,624,818 places of worship that OpenStreetMap’s volunteers have mapped.
Four big answers
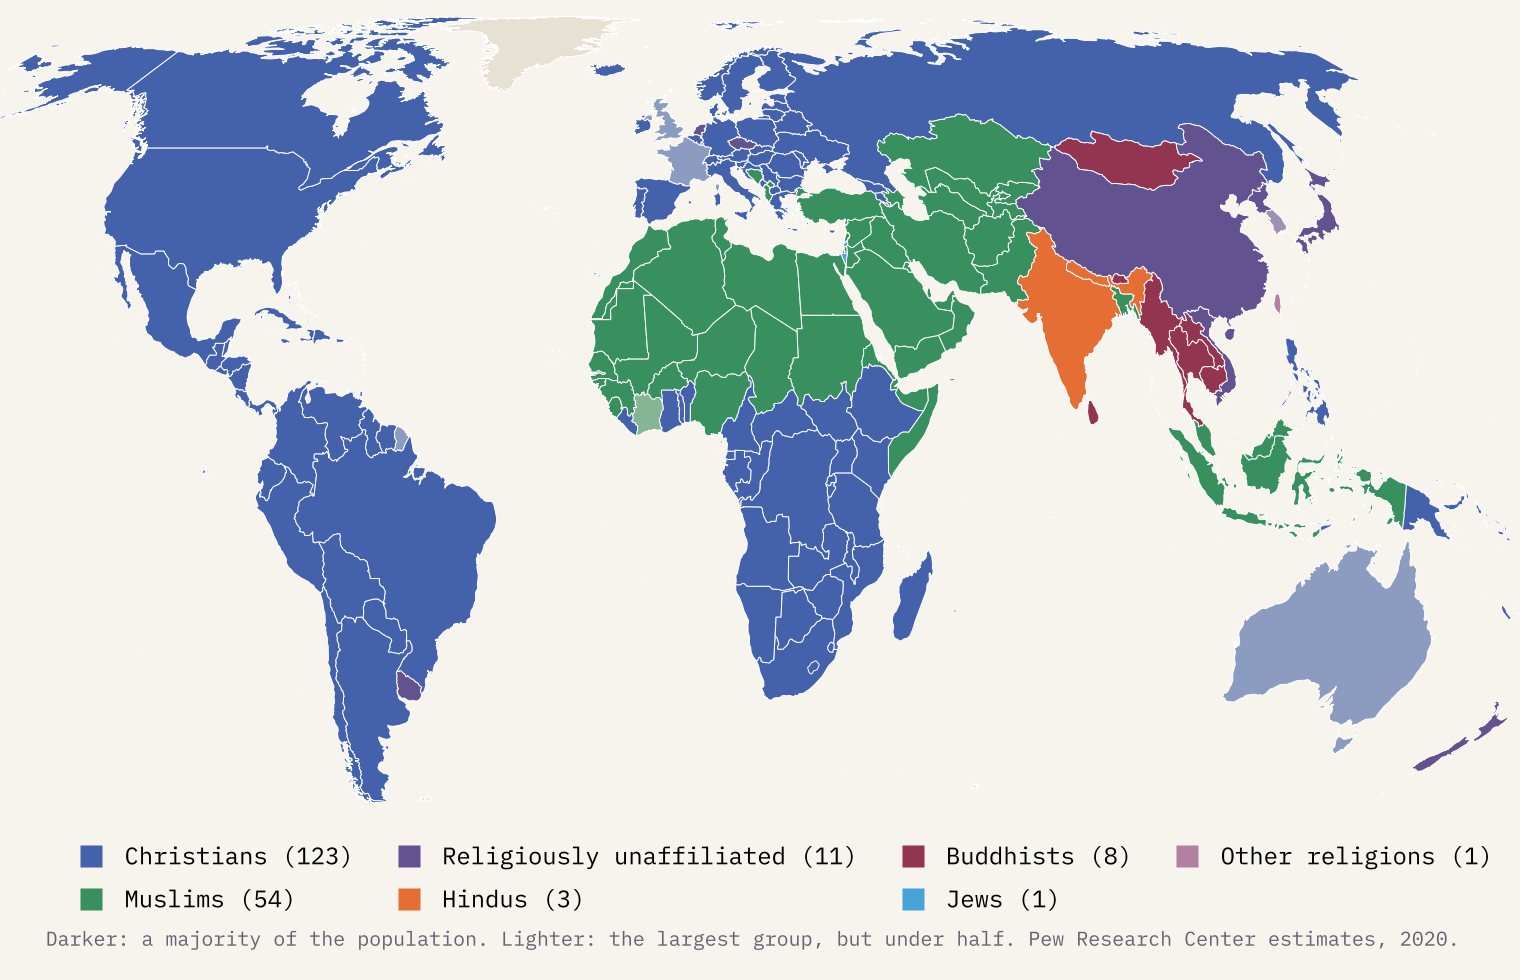
In 2020, by Pew’s estimates, 28.8% of the world was Christian, 25.6% Muslim, 24.2% religiously unaffiliated and 14.9% Hindu, with Buddhists at 4.1%, Jews at 0.2% and every other religion together at 2.2%. Christians are the largest group in 123 countries and territories and Muslims in 54. The unaffiliated are the largest group in 11, and they are concentrated to a remarkable degree: China alone is home to 67% of them.
Christianity moves south
Between 2010 and 2020 the world’s population grew by 12.3%. The number of Muslims grew fastest, by 20.7%, and the unaffiliated by 16.5%. Christians grew by 5.7%, so their share of the world fell, and Buddhists were the only group to shrink in number.
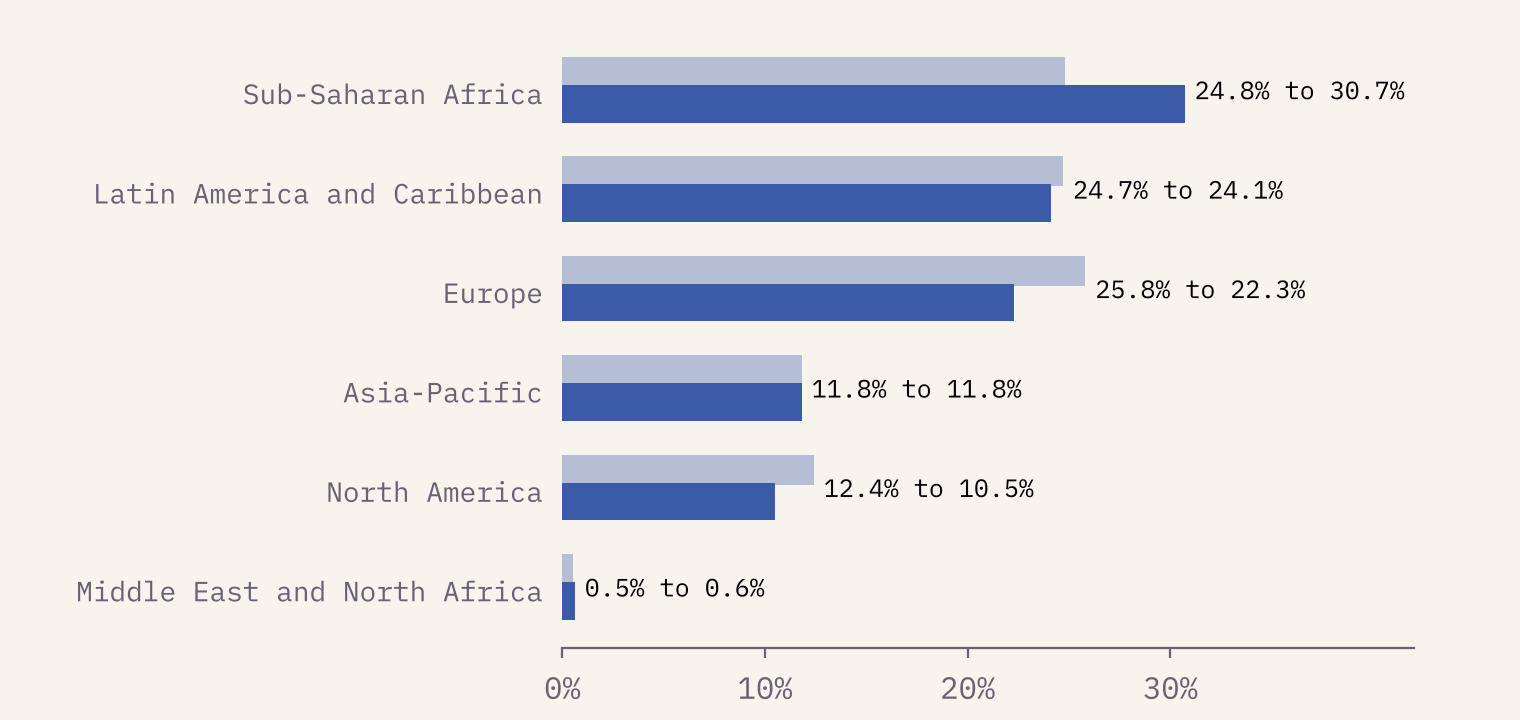
The geography of Christianity changed too. In 2010 Europe had the largest share of the world’s Christians, 25.8%. By 2020 sub-Saharan Africa had overtaken it, with 30.7% against Europe’s 22.3%.
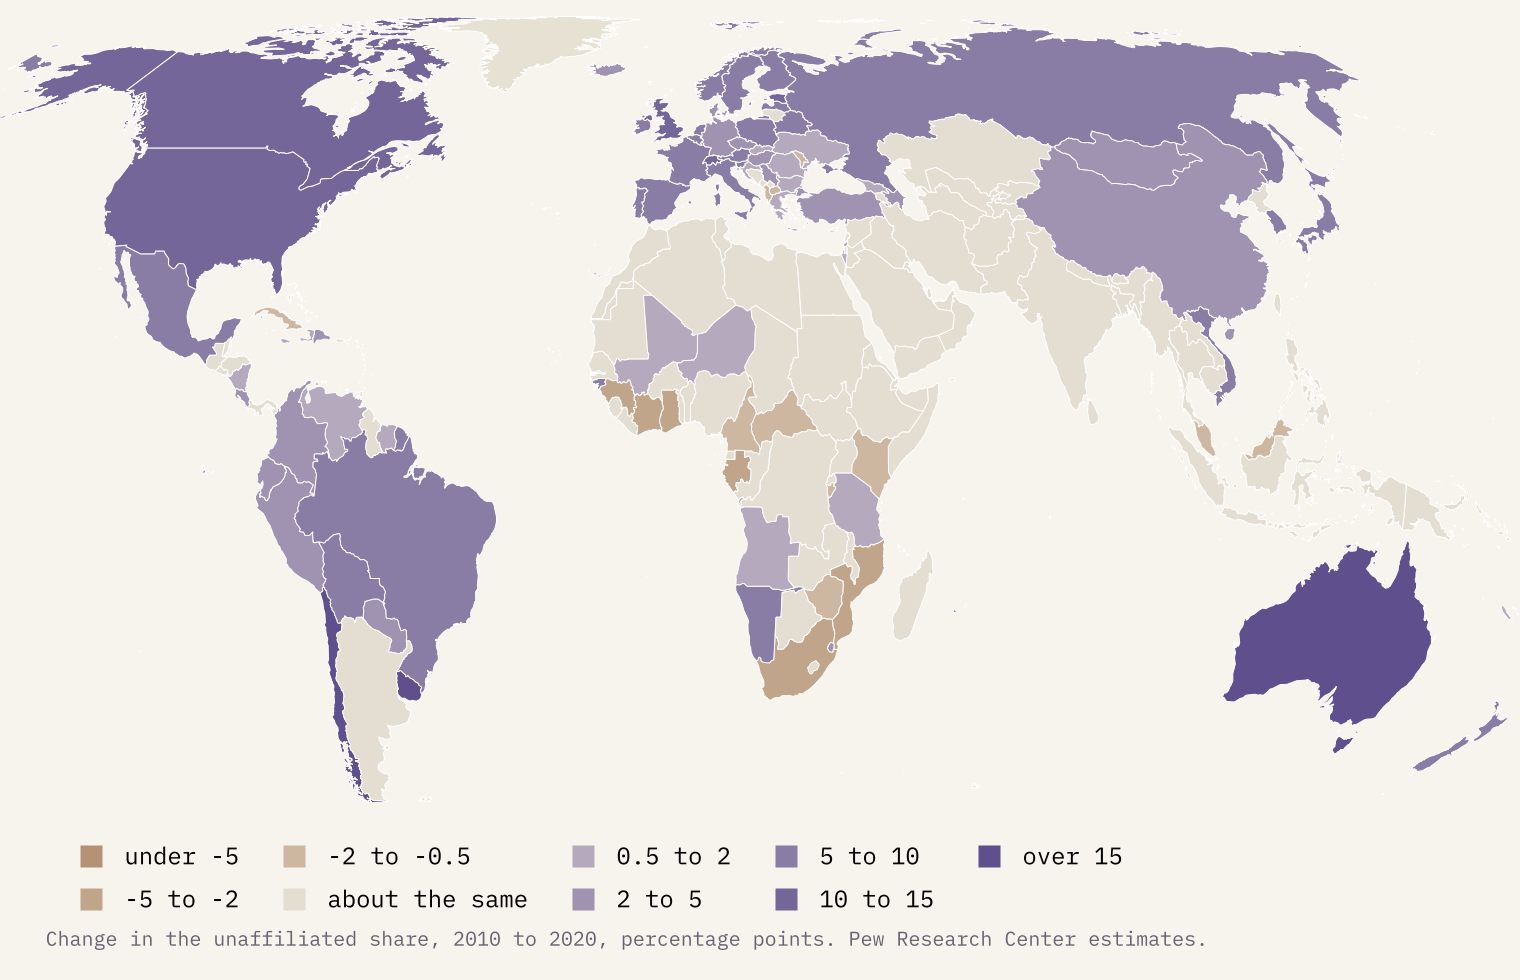
Meanwhile the share of people with no religion rose in 103 countries. The biggest jumps came in Australia (17.5 points), Chile, Uruguay and the United States, and in Uruguay and New Zealand the unaffiliated became the largest group.
A map of 1.6 million doors
OpenStreetMap’s volunteers have mapped 1,624,818 places of worship: 989,563 Christian, 291,813 Muslim, 111,463 Buddhist, 56,870 Hindu and 41,061 Shinto shrines, almost all in Japan. Coloured by the most common religion in each small square, they draw the great religious landscapes of the world with startling clarity.
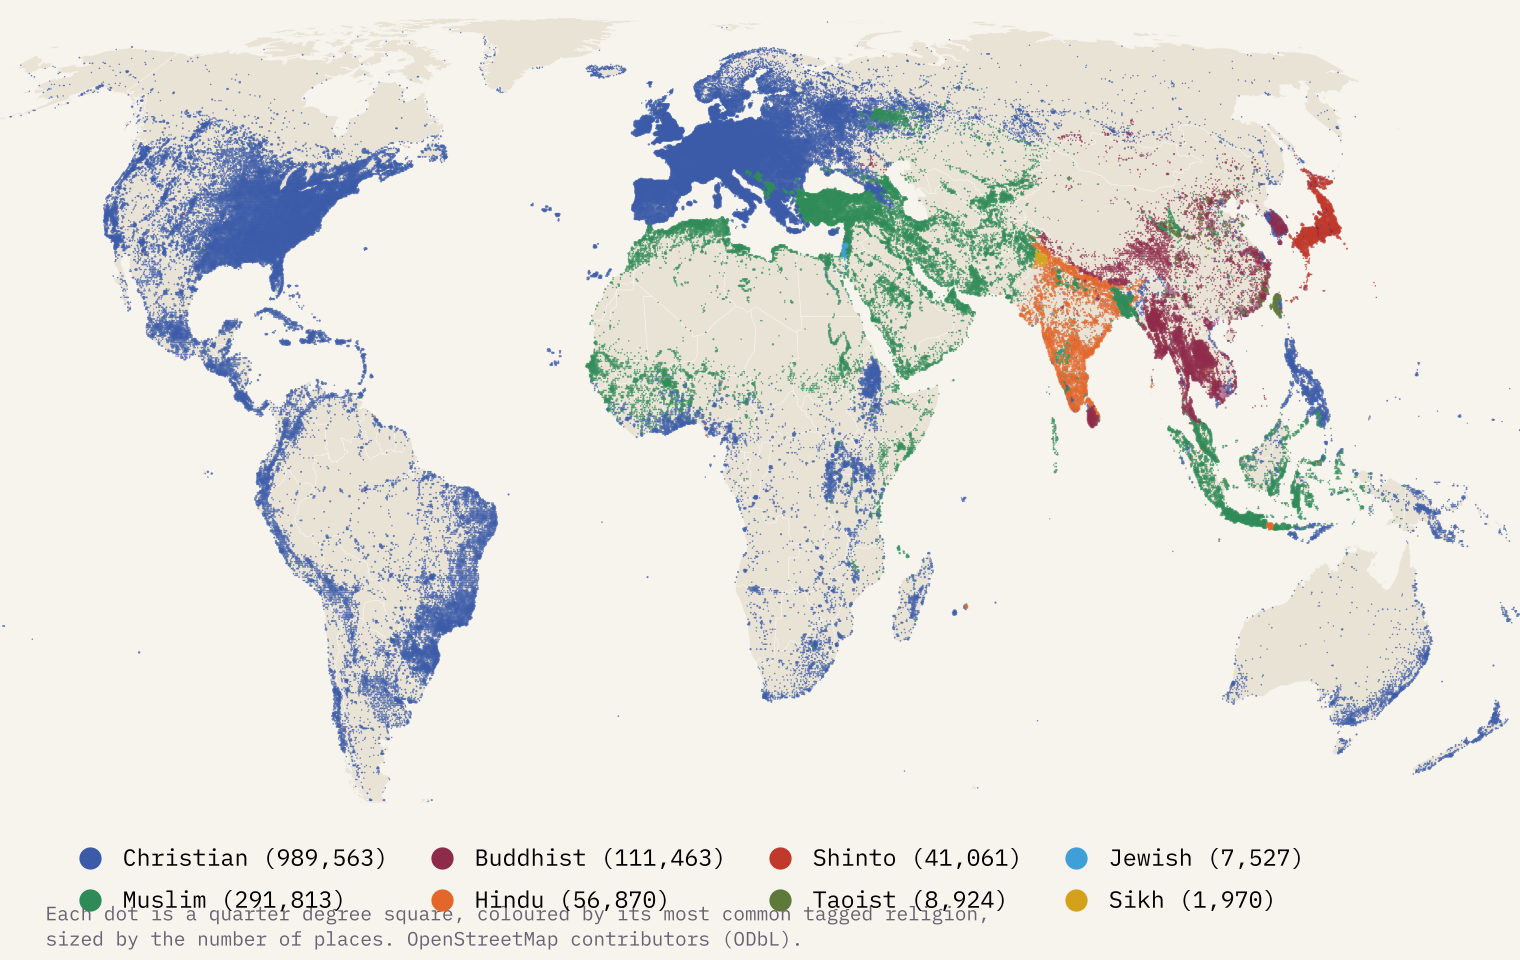
But the map is also a warning label. North America has 77.5 mapped places of worship per 100,000 people; sub-Saharan Africa, where most of the world’s Christian growth is happening, has 7.1. That is a map of where volunteers draw buildings, not of where people pray.
The UK: no religion, nearly
In England and Wales, Christian is still the largest single answer, 46.2% against 37.2% for no religion, but it is no longer a majority: in 2011 it was 59.3%. In Wales no religion is now the largest answer (46.5%), and in Scotland it is a majority (51.1%). Northern Ireland remains the most Christian part of the UK (79.7%). Council by council, no religion is the most common answer in 75 of the UK’s 361 local authorities; in 2011 it was the most common answer in none of the councils of England and Wales.
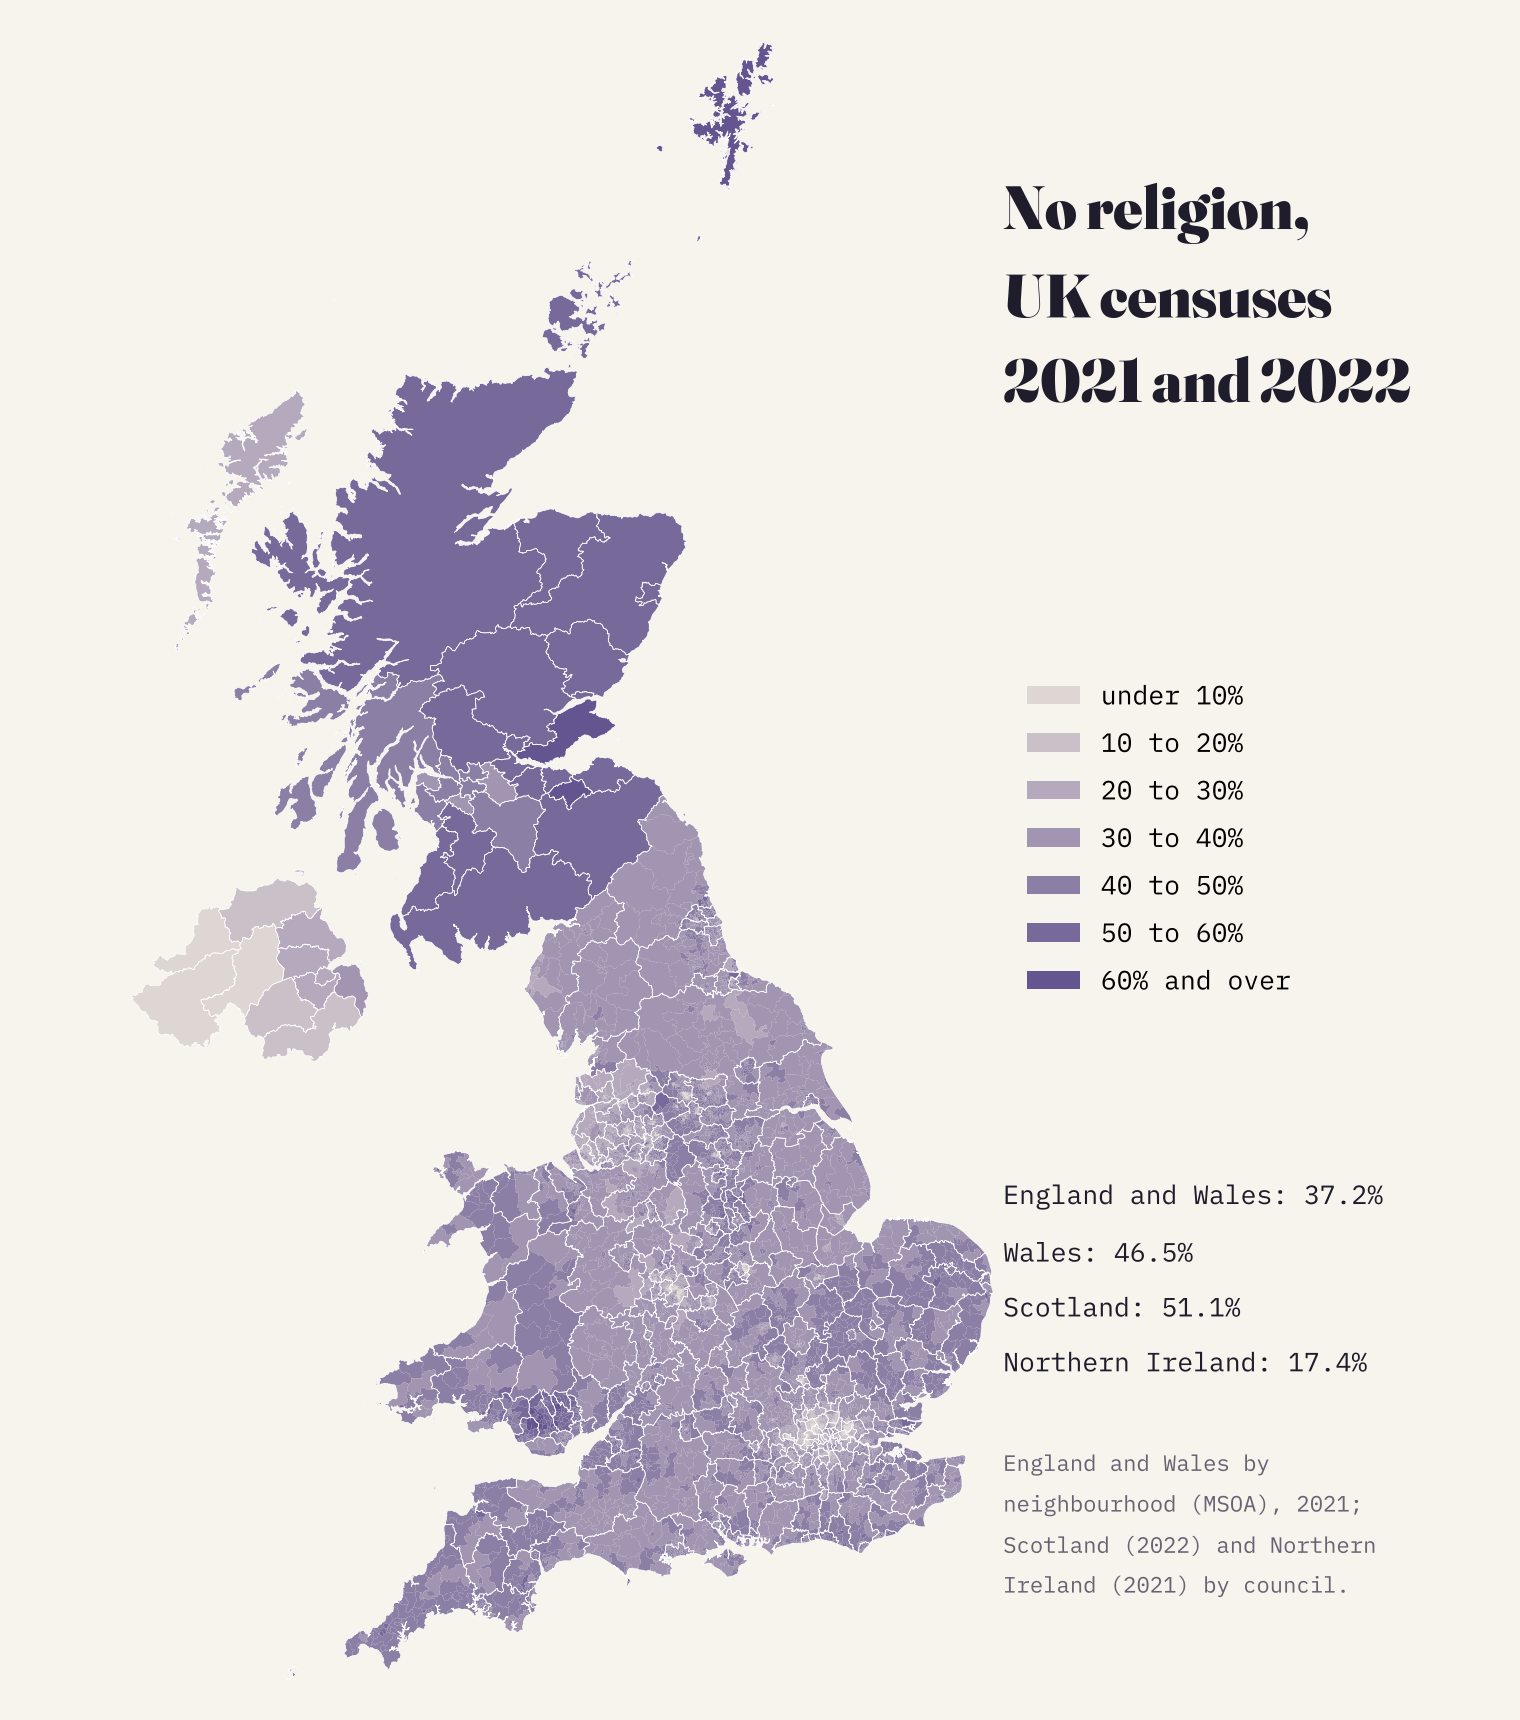
Zoom into the neighbourhoods and the picture is local. No religion peaks in central Brighton and Hove (68%), Christian in parts of Liverpool and Knowsley (76%). Other faiths are concentrated in particular places: Muslims in parts of Birmingham and Blackburn, Hindus in Leicester, Sikhs in Ealing and Wolverhampton, Jewish communities in Salford and north London, Buddhists around Aldershot.
The young answer differently
The sharpest divide in the census is age. Among people aged 75 and over in England and Wales, 77% said they were Christian. Among 25 to 34 year olds, 51% said they had no religion. The two lines cross among people in their late thirties and forties.
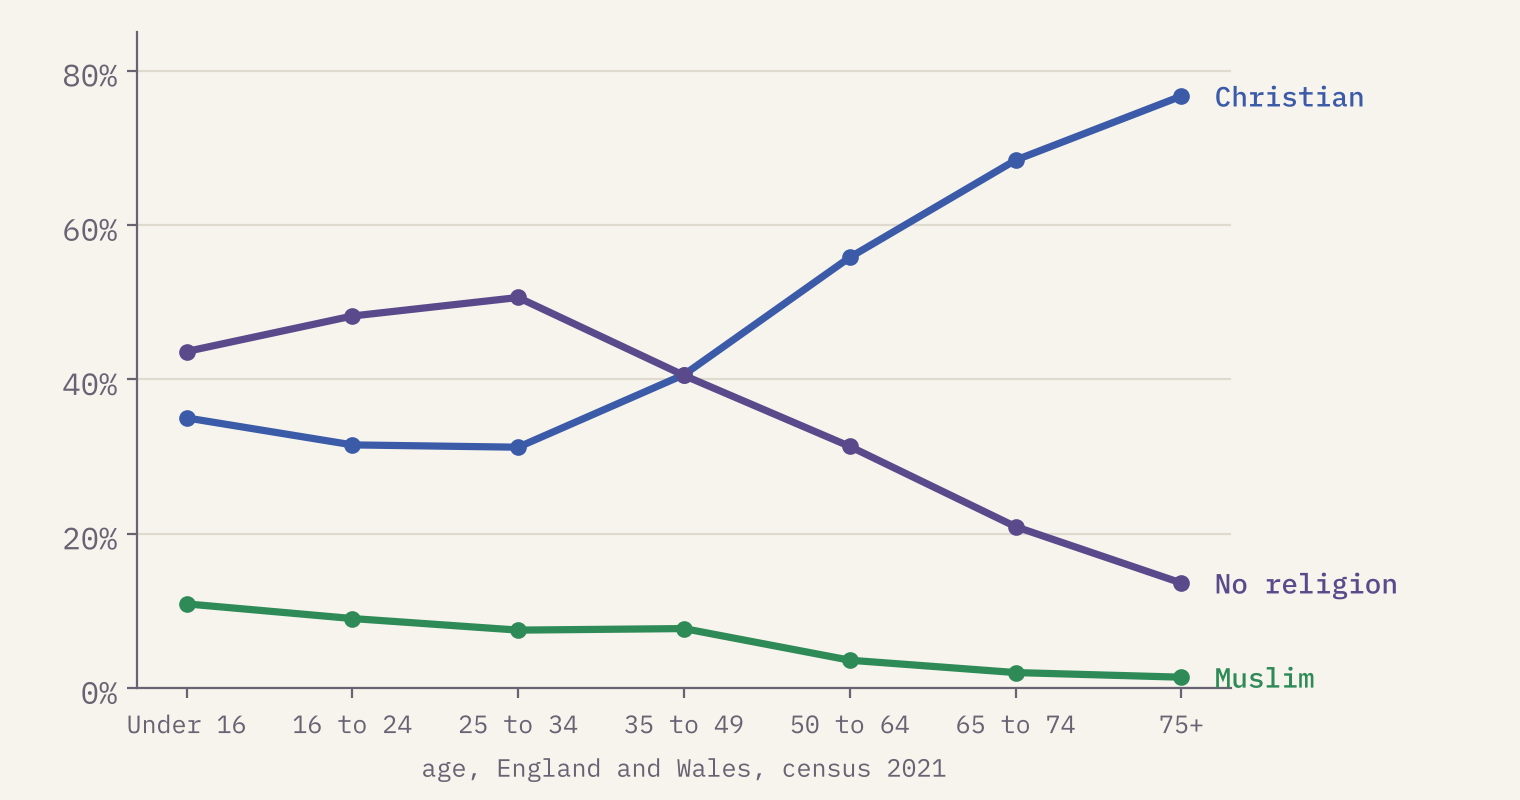
Among people aged 75 and over, 77% said they were Christian. Among 25 to 34 year olds, 51% said they had no religion.
Northern Ireland, 1861 to 2021
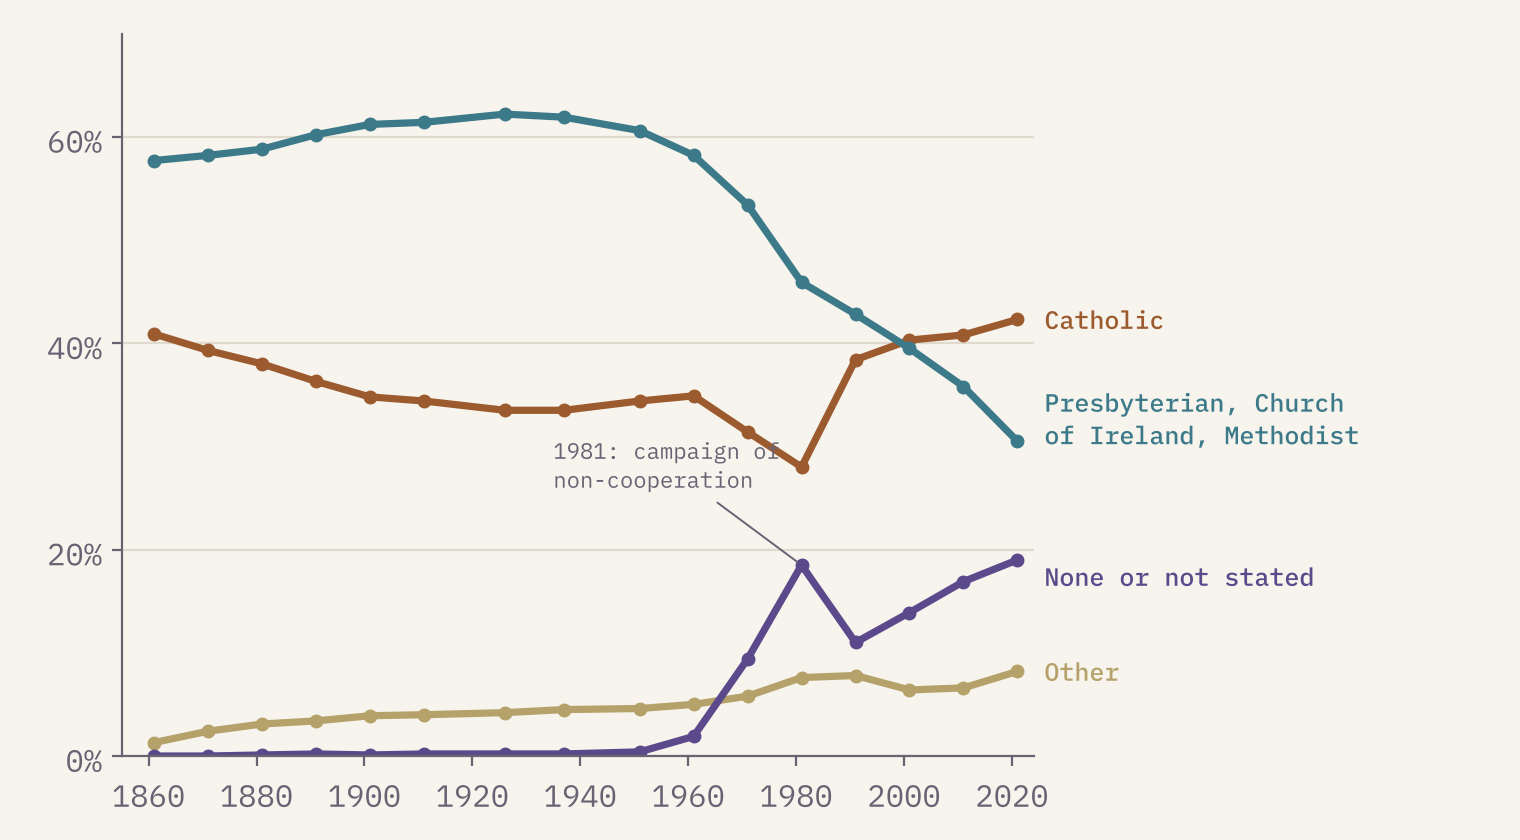
Northern Ireland’s statisticians publish religion from every census since 1861. In 1861, 40.9% of people were Catholic and 57.7% belonged to the three largest Protestant churches. The Protestant share peaked in 1926; since 2001 Catholics have outnumbered the three churches combined, and in 2021 the figures were 42.3% and 30.5%, while 19.0% had no religion or did not say.
How I did this
Everything was downloaded on 2026. The world figures are Pew Research Center’s published estimates, joined to country outlines. The four UK nations ask about religion in different words (Scotland lists the Church of Scotland and Roman Catholic separately; Northern Ireland also asks the religion you were brought up in), so I put the answers into common groups and say where they do not line up: Northern Ireland’s tables, for example, do not separate the smaller faiths. To compare 2011 with 2021 I added up the councils that have merged since. The places of worship are counted per quarter degree square from OpenStreetMap’s religion and denomination tags. The paper sets out every step and caveat.
Belonging is not the same as believing or practising, and none of these sources measures faith. This is a description of how people answer, not a judgement of any religion or of none.
Notes and sources
- Pew Research Center (2025), How the Global Religious Landscape Changed From 2010 to 2020, dataset with diversity statistics (2026). Pew Research Center is not responsible for the analyses or interpretations presented here.
- Office for National Statistics, Census 2021 and 2011, via Nomis. Open Government Licence v3.0.
- National Records of Scotland, Scotland’s Census 2022, table UV205. Open Government Licence v3.0.
- Northern Ireland Statistics and Research Agency, Census 2021, tables MS-B19, MS-B22 and MS-B23. Open Government Licence v3.0.
- OpenStreetMap contributors, via QLever. ODbL 1.0.
- Boundaries: ONS (Open Government Licence v3.0, contains OS data © Crown copyright and database right) and Natural Earth (public domain).
- I wrote the text, with drafting and editing assistance from Claude (Anthropic), which also helped prepare the analysis code. I reviewed and checked all text and results.

