
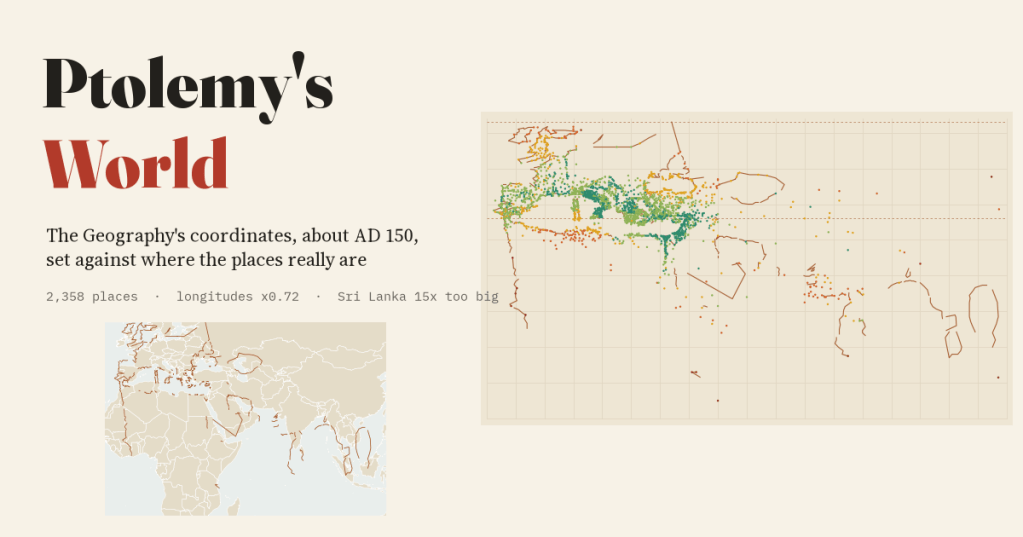
Around AD 150 Ptolemy wrote the known world down as a table of coordinates. I matched 2,358 of his places to where they really are and measured how wrong his map is, and in what ways.
Ptolemy’s Geography contains no map. It is a manual for drawing one, followed by a table: province by province, from Ireland to China, every town, cape and river mouth he knew, each with two numbers, degrees east of the Fortunate Isles at the western edge of the world and degrees north of the equator. It was the first attempt we know of to put the whole inhabited world on a grid, and for fourteen centuries the world maps of Byzantium and then of Renaissance Europe were drawn from it.
Gerd Grasshoff and Oliver Defaux have published the whole table as open data: 10,049 entries, 6,372 with coordinates, with the modern identification of each place where scholars know it. I took those identifications, found their real coordinates through the Pleiades gazetteer of ancient places, the Digital Atlas of the Roman Empire and my own work on capes and river mouths, and kept only the matches I could stand behind: 2,358 places.
A world half as wide again
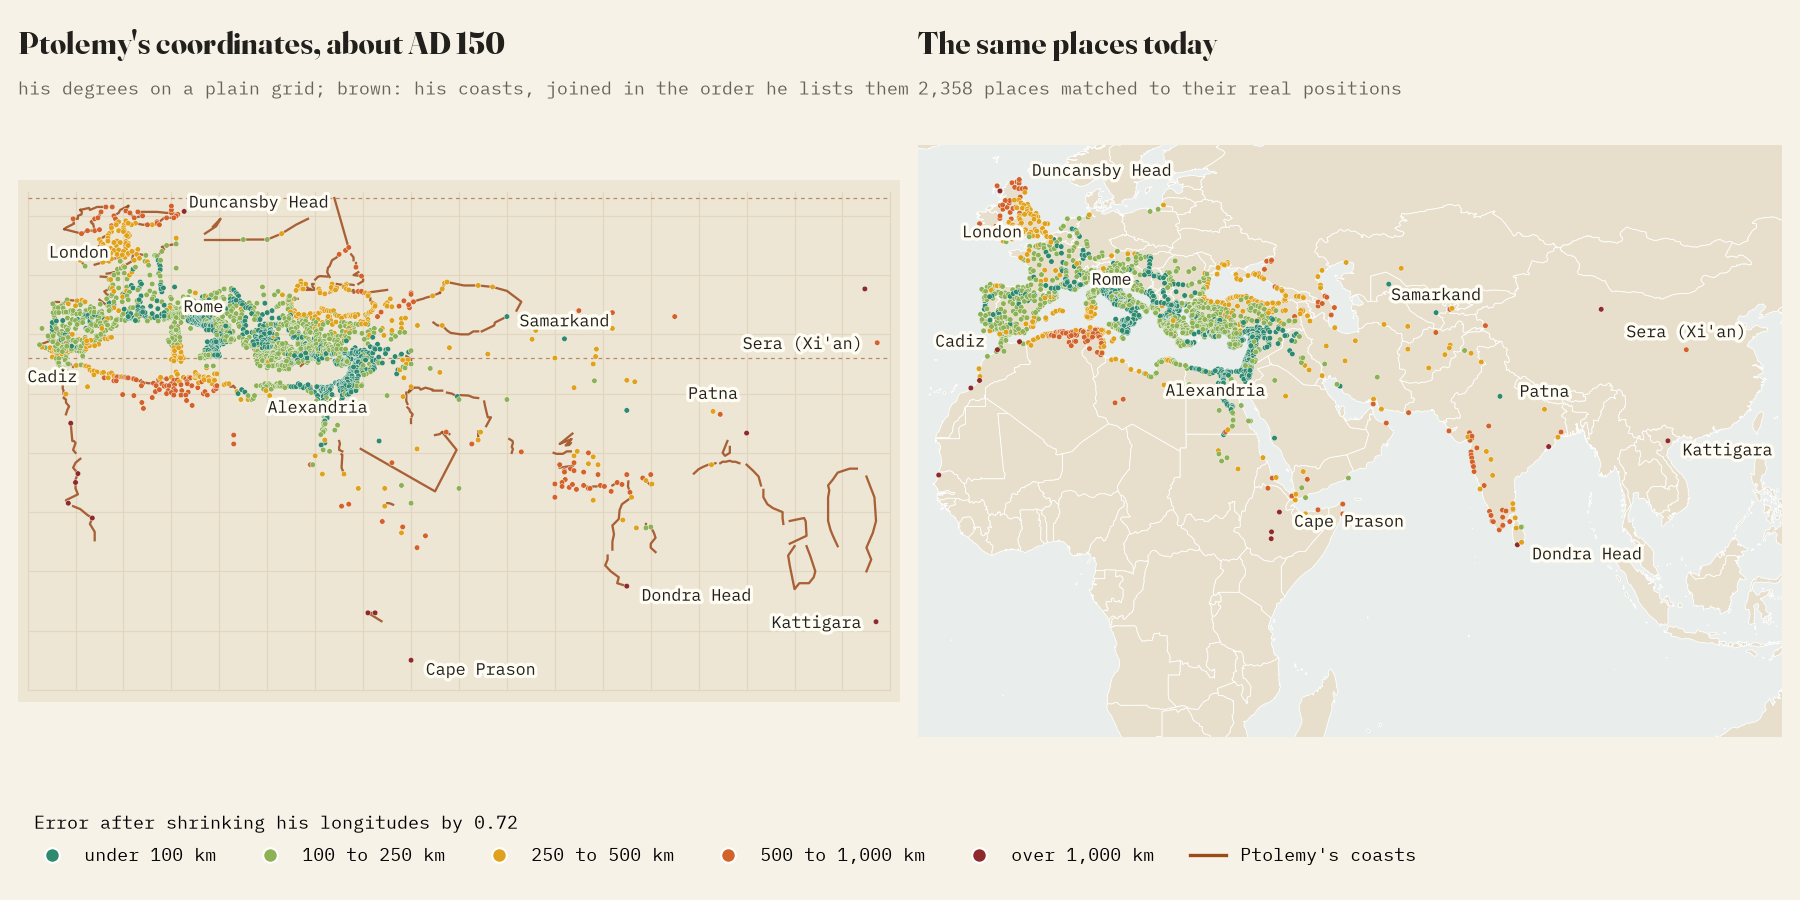
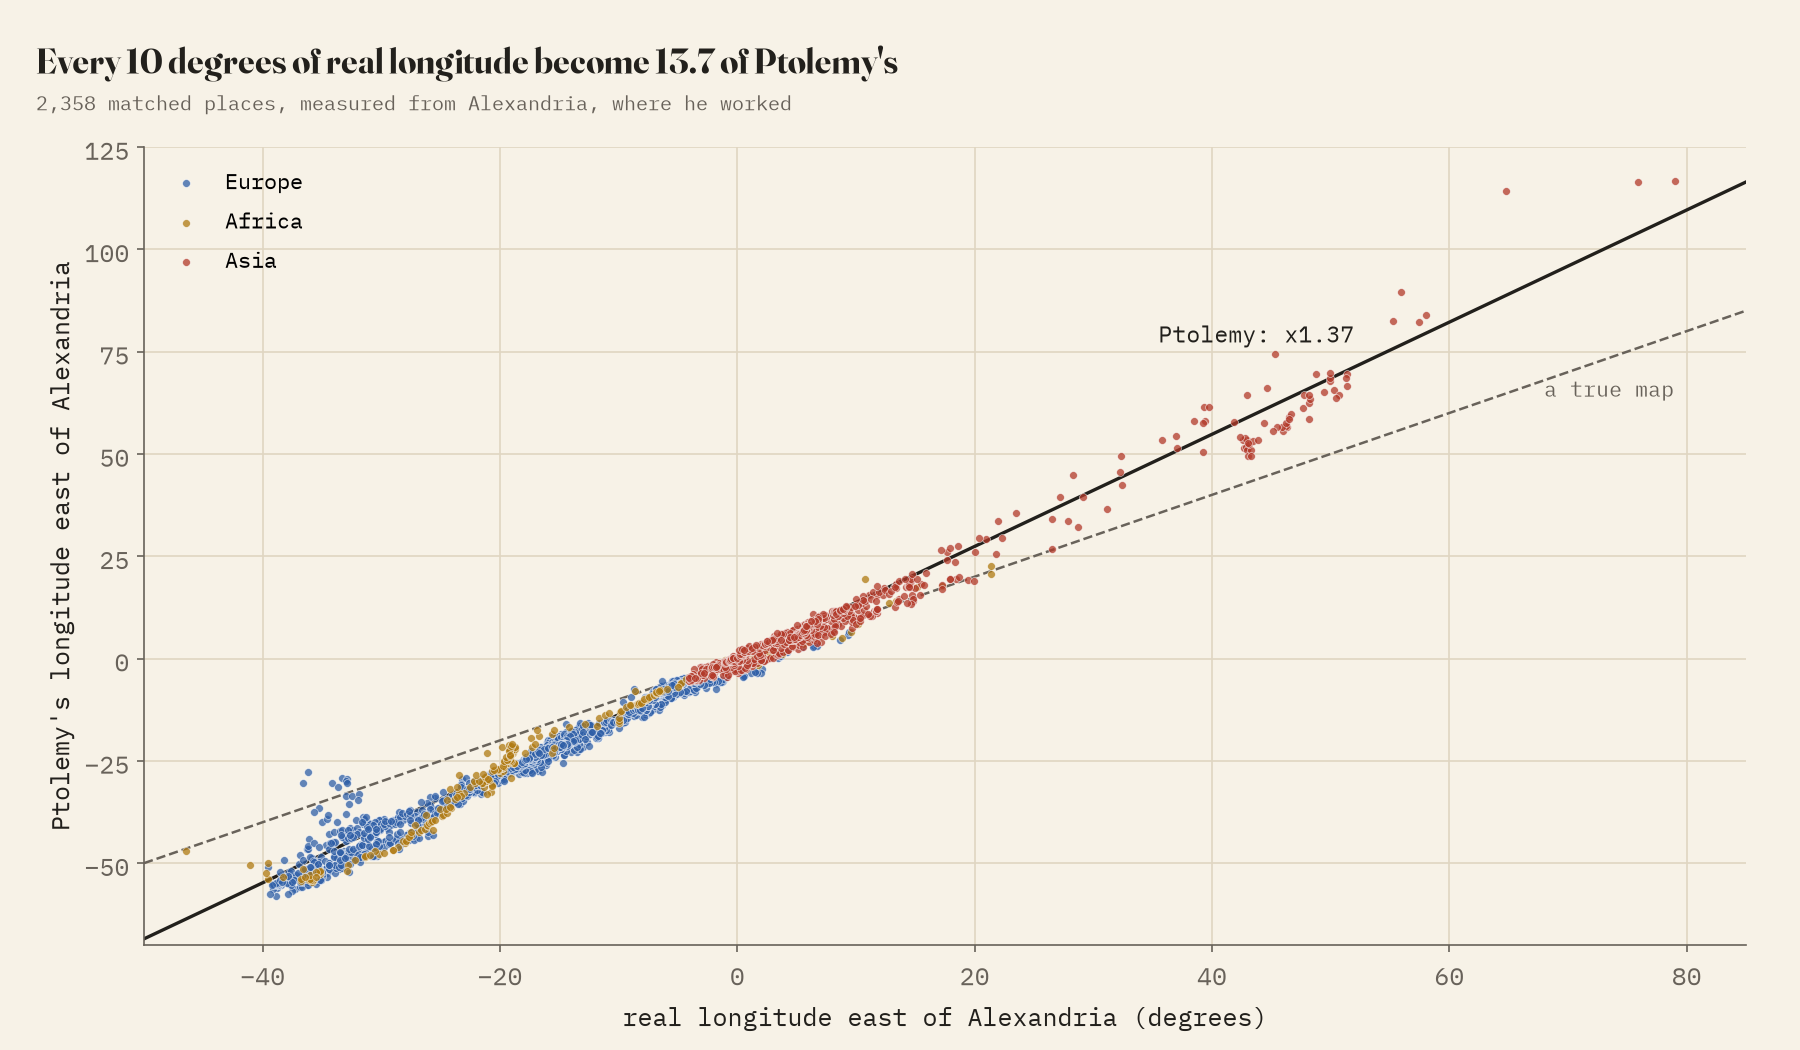
The first thing you notice is that Ptolemy’s world is far too wide. From Cape St Vincent in Portugal to Sera, the city of the silk people, usually taken to be Xi’an, he counts 174.8 degrees of longitude. The real figure is 117.9. Measured from Alexandria, where he worked, every 10 degrees of real longitude became 13.7 of his, to the west as much as to the east.
The usual explanation is the size of the Earth. Ptolemy gave a degree as 500 stadia, where Eratosthenes had reckoned 700. If the travellers’ distances he worked from were roughly right, converting them at 500 stadia a degree would make every gap too wide, and to fix it you would shrink his degrees by 500 divided by 700, which is 0.71. The single best correction I can find in the data is 0.72.
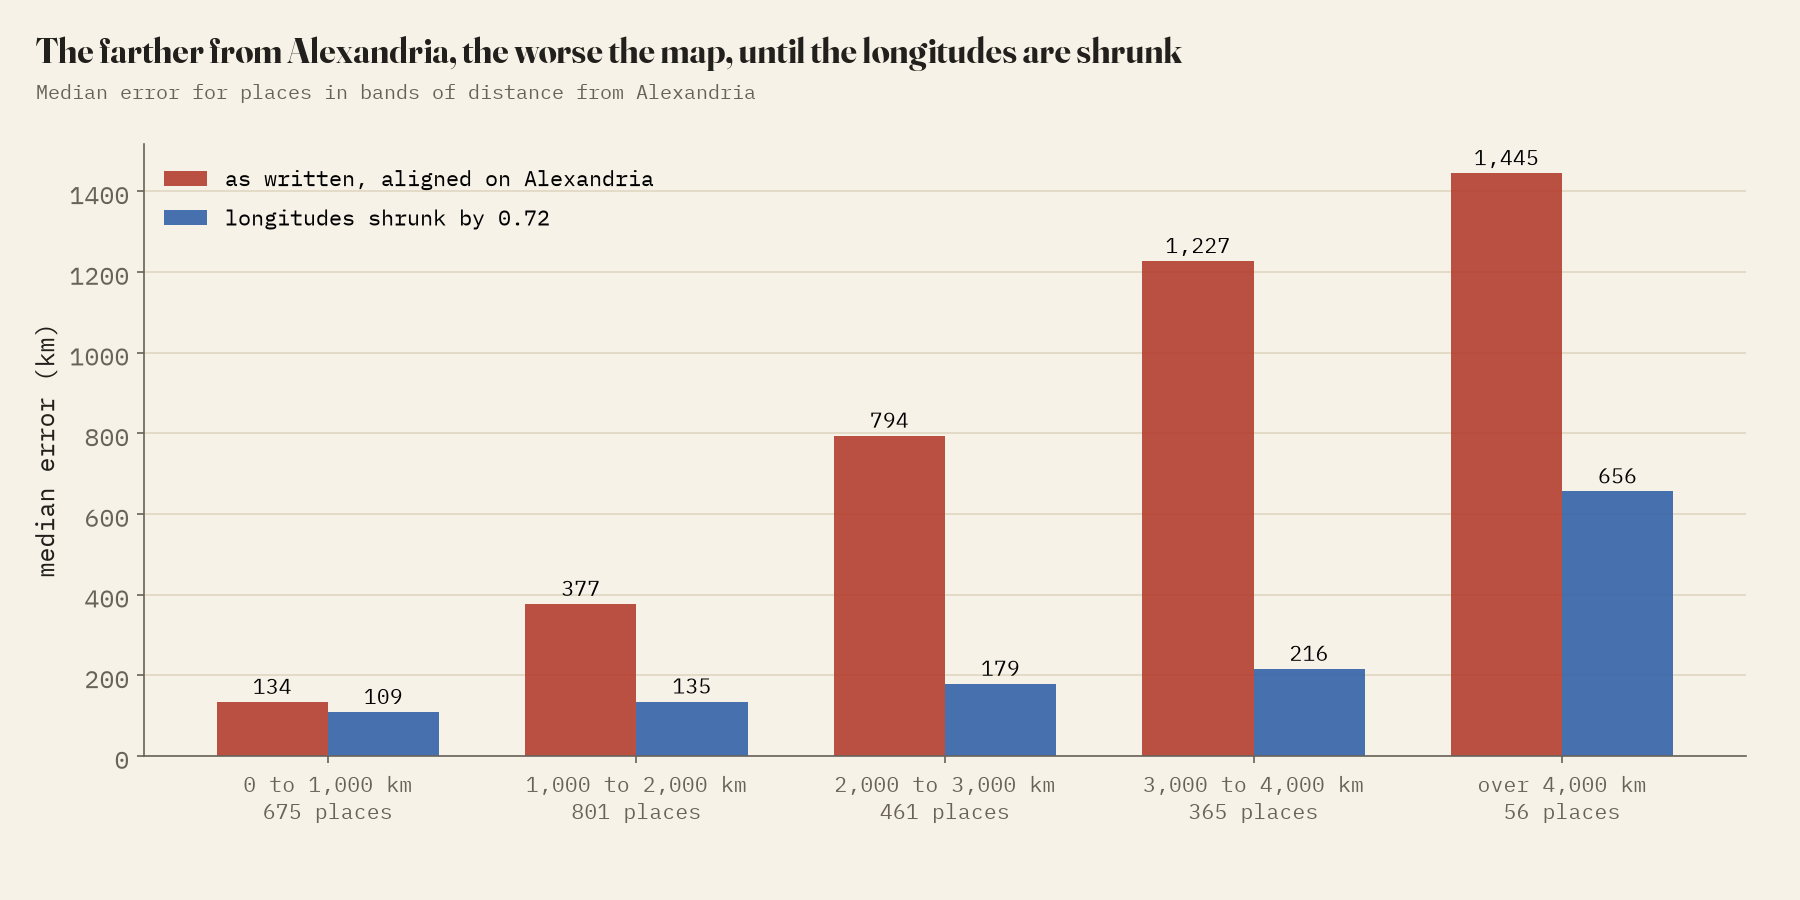
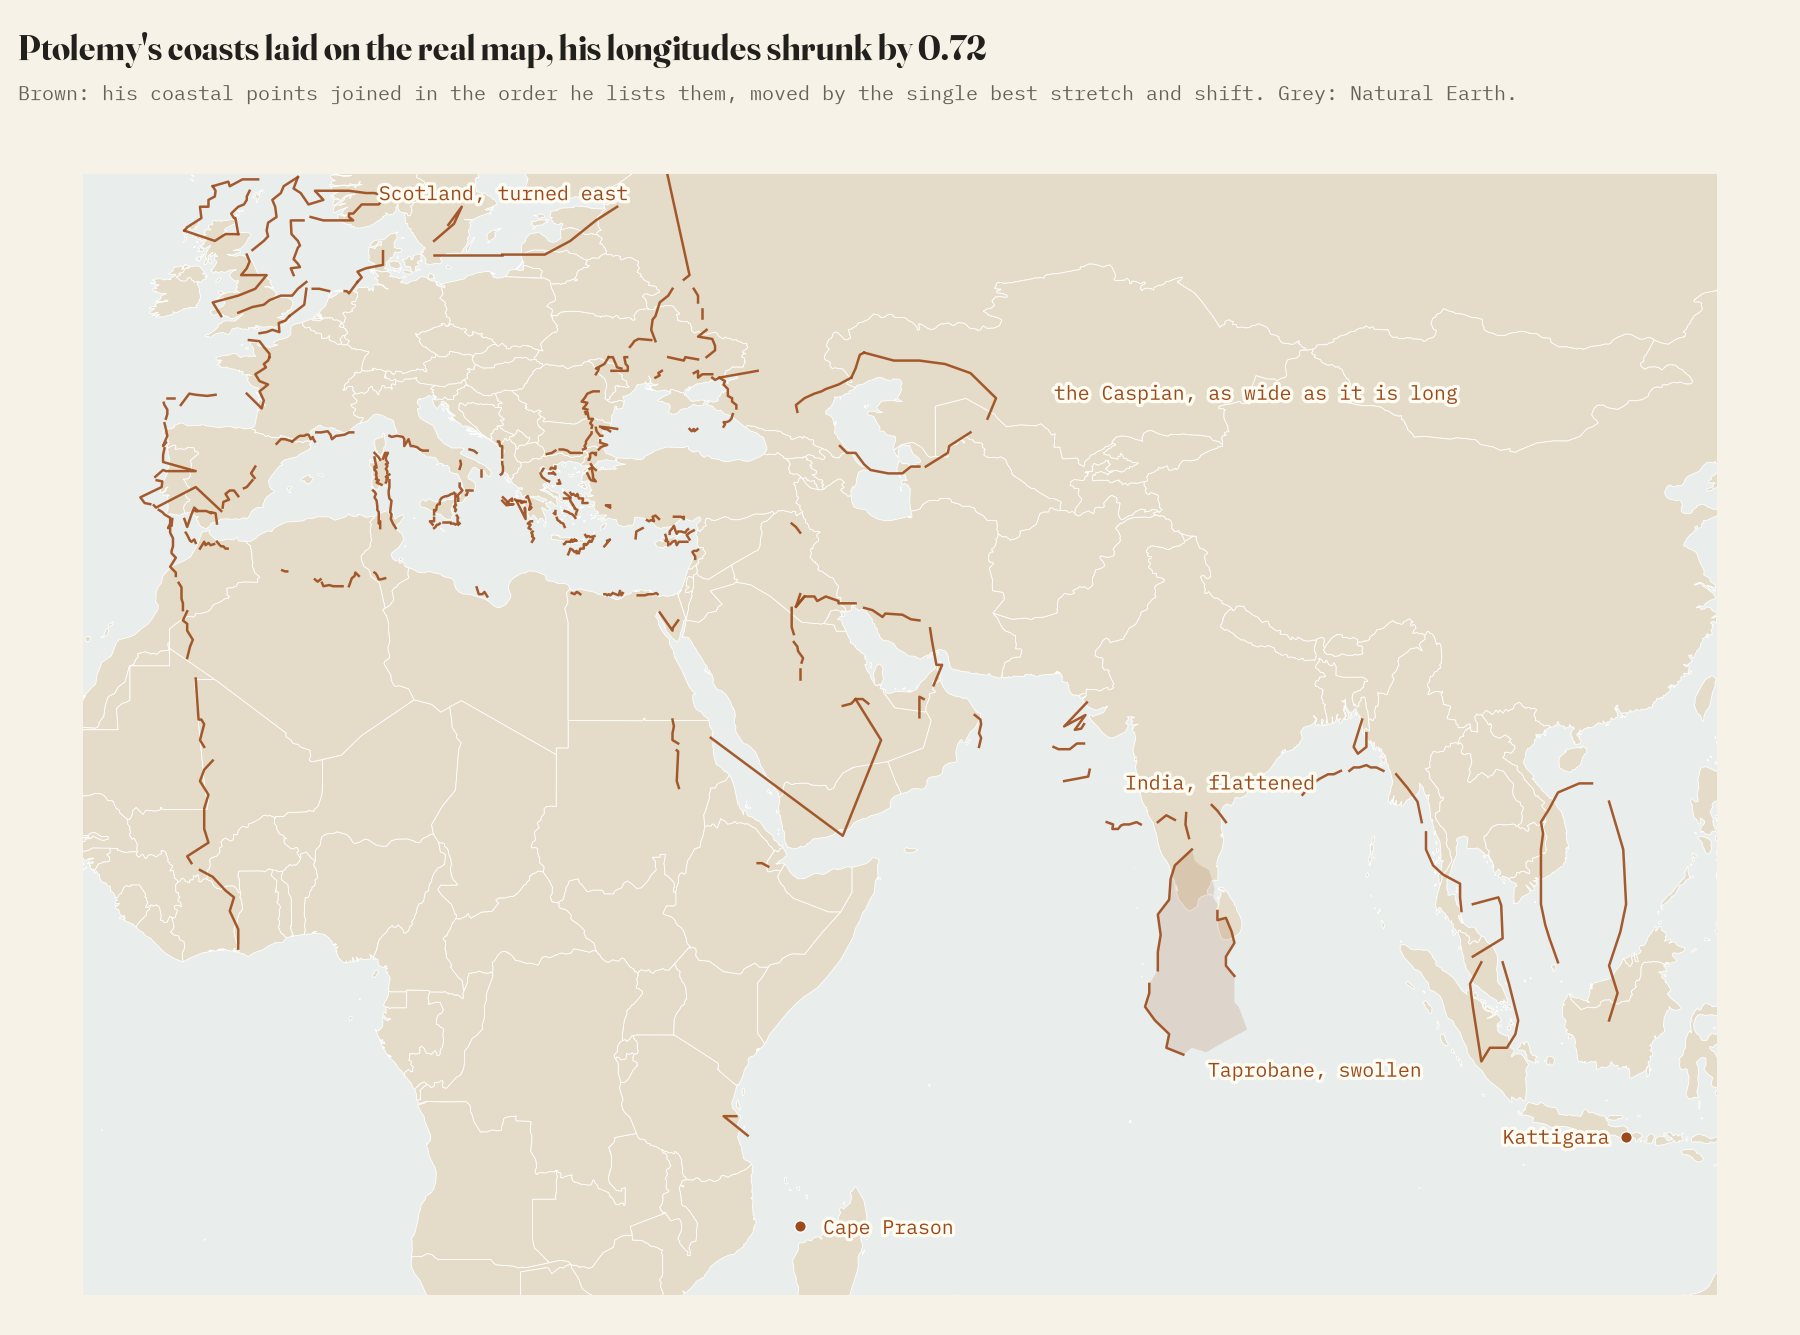
Read exactly as written, his map is good near Alexandria and bad far away: places within 1,000 km are a median 134 km out, places more than 4,000 km away 1,445 km. Shrink his longitudes by 0.72 and the median error across all 2,358 places falls from 425 km to 144 km. Rome ends up 79 km from where it should be, Samarkand 66.
Scotland on its side
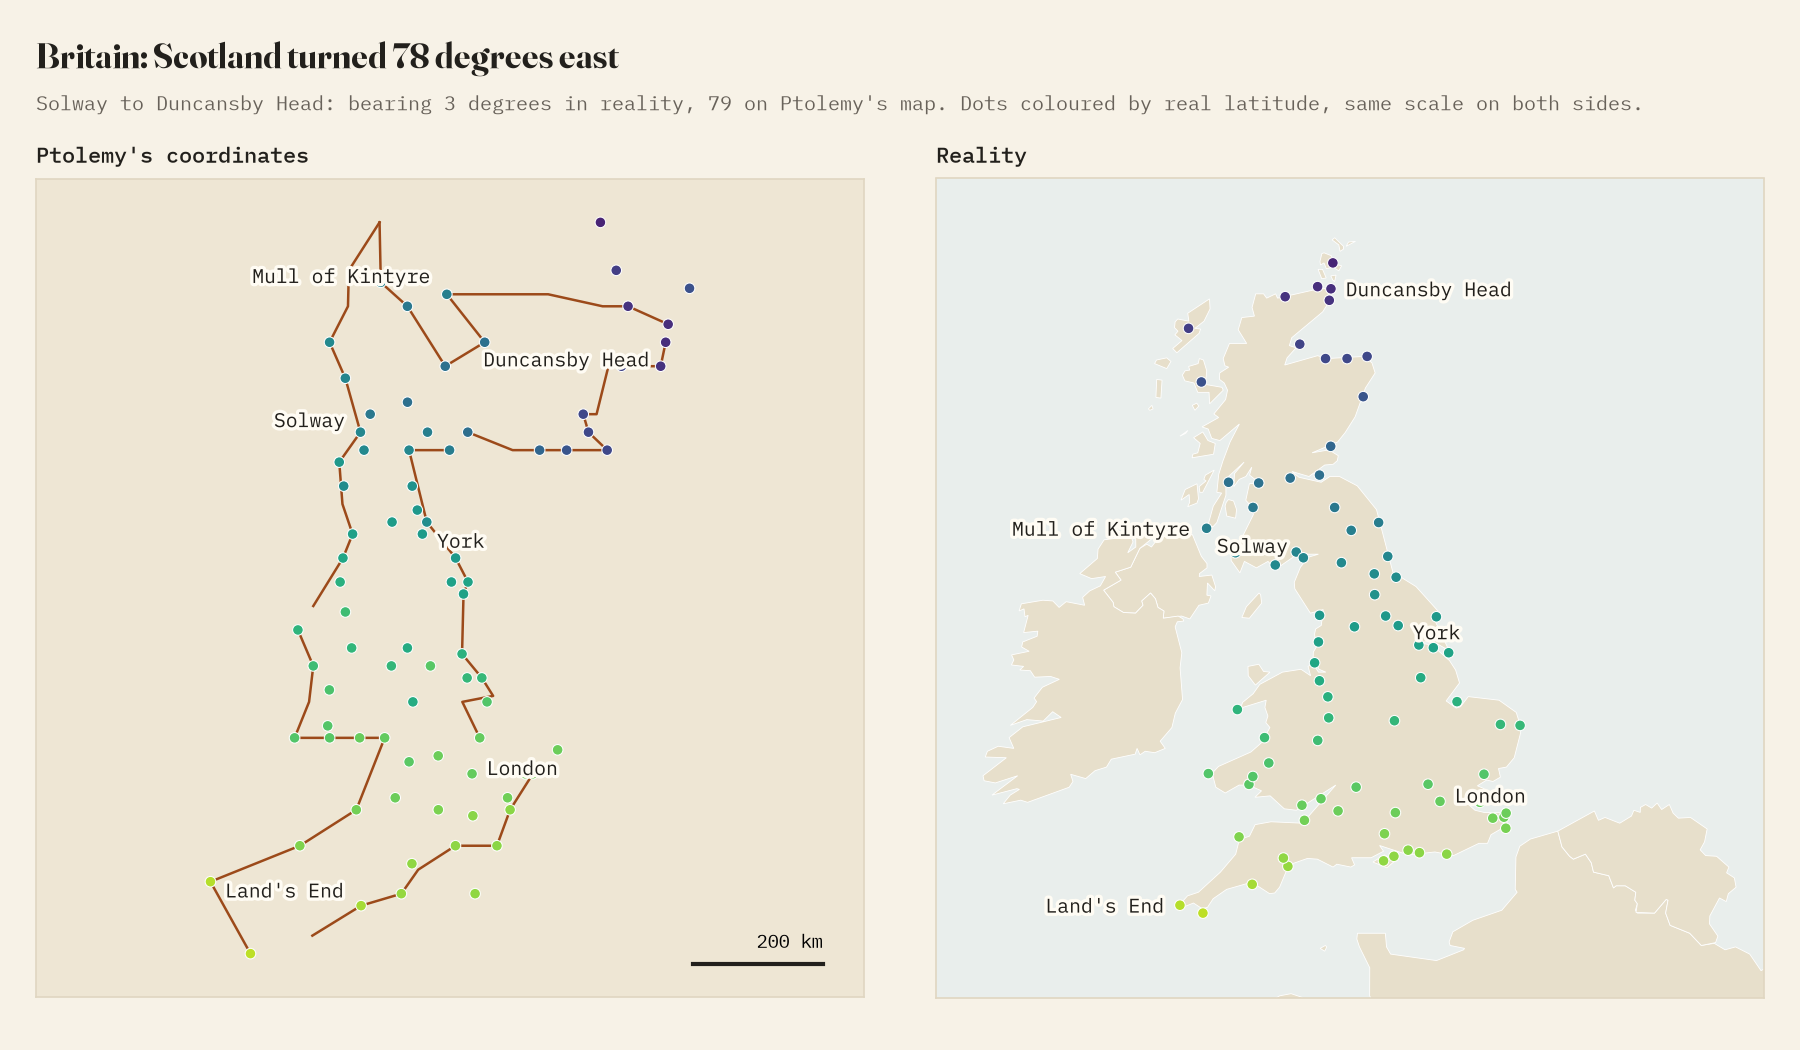
What the correction cannot fix are the local mistakes, and the most famous is Scotland. North of the Solway, Ptolemy’s Britain turns sharply east. On the real map, the Solway Firth to Duncansby Head is a bearing of 3 degrees, nearly due north; on his it is 79, nearly due east. Fitted separately, his Scotland is turned 78 degrees further than his England and Wales. Coast by coast it is still Scotland, the Clyde, the Forth and the Tay all in order, just rotated.
A flattened India and a giant Sri Lanka
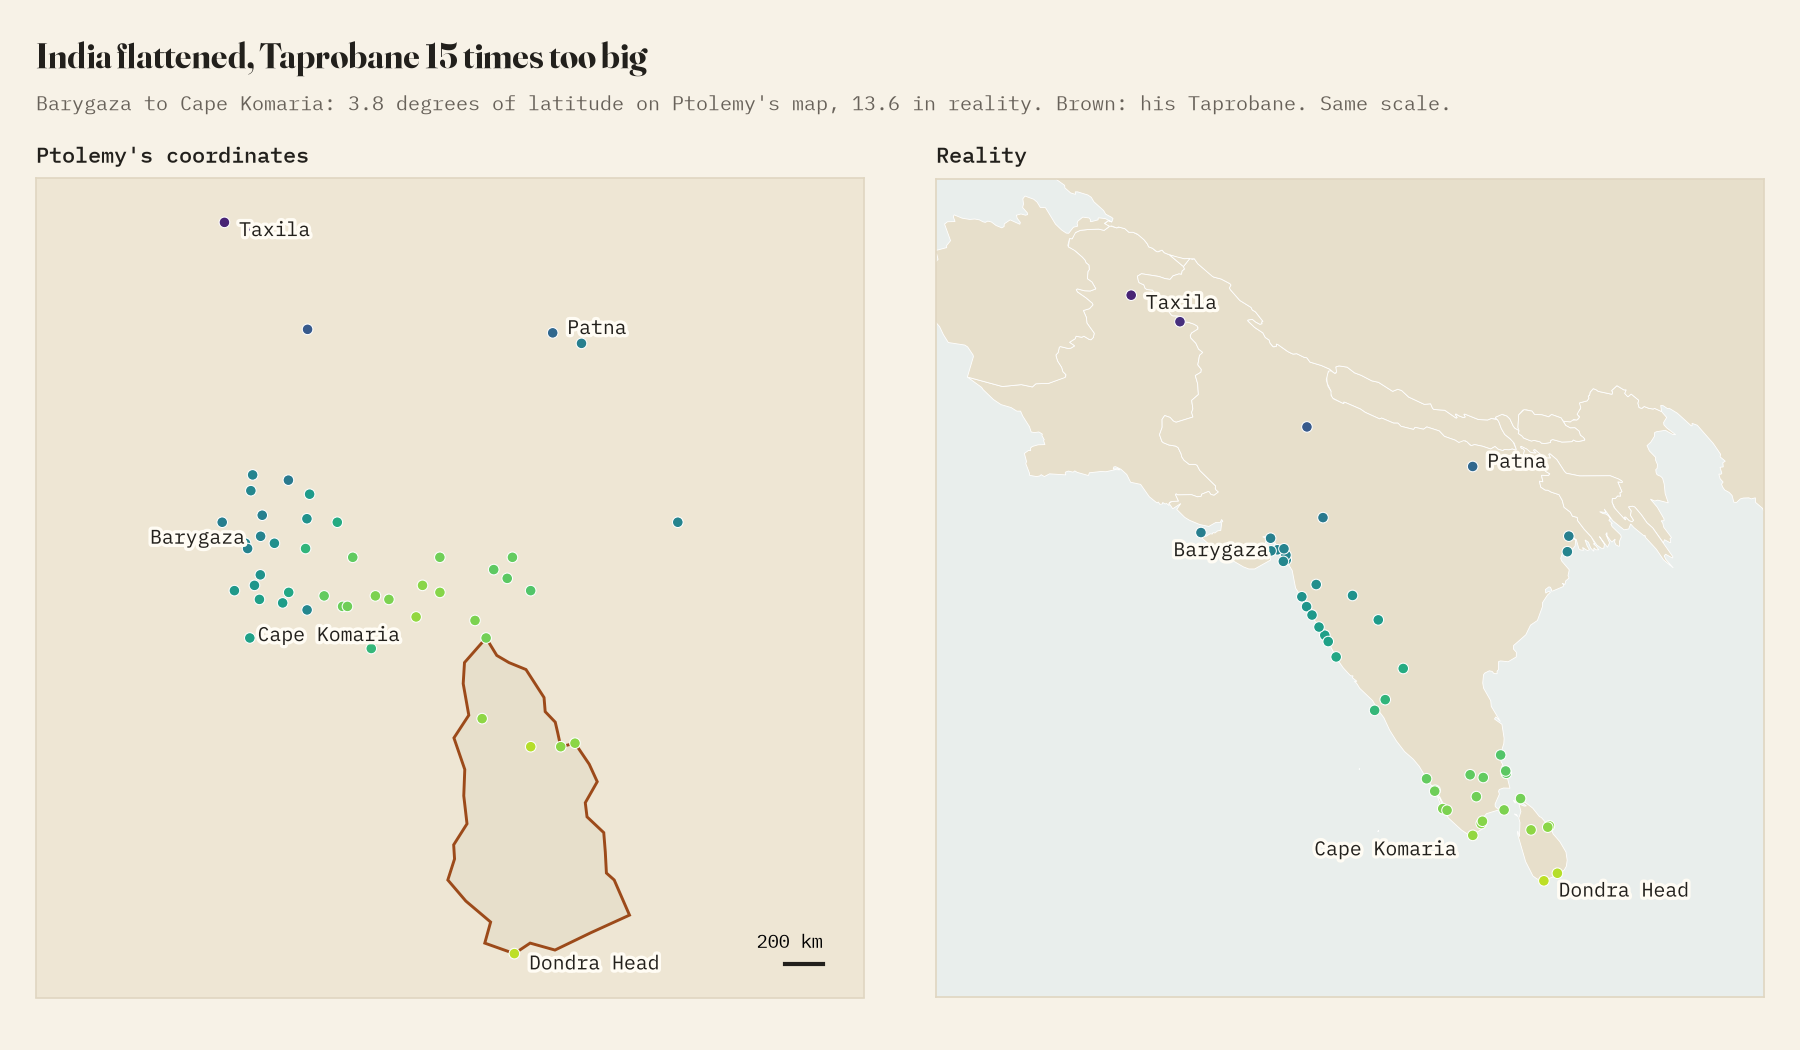
In the east, the errors change character. From Barygaza, modern Bharuch, to Cape Comorin is 13.6 degrees of latitude; in Ptolemy it is 3.8. The great triangle of India is flattened against the equator. Off its tip his Taprobane, Sri Lanka, swells to fill the space, running from 12.5 degrees north to -2.5 south, across the equator. At the same scale as the rest of his map it covers about 14.6 times the area of the real island.
He was right, against Eratosthenes and Strabo, that the Caspian is a closed sea; but his Caspian is as wide as it is long, when the real one is 2.7 times as long as it is wide, and he brings the Oxus and Jaxartes into it when they really end in the Aral Sea. And he closed the Indian Ocean by mistake, joining East Africa to the land beyond Kattigara with an unknown southern continent. His Kattigara, which the editors place near Hanoi, lies 29.5 degrees too far south.
Where the map is good
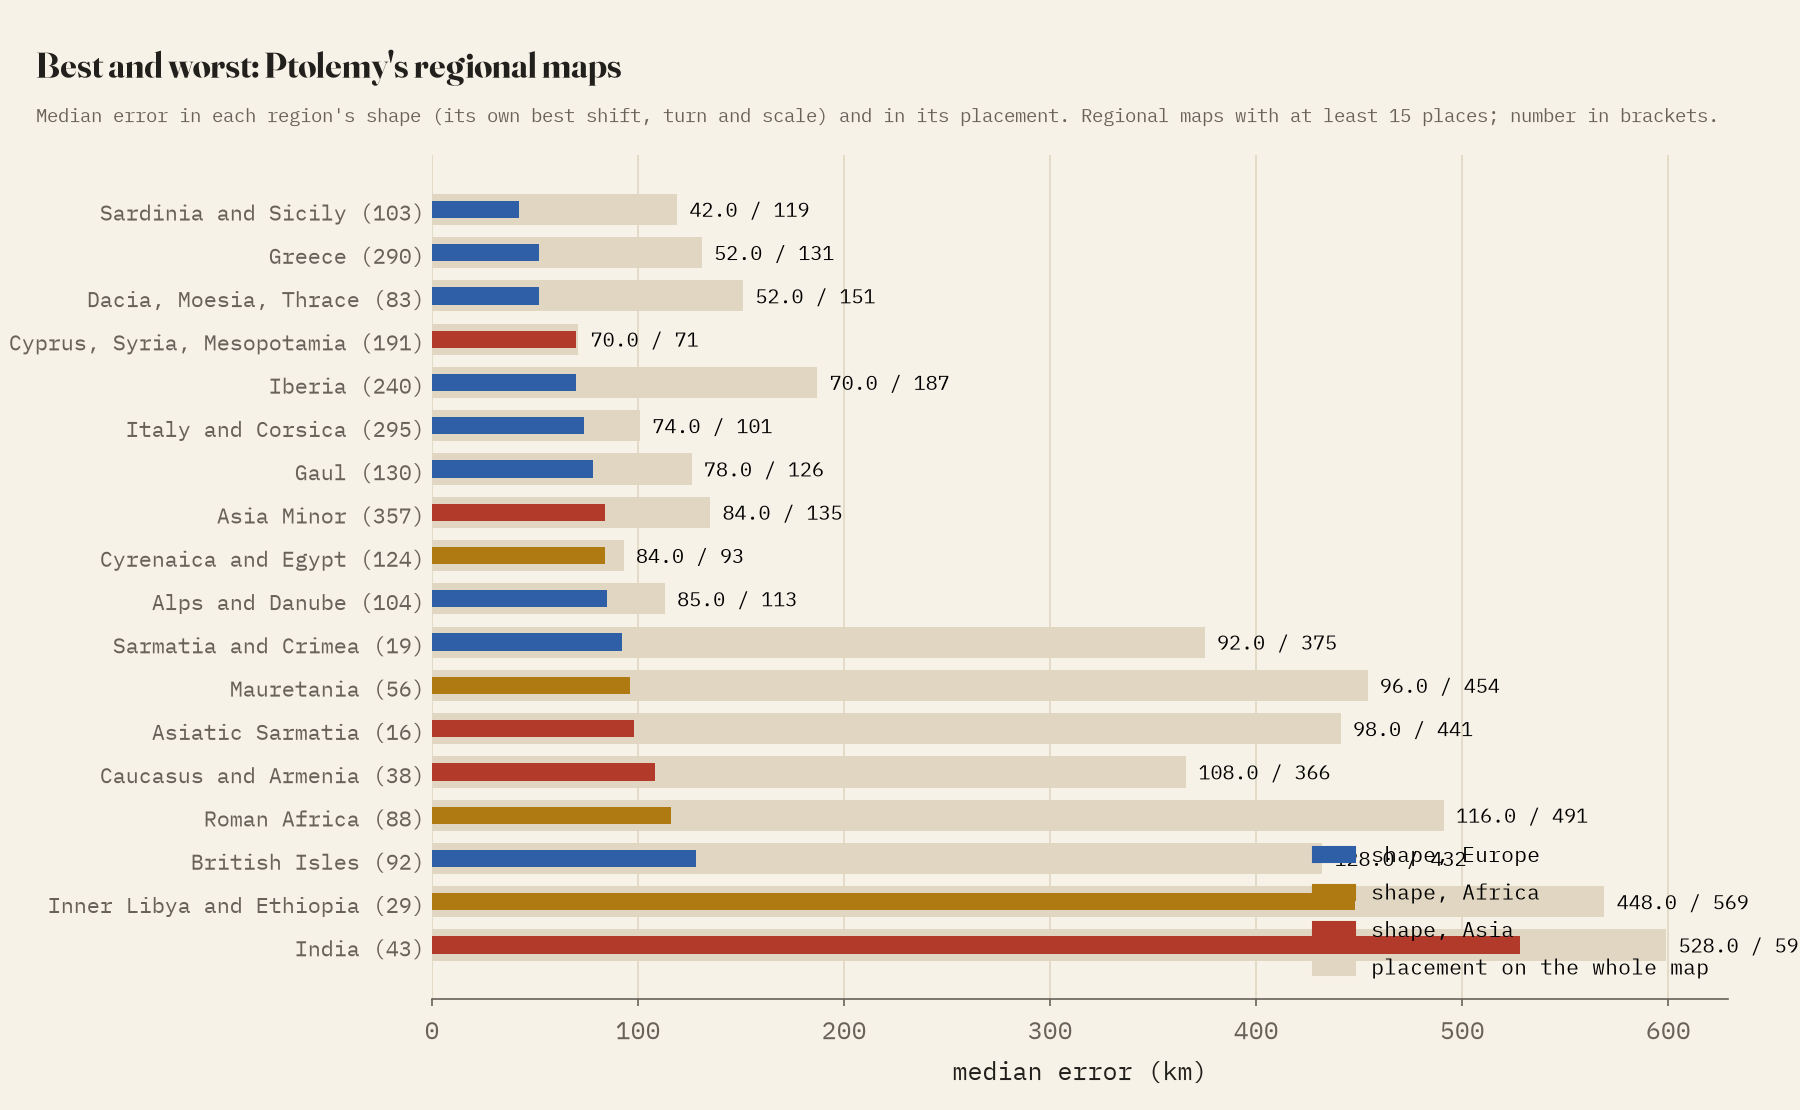
Taking each of Ptolemy’s 26 regional maps on its own, and laying it on the real map with the best shift, rotation and scale, the shapes are good to well under 100 km across most of the Roman world: Sardinia and Sicily a median 42 km, Greece 52 km, Italy 74 km. The worst are India (528 km), Inner Libya and Ethiopia (448 km) and, thanks to Scotland, the British Isles (128 km).
How I did this
The coordinates and identifications are Grasshoff and Defaux’s catalogue of the Geography. I used only points (towns, capes, river mouths, harbours, islands) that the editors identify, and matched them to modern coordinates where a gazetteer agreed on the ancient name, the modern name or both, or where I could place a cape or river mouth myself. Matches that sat oddly against their neighbours on Ptolemy’s map were dropped or checked by hand. The matched places favour the Roman Mediterranean; only 67 lie east of 60 degrees east, so the figures for India and the far east rest on few places and on identifications that are themselves debated. The two manuscript traditions, Omega and Xi, agree exactly for 69% of entries and fit reality equally well.
Notes and sources
- G. Grasshoff and O. Defaux, Catalog of Ptolemy’s Geography, main books (2019), CC BY 4.0.
- Pleiades gazetteer of past places, version 4.1, CC BY 3.0; Digital Atlas of the Roman Empire, CC BY-SA; Natural Earth (public domain).
- I wrote the text, with drafting and editing assistance from Claude (Anthropic), which also helped prepare the analysis code. I reviewed and checked all text and results.

