
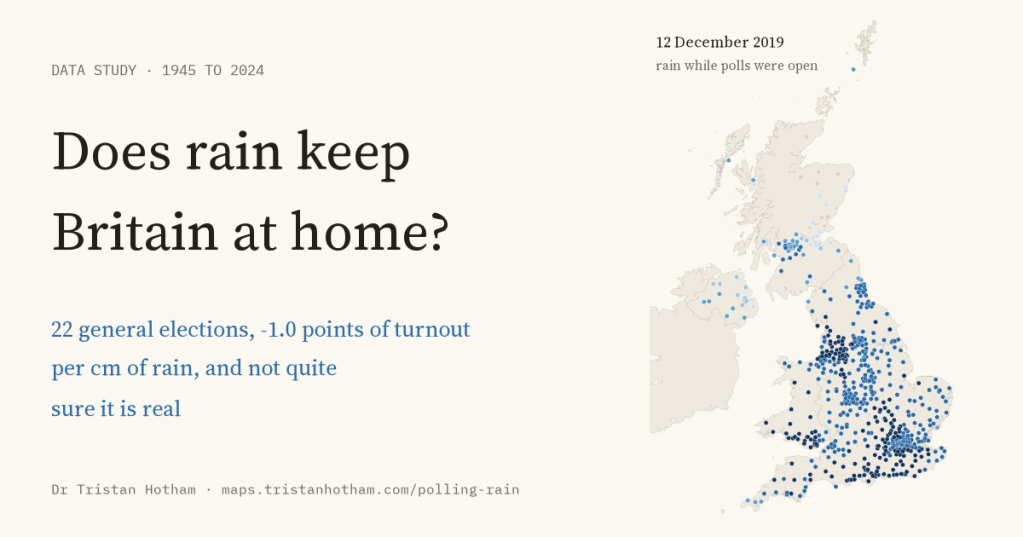
Every British election night someone blames the weather. I matched every constituency at every general election since 1945 to the rain that fell on it while its polls were open. Wetter seats did see slightly lower turnout, about a tenth of a point per millimetre. But with only 22 elections to learn from, even that small effect is not certain, and there is no sign that rain helps any party.
It is one of those things everyone seems to know. Rain on polling day keeps the less committed at home, so a wet Thursday is bad news for turnout, and maybe for one party in particular. In the United States political scientists have spent years on it, and a famous paper concluded that the Republicans should pray for rain. Studies in the Netherlands and Denmark found that rain lowers turnout a little. In Sweden they found nothing, and in Norway rain seemed to push turnout up.
Britain is a good place to test the idea. Its general elections happen on one day, its weather changes from one valley to the next, and its turnout has been recorded seat by seat for generations. So I took all 14,052 contested constituency contests at the 22 general elections from 1945 to 2024 and matched each one to hourly rain from a weather reanalysis, adding up the rain that fell during the hours its polls were actually open.
Mostly dry, sometimes very wet
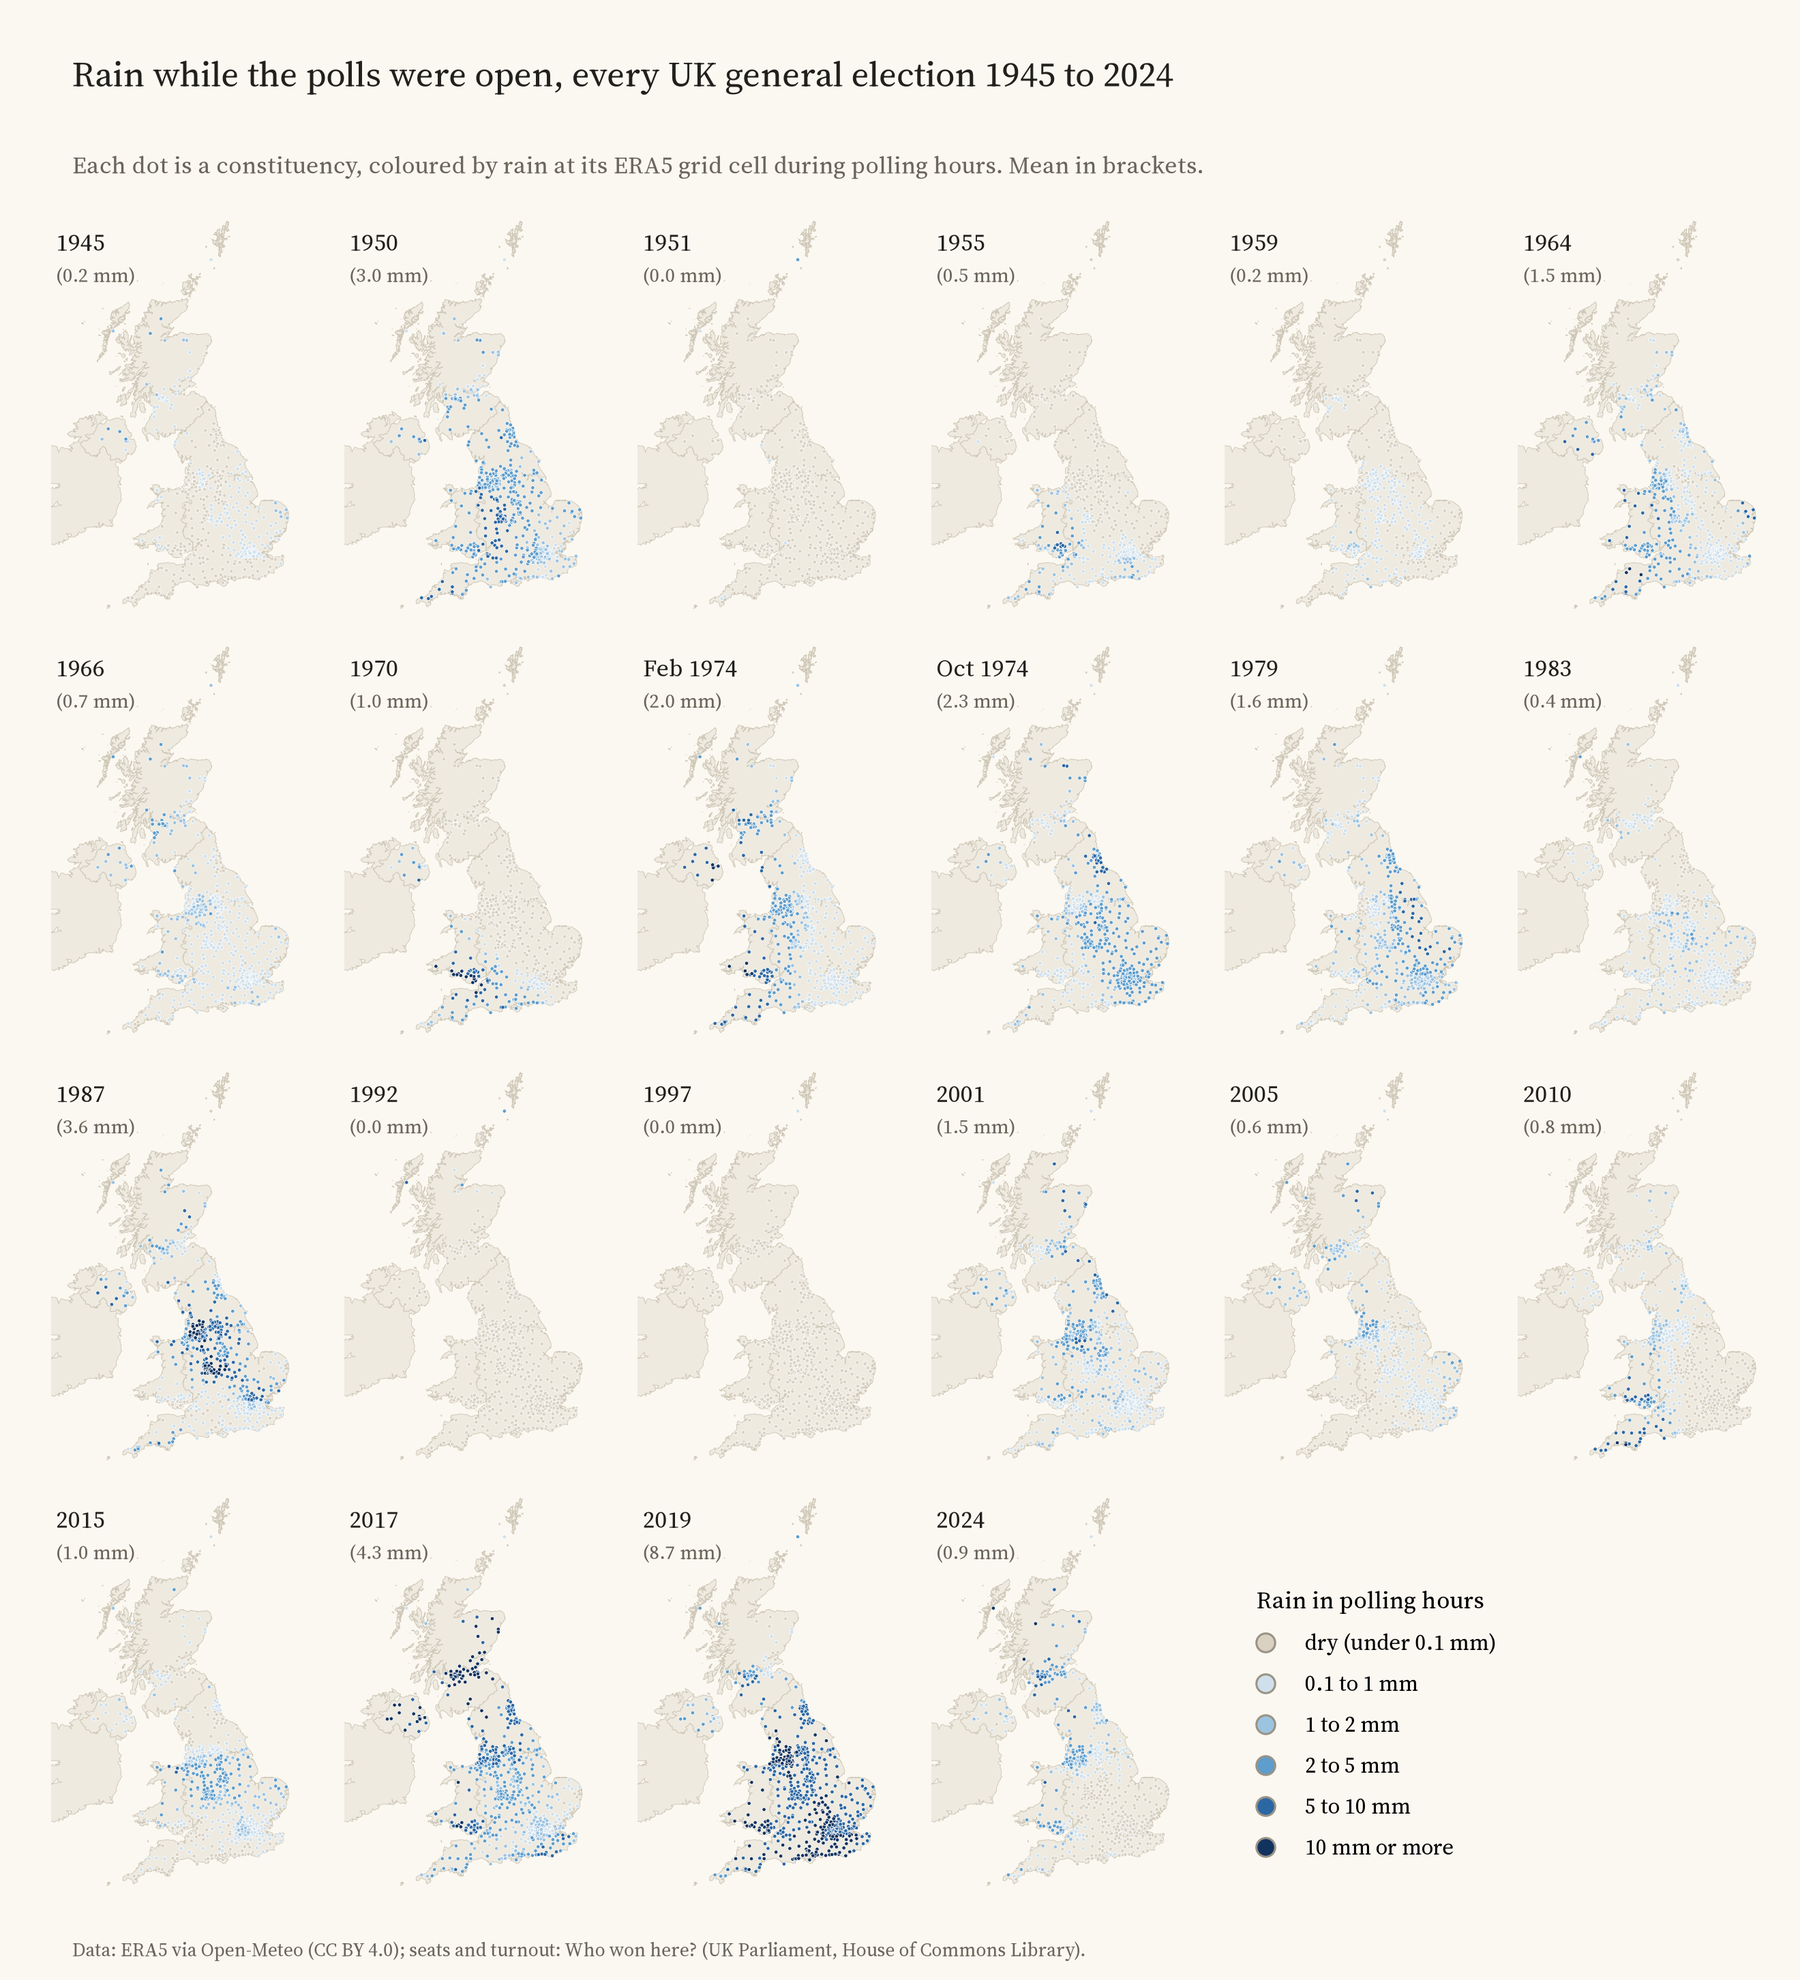
Most polling days have been kinder than you might think. In the typical contest only 0.4 mm of rain fell while the polls were open, and about a third of contests saw none at all. In 1951, 1992 and 1997 it was dry almost everywhere. The great exception is 12 December 2019: the average seat had 8.7 mm while the polls were open, and 88% of seats had 5 mm or more. June 2017 was the second wettest.
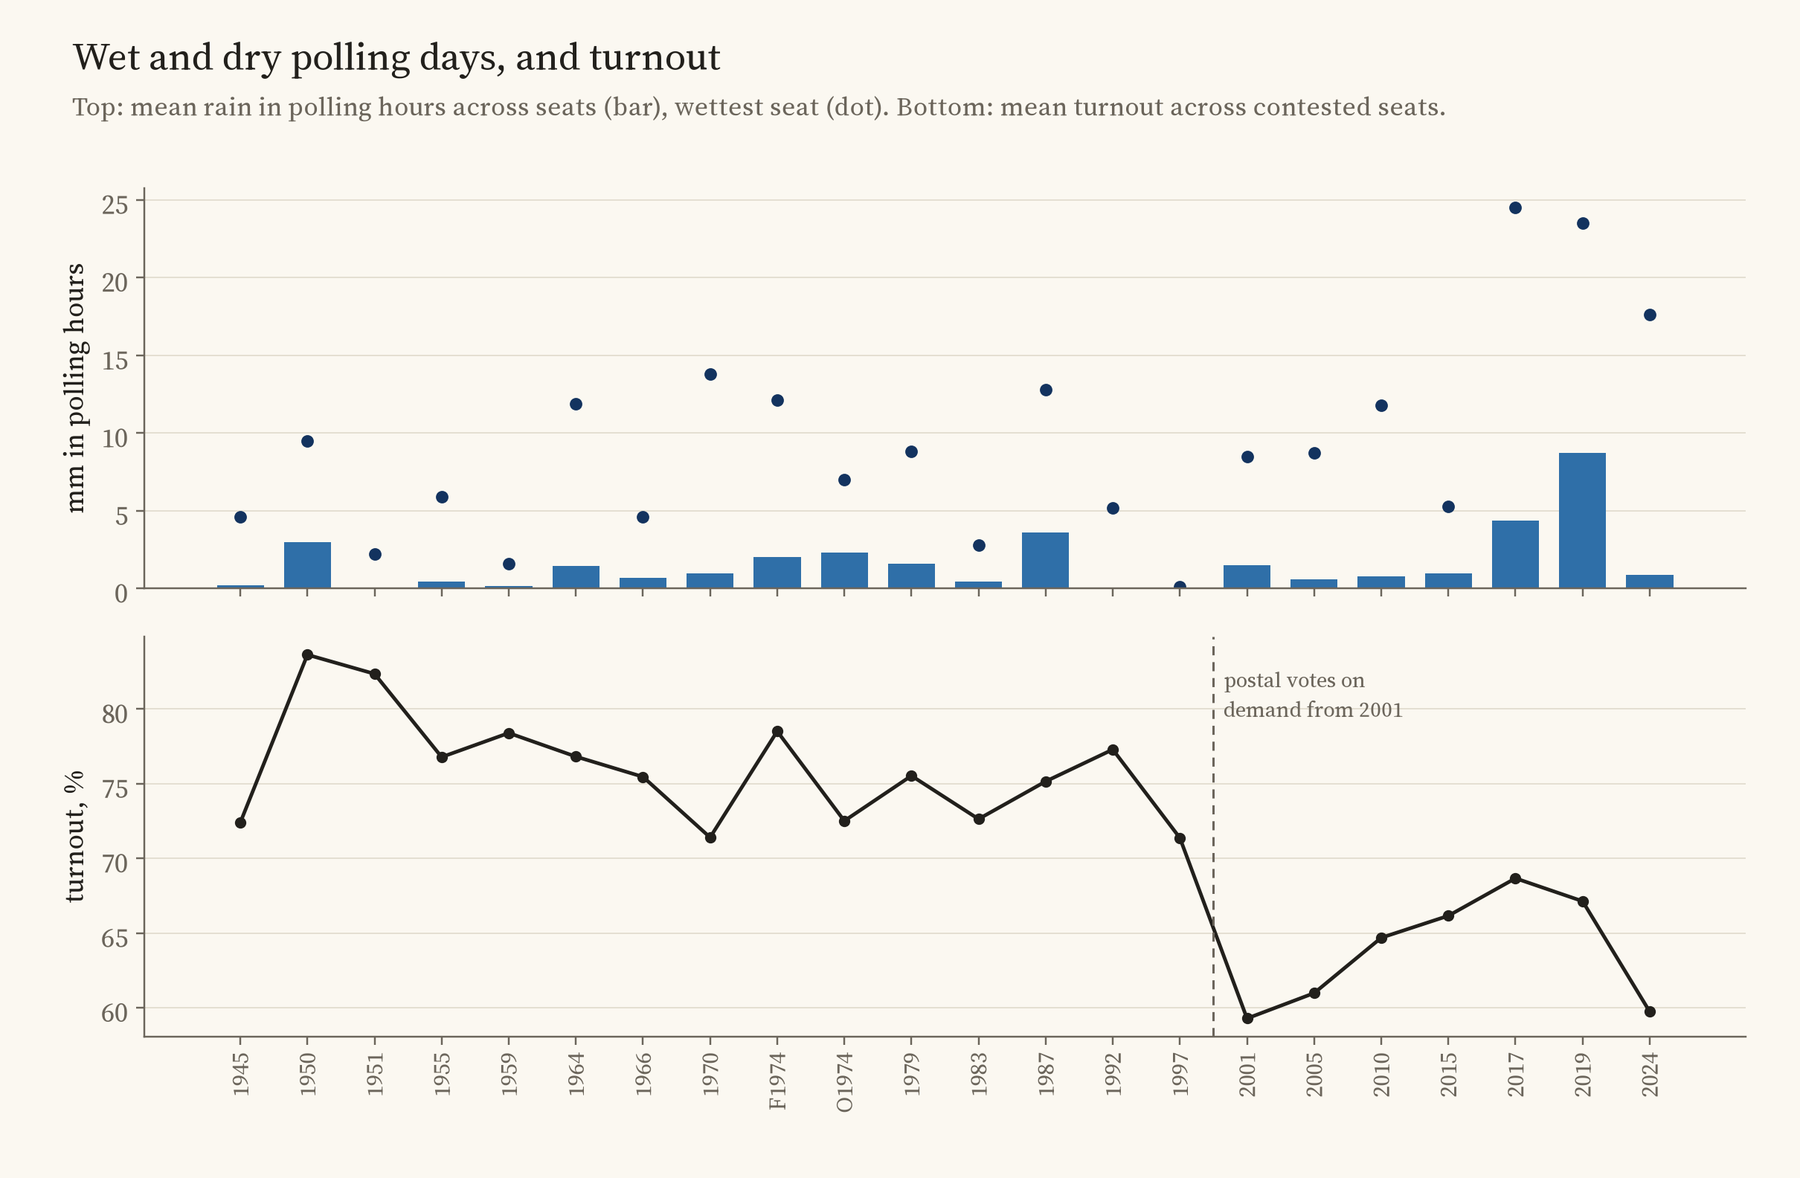
You cannot learn much by comparing whole elections. Turnout fell by more than ten points between 1997 and 2001, and neither day was unusually wet; turnout moves with how close the race feels and how much people care, not with the forecast.
A small dip in wetter seats
The fairer test compares each seat with itself. Was turnout lower than usual in a constituency when it was wetter than usual, compared with the rest of the country on the same day? On that test, each centimetre of rain during polling hours went with turnout 0.96 points lower. The uncertainty runs from -1.82 to -0.11. Put another way, about a tenth of a point per millimetre, or roughly half a point on a wet day with 5 mm of rain.
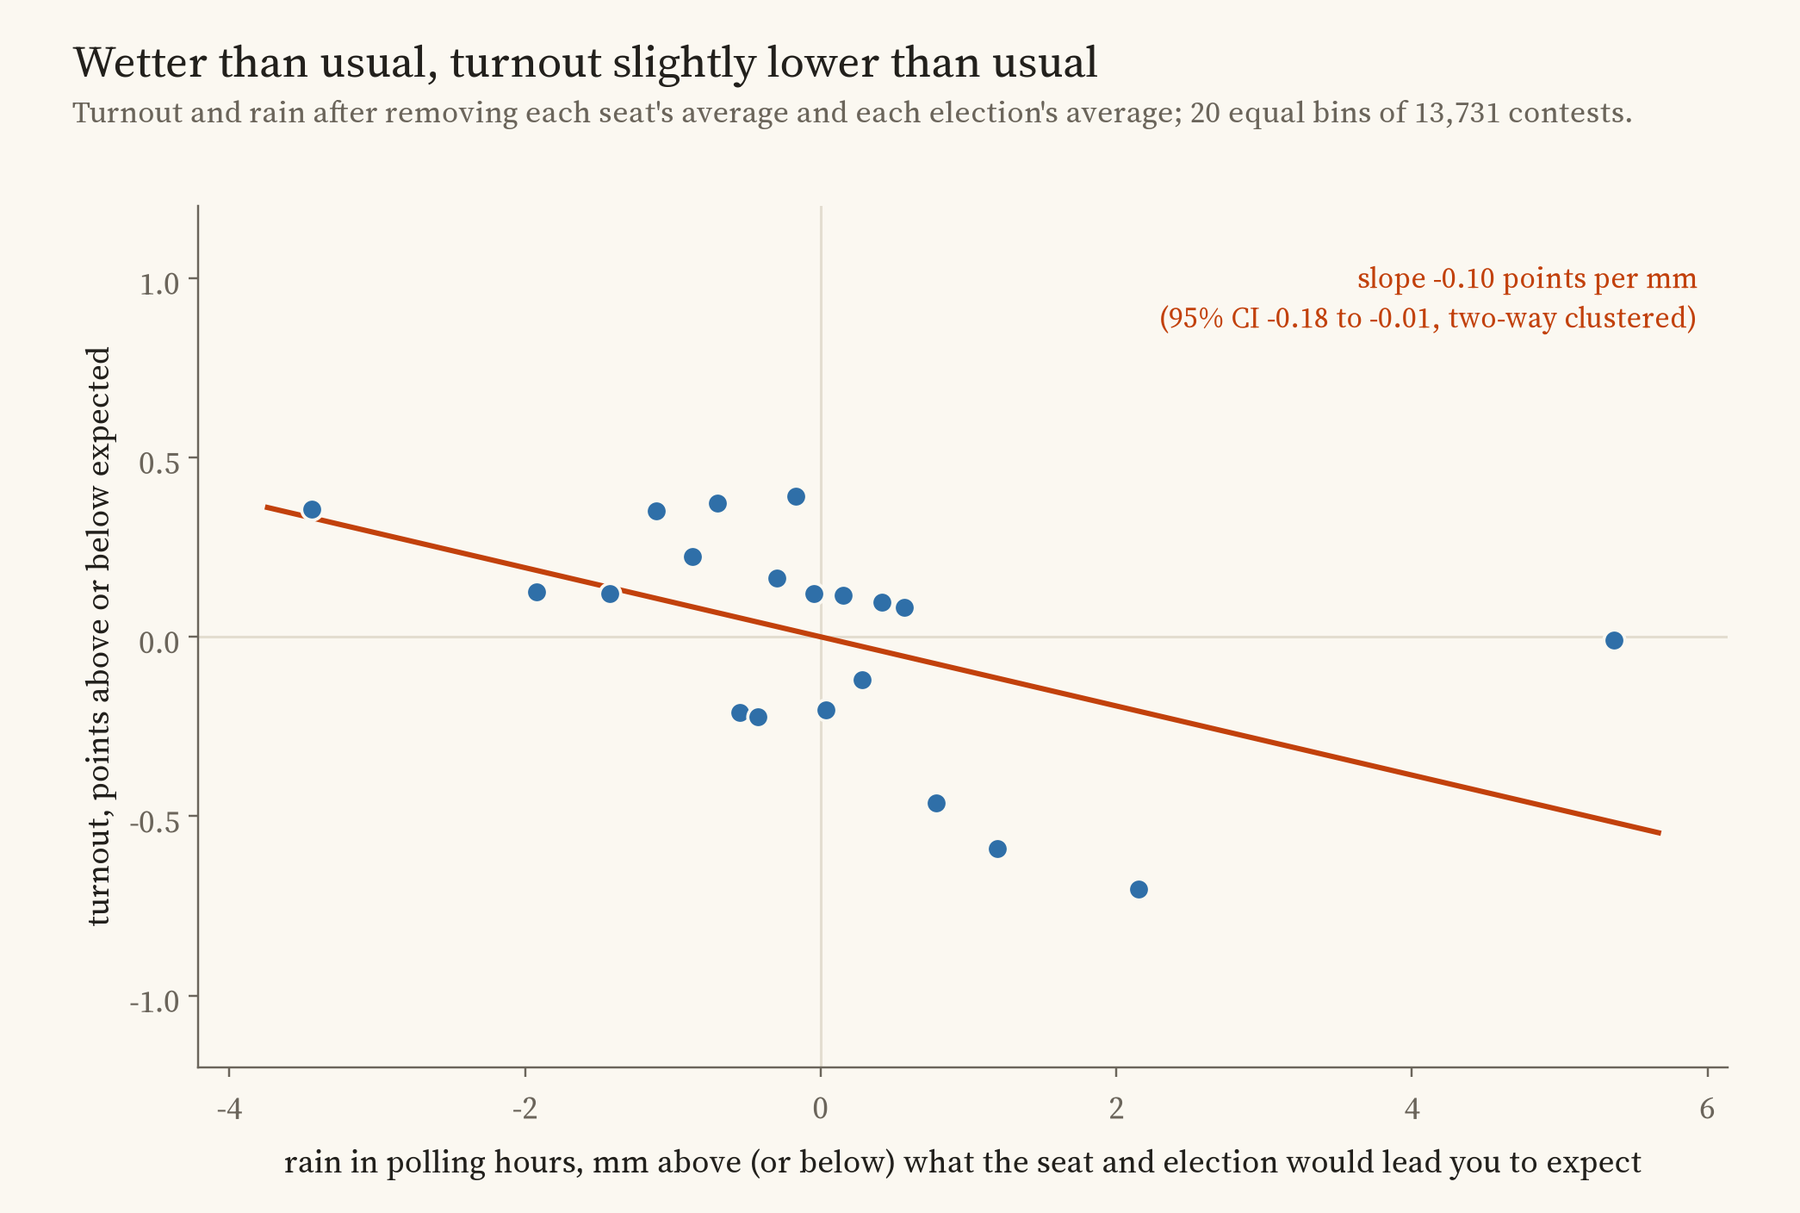
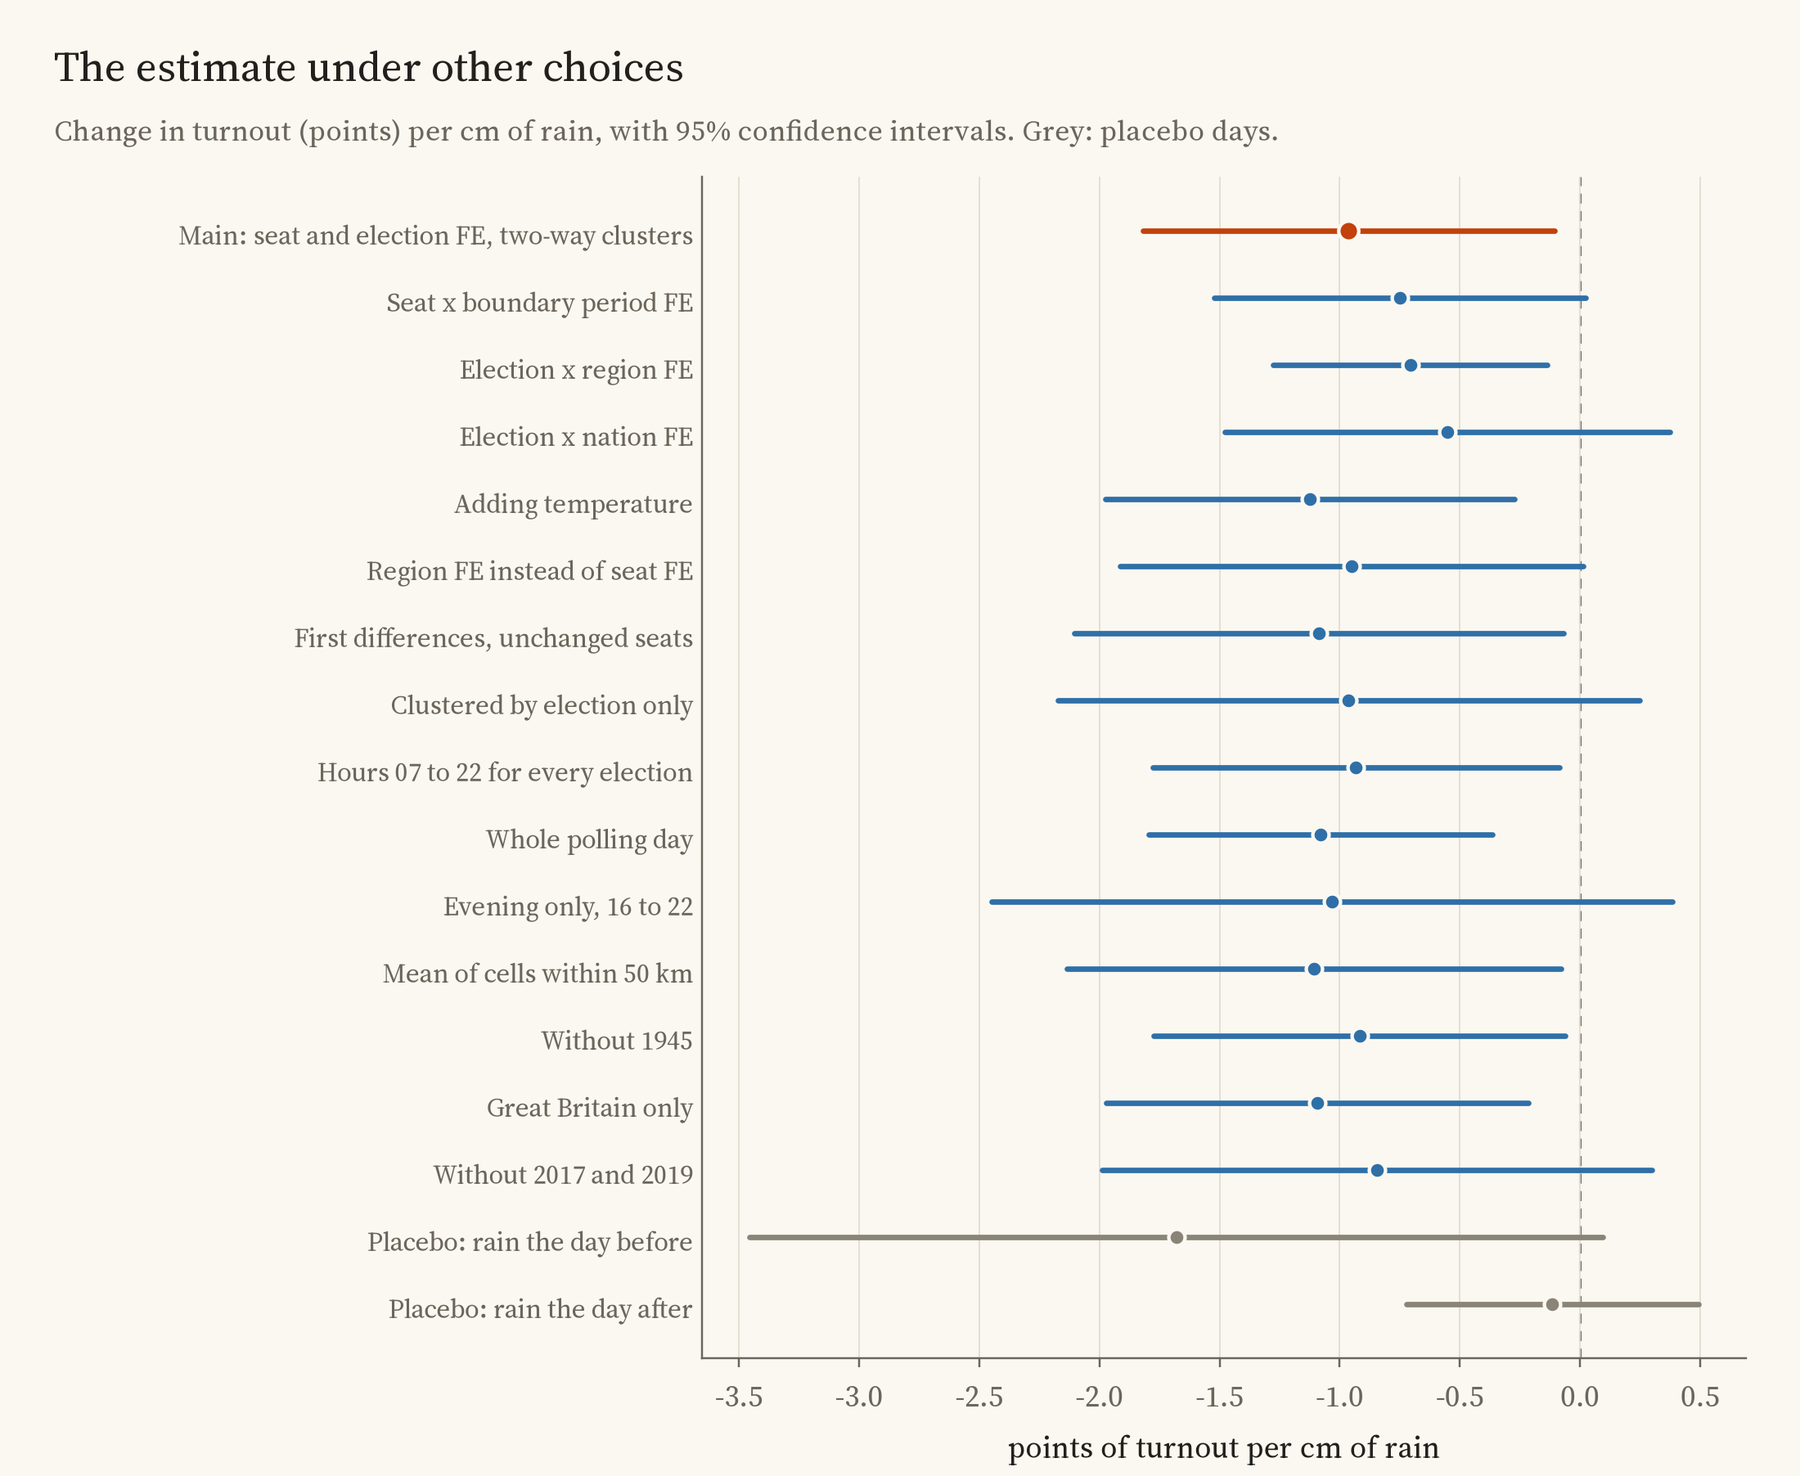
That is very close to a large Danish study, which found 0.95 points per centimetre, and it holds its direction whichever way I measure the rain or whichever election or region I leave out. If it is right, the downpour of December 2019 would have cost about 0.8 points of national turnout. Not nothing, but a long way from deciding an election.
Rain may cost British elections a fraction of a point of turnout. With only 22 elections, I cannot be sure it costs anything at all.
Why I am not sure
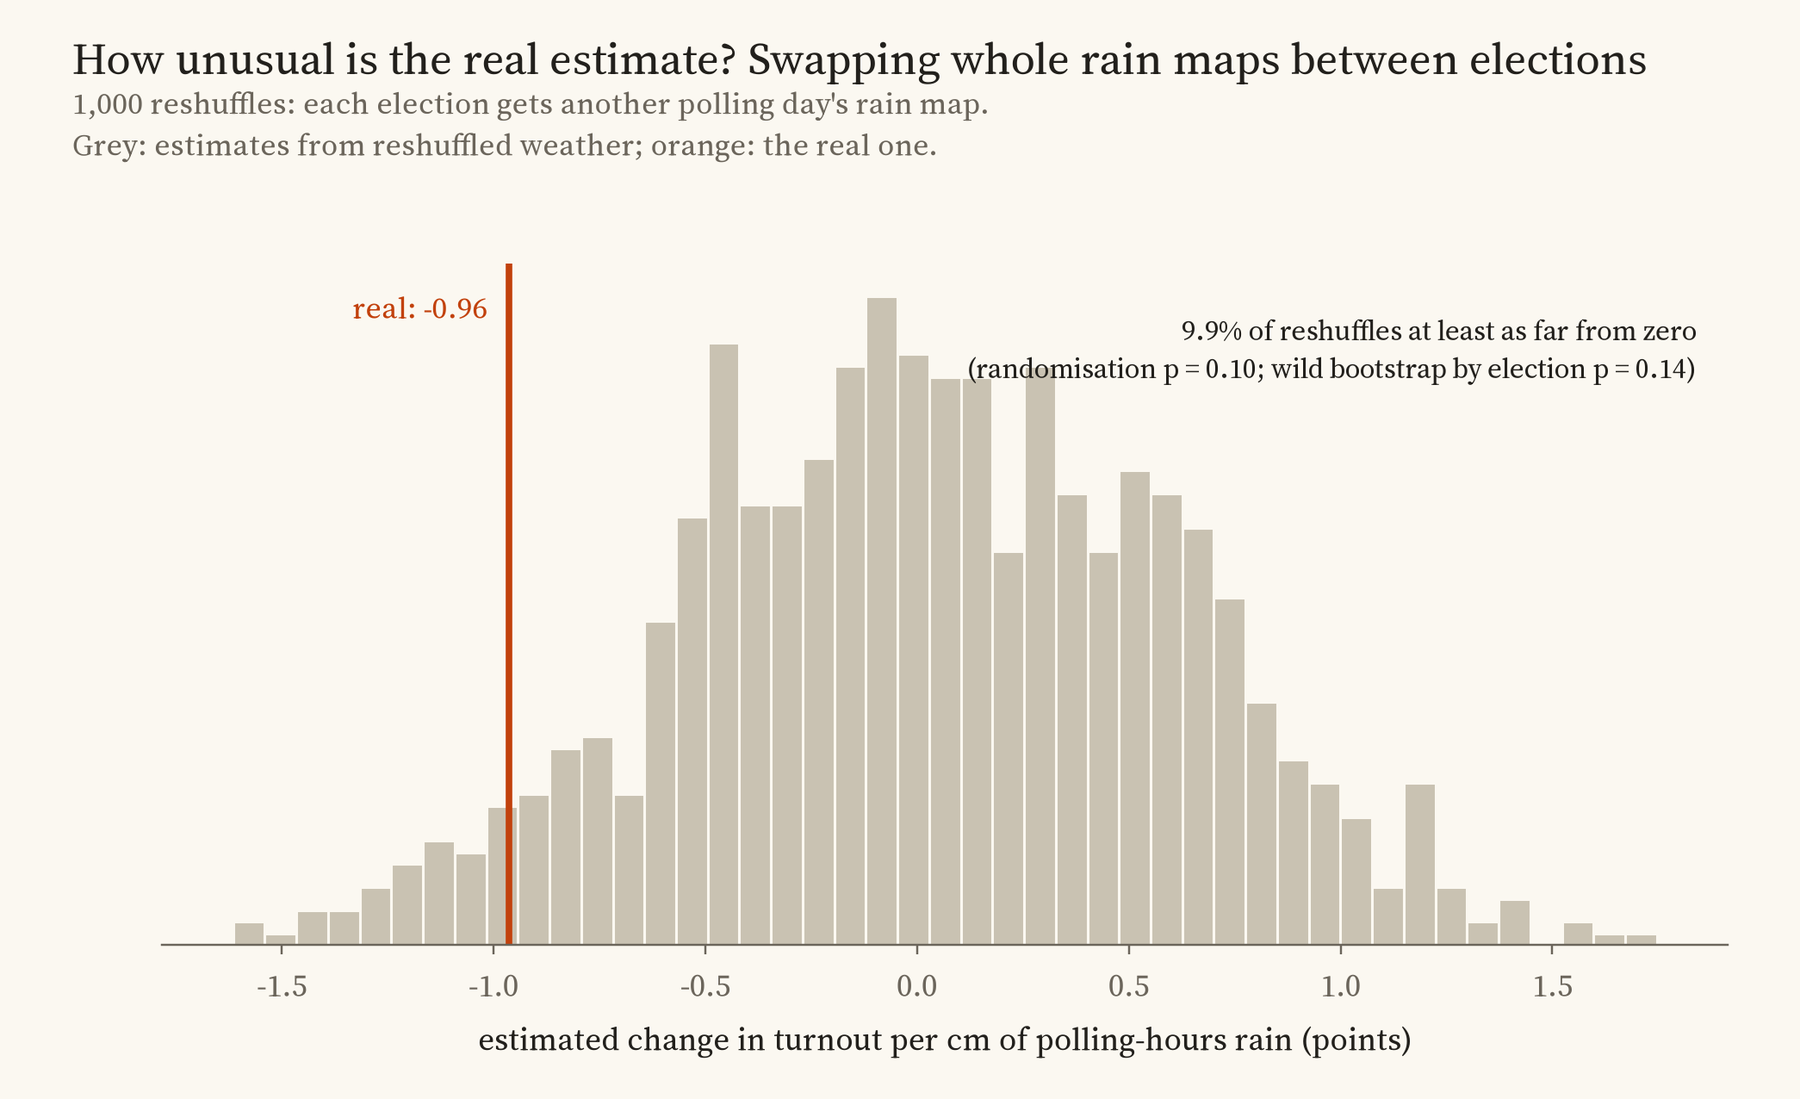
Here is the catch. Rain does not fall seat by seat. A band of rain soaks a whole region at once, and there have only been 22 general elections since 1945, so there are far fewer independent pieces of evidence than 13,731 contests suggest. When I allow for that, the result no longer clears the usual bar. Treating each election as a single block gives a p value of 0.14. And when I gave every election the rain map of a different polling day, a reshuffle that should produce nothing, the estimate came out at least as far from zero as the real one 9.9% of the time.
A second warning comes from a placebo. Rain on the day before polling day cannot have kept anyone from a polling station on the day itself, yet it shows a link with turnout at least as strong (-1.68 points per centimetre, though the uncertainty is wide). Rain on the day after shows nothing. Maybe a wet eve of poll really does matter, for canvassers knocking on doors or for people posting their ballots. Or maybe some places just had both wetter weather and lower turnout in some years for other reasons. Put through the same checks as the main result, the day before actually looks at least as unusual as polling day itself. Either way, it is a reason not to treat the main number as a clean effect of rain.
No sign of partisan rain
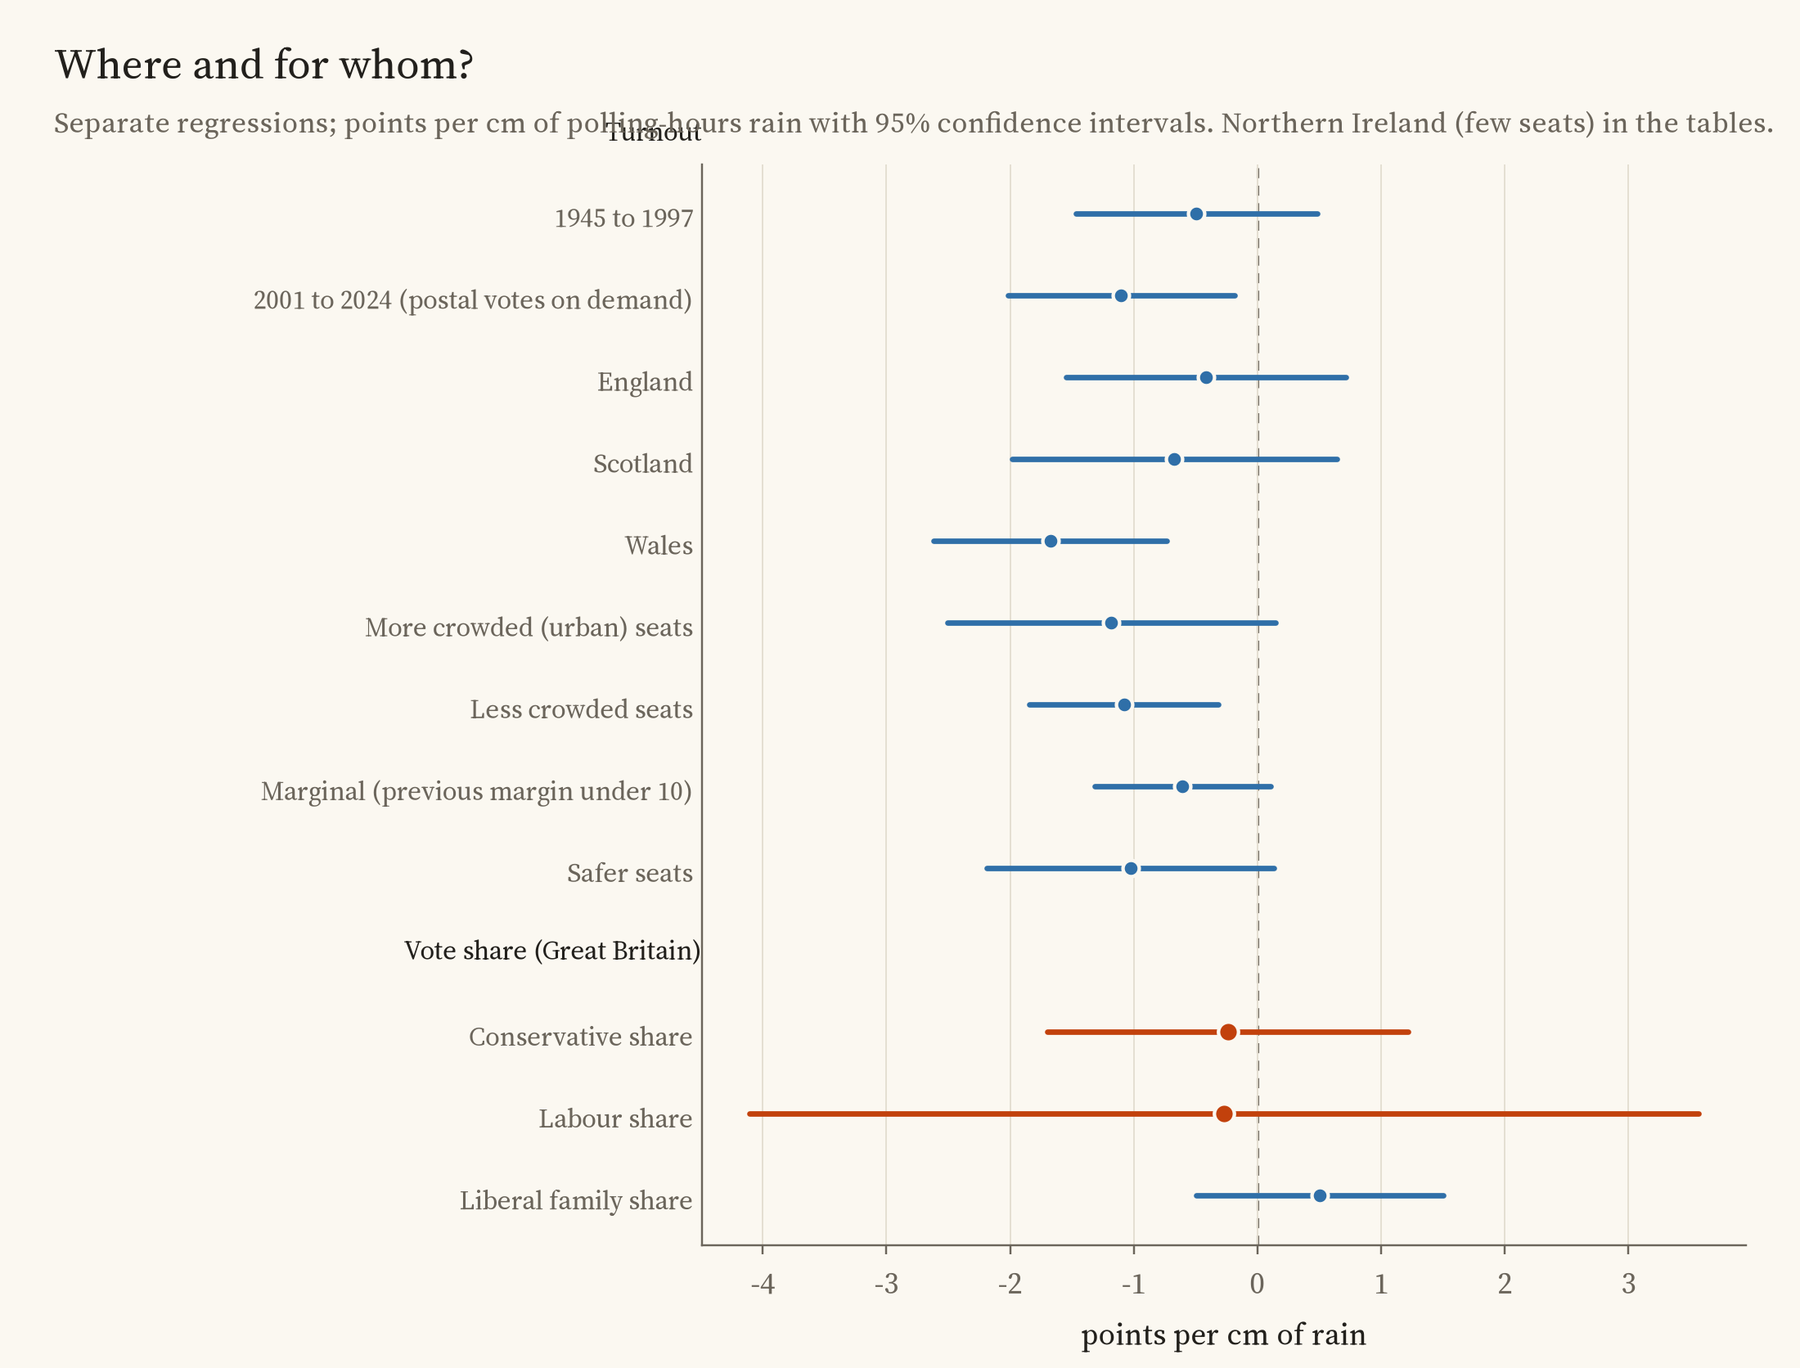
What about the idea that rain helps the Conservatives? I find no sign of it. Rain has no clear link with the Conservative share (-0.24 points per centimetre, with an interval from -1.70 to 1.22) or with Labour’s (-0.27, from -4.11 to 3.57).
I also expected postal votes on demand, available since 2001, to soften any rain effect, because people who vote by post never have to step outside on the day. The opposite turned up: the estimate is -0.49 for 1945 to 1997 and -1.10 for 2001 to 2024. I would not read much into that, because the two wettest elections both fall in the later period. Busy urban seats and quieter rural ones, marginal and safe seats, all look much the same.
How I did this
The elections come from my dataset Who Won Here?, which has every contest with its turnout and a point for each seat. I left out the university seats of 1945 and 22 seats whose 1945 poll was, or may have been, put back a week or two for local wakes weeks. The weather is the ERA5 reanalysis, served by Open-Meteo, at the grid cell nearest each seat, added up over the real polling hours: 8am to 9pm in 1945 (my assumption, as candidates could ask for an extra hour), 7am to 9pm from 1950 and 7am to 10pm from 1970. The model compares each seat with itself across elections and each election with its own national average. I wrote the plan down before running it, and report the planned test first.
The limits matter. The weather grid is coarse, about 30 km across, so many city seats share one value and short heavy showers are smoothed away; that kind of error tends to shrink an effect, so the real one could be a little larger. Turnout is counted per seat, not per person, so this cannot say who stayed at home. Postal votes cast before polling day count in turnout but were never rained on. And the honest summary is this: rain may keep a few people at home, but 22 elections are not enough to be sure.
Notes and sources
- Data: ERA5 hourly reanalysis (Copernicus Climate Change Service) via the Open-Meteo Historical Weather API, CC BY 4.0 (weather data by Open-Meteo.com); Hotham (2026) Who Won Here? (UK Parliament and House of Commons Library results, Open Parliament Licence v3.0). Polling hours: House of Commons Library note SN/PC/05517. Base map: OpenFreeMap, OpenStreetMap contributors (ODbL).
- Related research: B. Gomez, T. Hansford and G. Krause, Journal of Politics (2007); A. Cooperman, Political Analysis (2017); S. Damsbo-Svendsen and K. M. Hansen, Electoral Studies (2023); M. Persson, A. Sundell and R. Öhrvall, Electoral Studies (2014); R. Eisinga, M. Te Grotenhuis and B. Pelzer, International Journal of Biometeorology (2012); J. Mellon, American Journal of Political Science (2025).
- I wrote the text, with drafting and editing assistance from Claude (Anthropic), which also helped prepare the analysis code. I reviewed and checked all text and results.

