
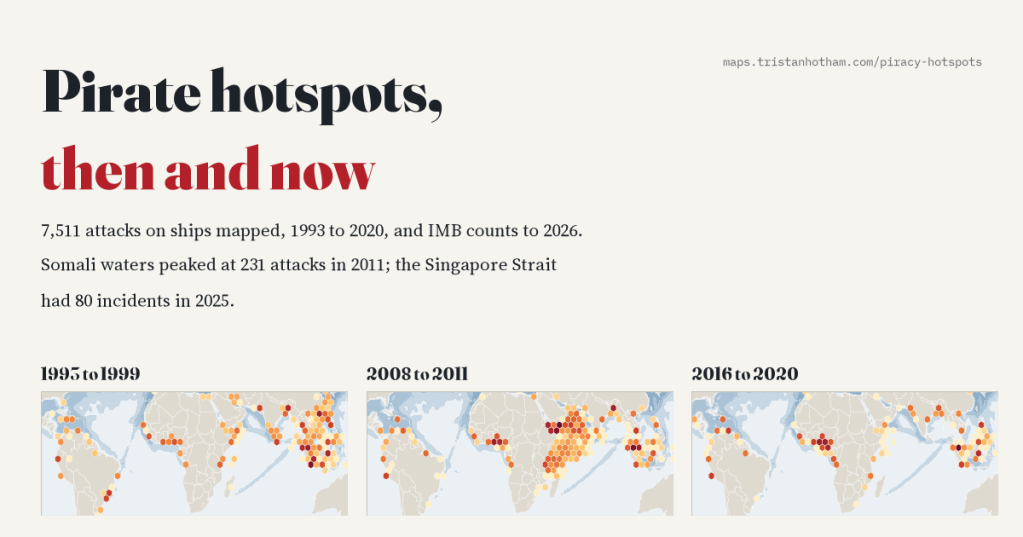
Where are the pirates? I mapped 7,511 attacks on ships from 1993 to 2020 and followed the hotspots as they moved: from the South China Sea and the Strait of Malacca, to the waters off Somalia, to the Gulf of Guinea. Then I brought the story up to today, when the busiest pirate waters in the world are the Singapore Strait, and Somali hijackers are back.
Ask most people where pirates operate today and they will say Somalia. They are picturing skiffs and ladders, a tanker held for ransom off the Horn of Africa, the film with Tom Hanks. That happened, and for four years it was the biggest piracy story in the world. But piracy has never stayed in one place for long.
Every attack on a merchant ship that gets reported ends up in the files of the International Maritime Bureau’s Piracy Reporting Centre in Kuala Lumpur, or in the US National Geospatial-Intelligence Agency’s warnings to shipping. Four researchers, Benden, Feng, Howell and Dalla Riva, turned those reports into an open database, Crime at Sea, with a position for every one of 7,511 attacks and attempted attacks from 1993 to 2020. I put them on a map and played it, year by year.
Asia first
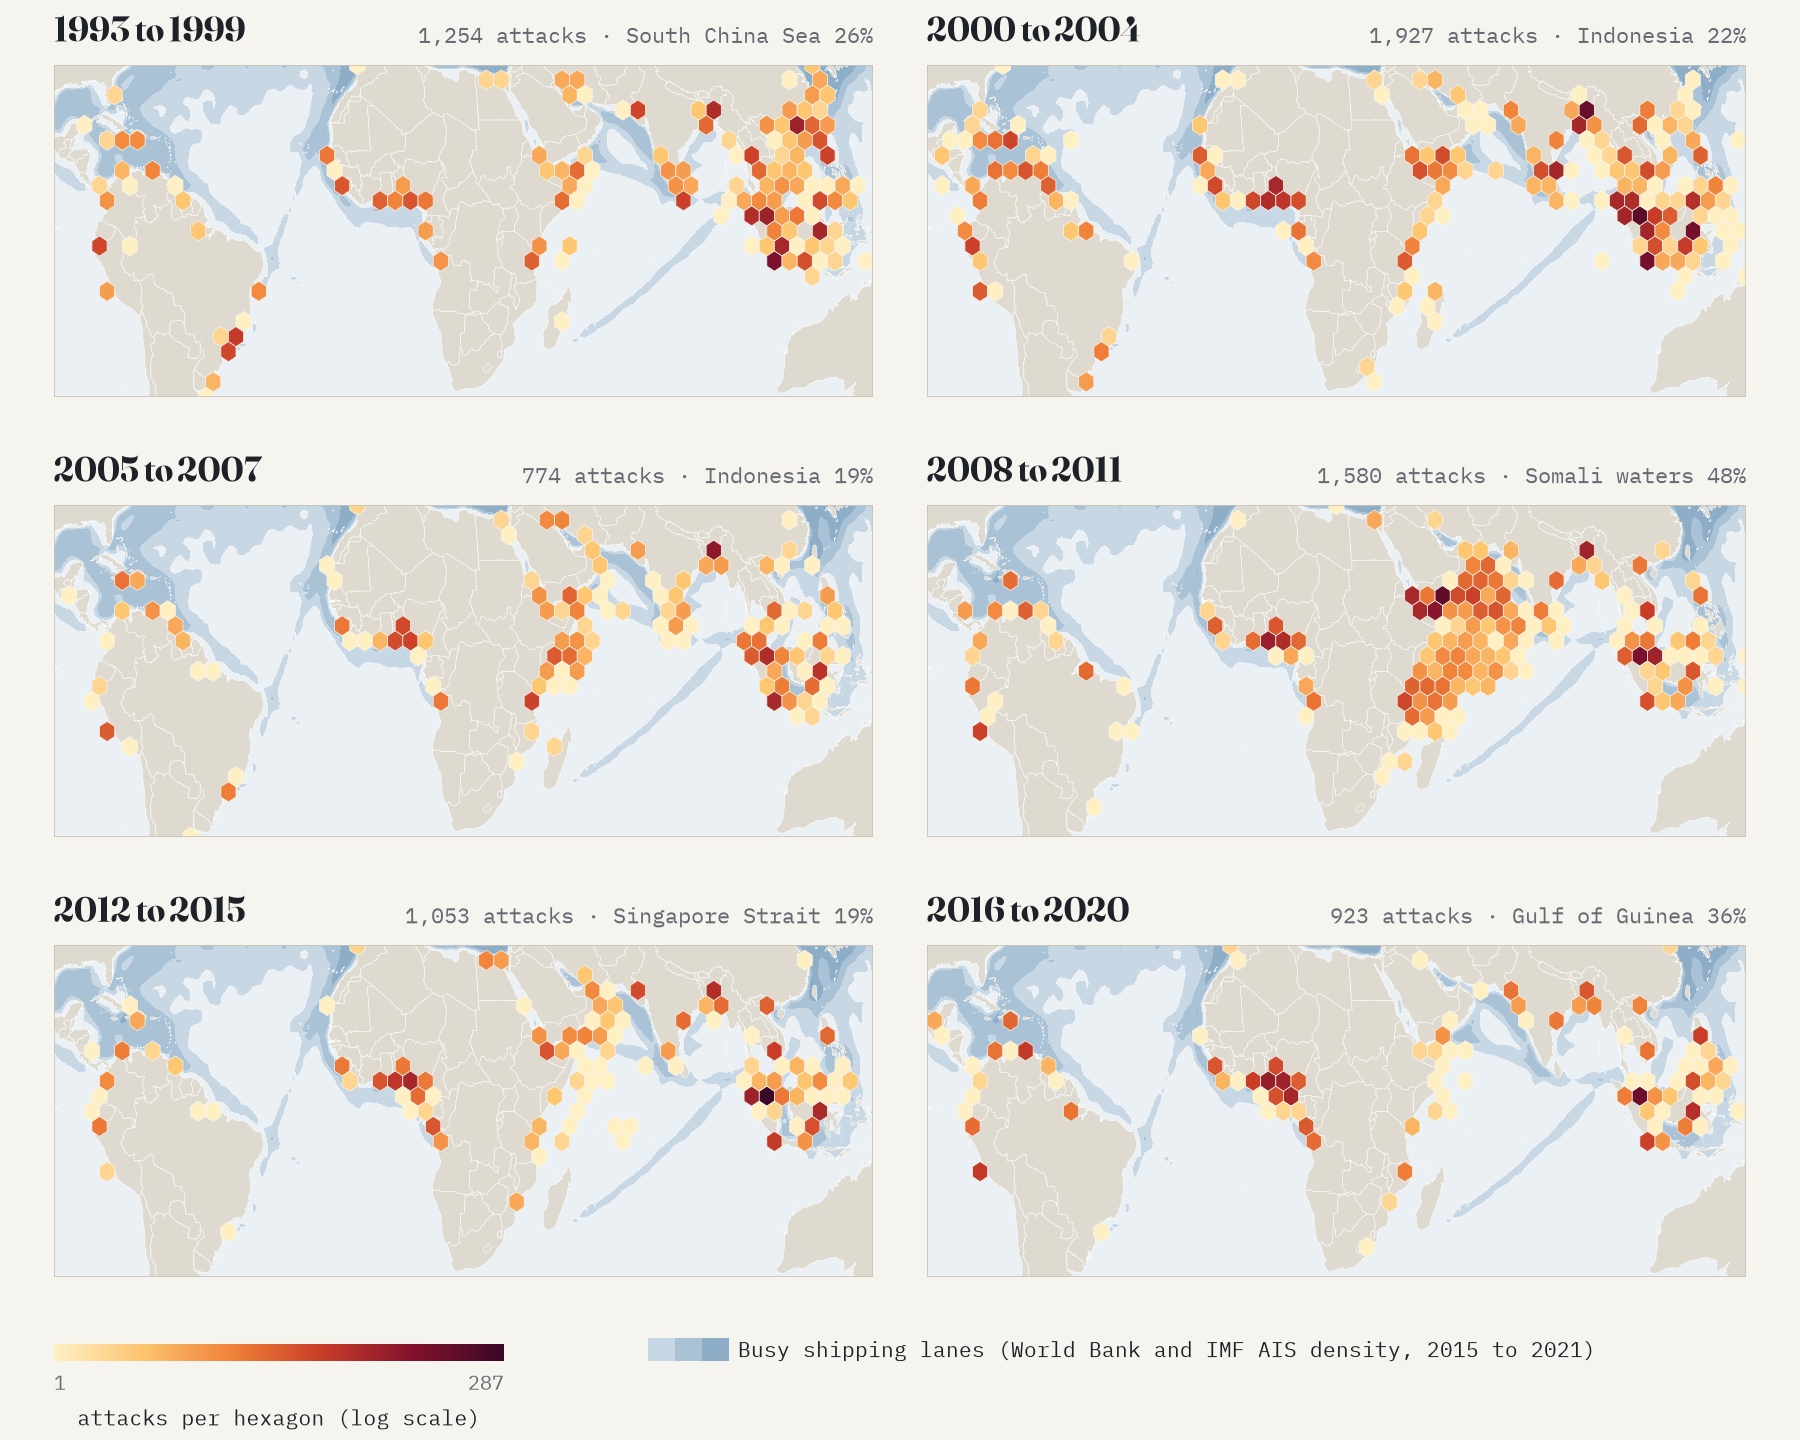
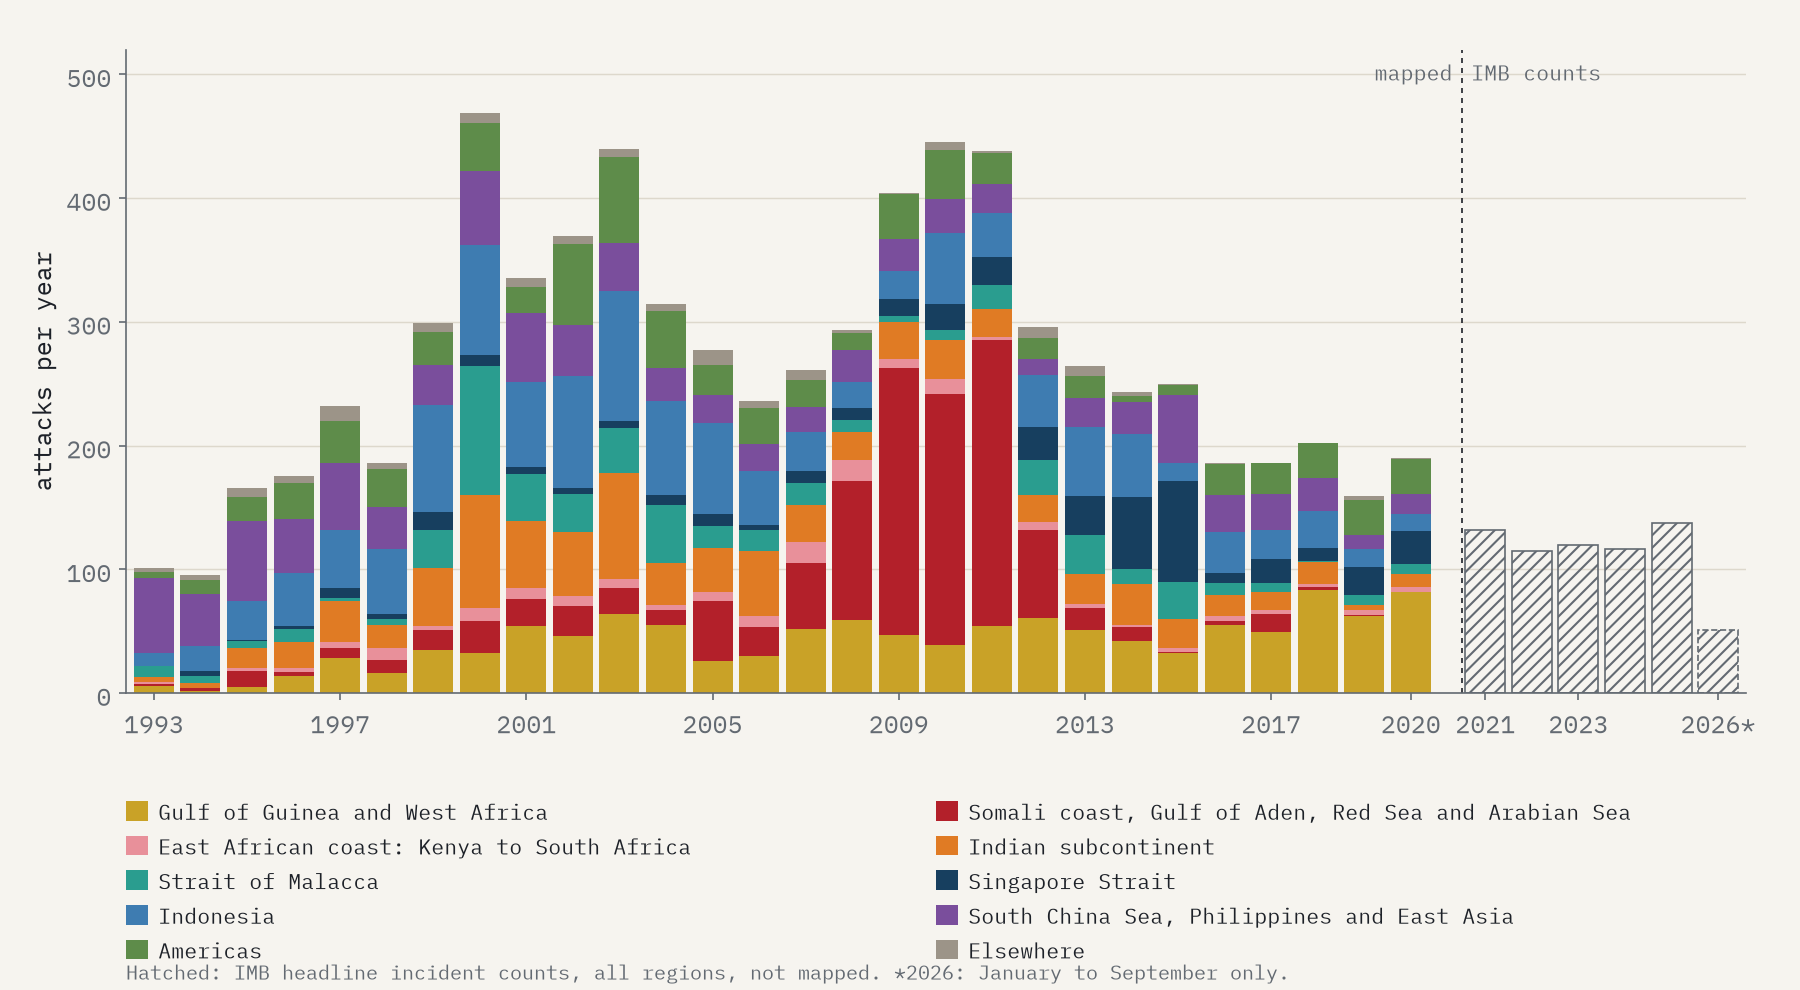
In the 1990s piracy was mostly an Asian problem. From 1993 to 1999 the South China Sea, the Philippines and East Asian waters had 26% of all reported attacks, more than anywhere else, with Indonesia close behind and overtaking them by 1998. Indonesian attacks peaked at 105 in 2003. The busiest places were not lonely stretches of sea but crowded anchorages: Jakarta, Belawan in Sumatra, and Chittagong in Bangladesh, which across all 28 years is the busiest single square on the whole map, with 366 attacks.
Then came the Strait of Malacca, the narrow channel between Sumatra and Malaysia that carries much of the trade between Europe and East Asia. It peaked at 104 attacks in 2000 and averaged 51 a year from 2000 to 2004. And then it fell, to 18 in 2005 and about 14 a year after that, as Indonesia, Malaysia and Singapore began coordinated sea and air patrols, and after the 2004 tsunami devastated the coast of Aceh.
Somalia, far out at sea
Then the hotspot jumped west. Attacks in Somali waters, the Gulf of Aden, the southern Red Sea and the Arabian Sea went from 53 in 2007 to 231 in 2011. In 2008 to 2011 they were 48% of all the attacks in the world, and 163 of the 197 hijackings.
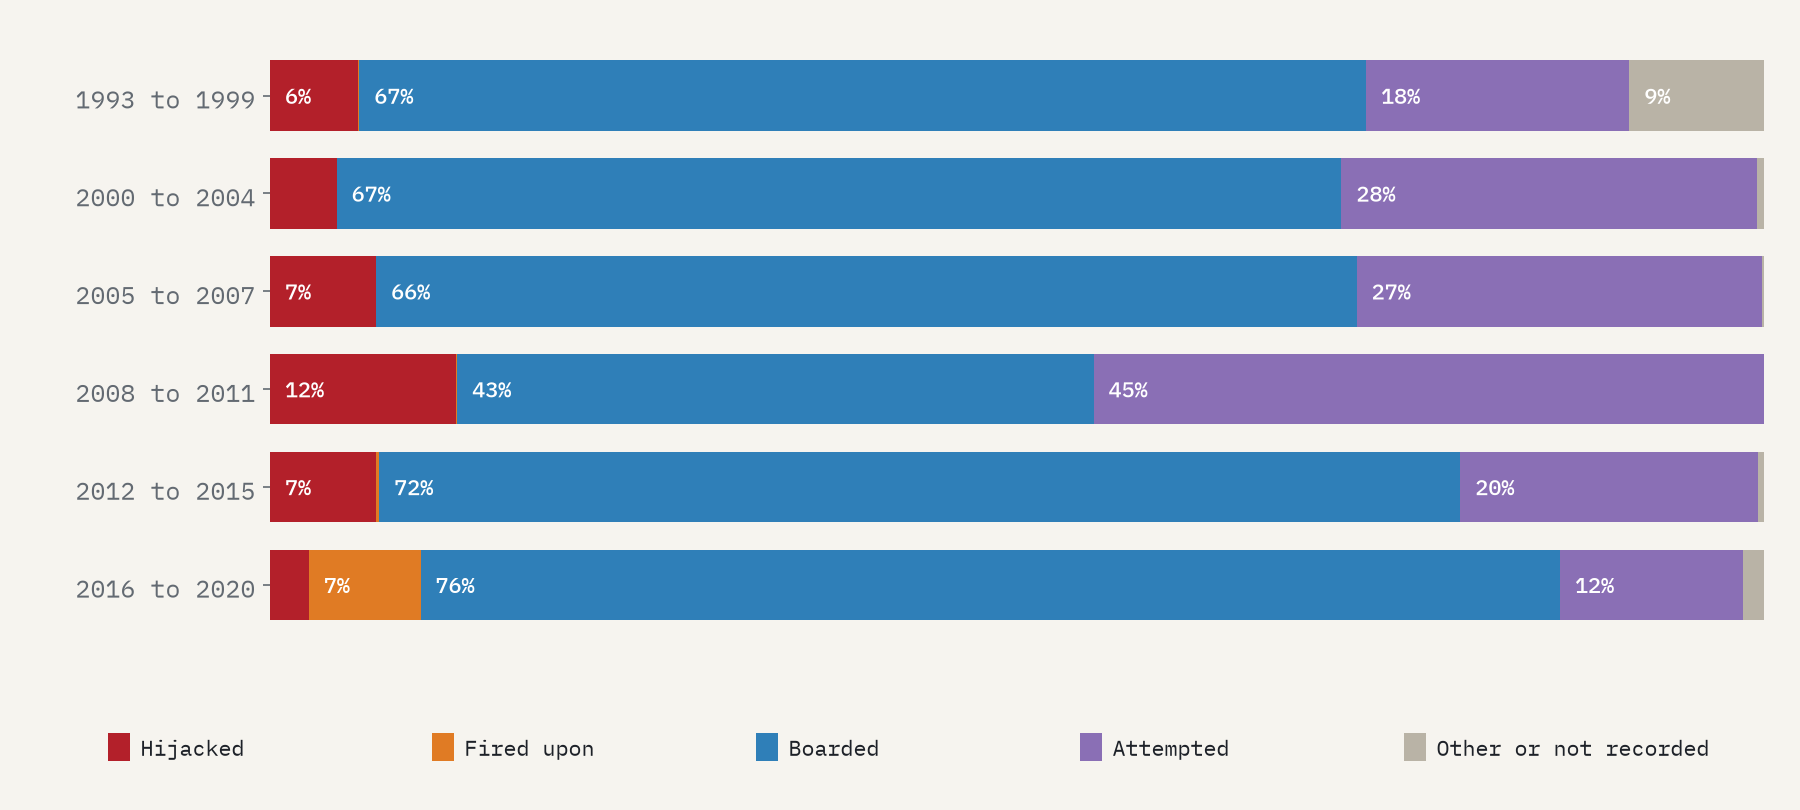
They were a different kind of piracy. Almost everywhere else, attacks happen close to land: half are within 10.1 km of the shore, and ships at anchor are hit a median 5.2 km out. Somali pirates, using motherships to tow their skiffs, hunted ships under way far out in the ocean. The median distance from shore of their attacks was 131 km in 2008 to 2011 and 204 km in 2010. Most of their attacks failed: 73% were attempts that never got on board.
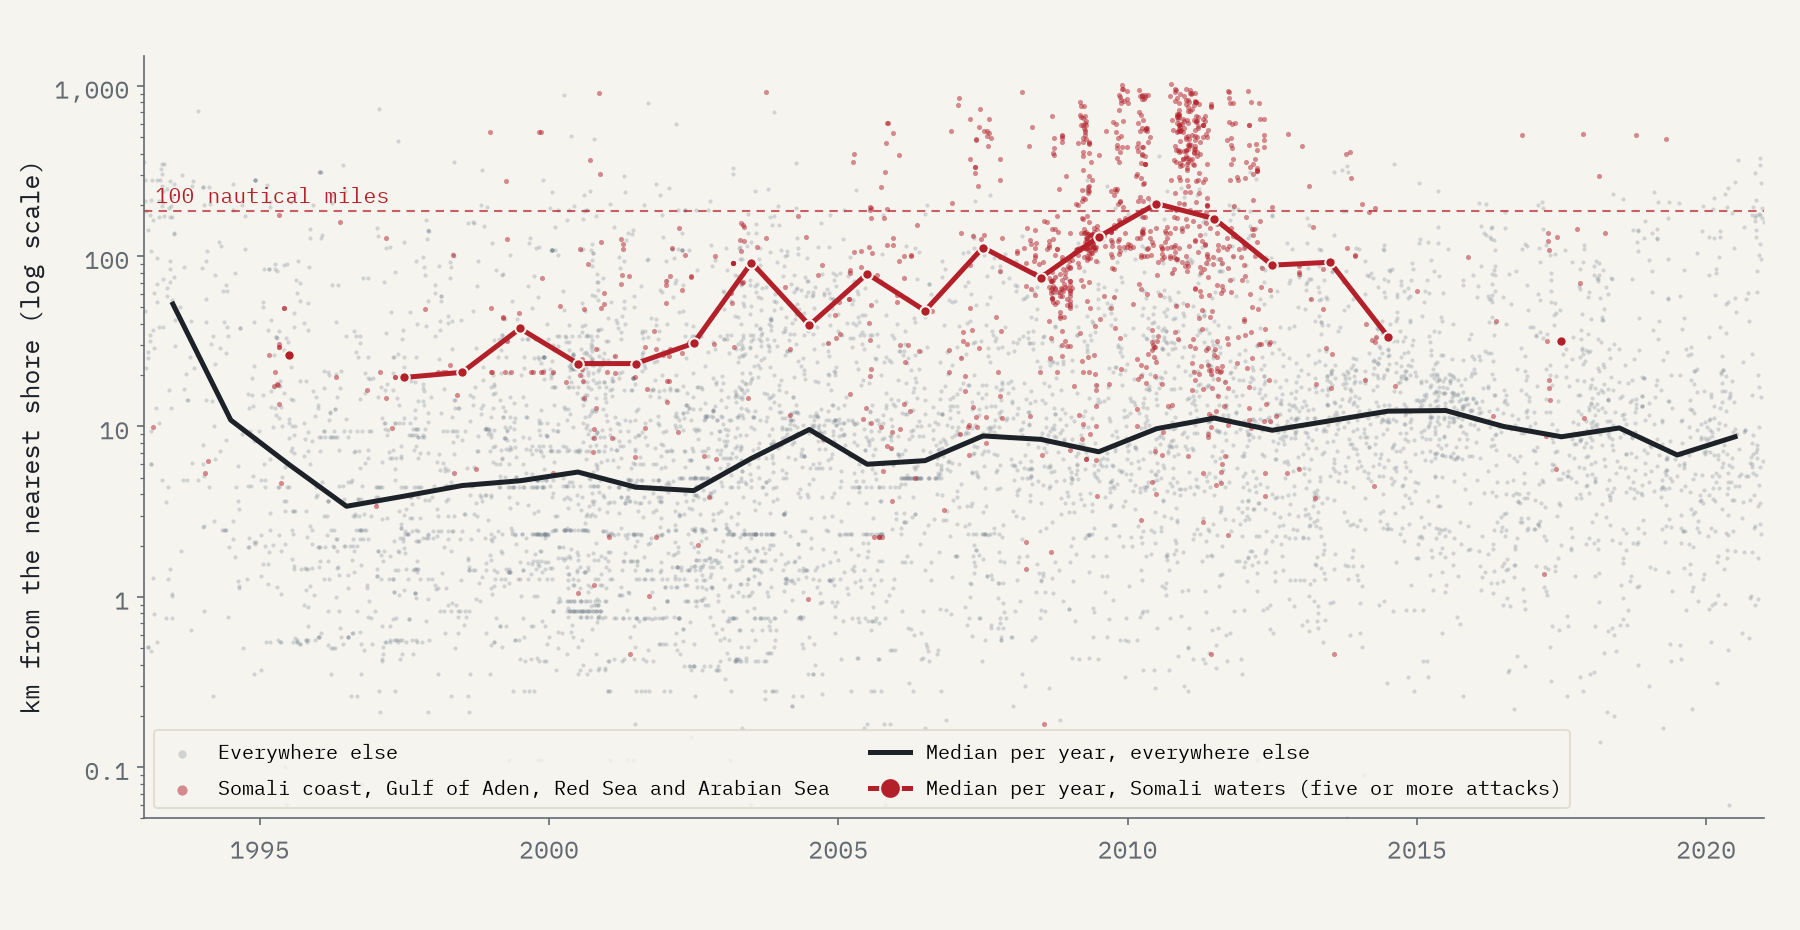
And then they collapsed: down 92% between 2011 and 2013, as warships patrolled the Gulf of Aden, ships carried armed guards and took protective measures, and pirate groups were pursued ashore. From 2014 to 2020 the database has just 3 hijackings in those waters, all in 2017.
Piracy never goes away. It moves to wherever ships slow down, the law is thin and somebody will pay.
The Gulf of Guinea
As Somalia went quiet, West Africa took over. The anchorages off Lagos had always been busy, but the Gulf of Guinea became the world’s leading pirate region, with 83 attacks in 2018 and 82 in 2020, 43% of the world’s total. Its attacks moved further offshore too, the median distance rising from 7.2 km to 23.2 km, as gangs from the Niger Delta took crews off ships and held them for ransom. 60 of its 331 reports from 2016 to 2020 mention kidnapping.
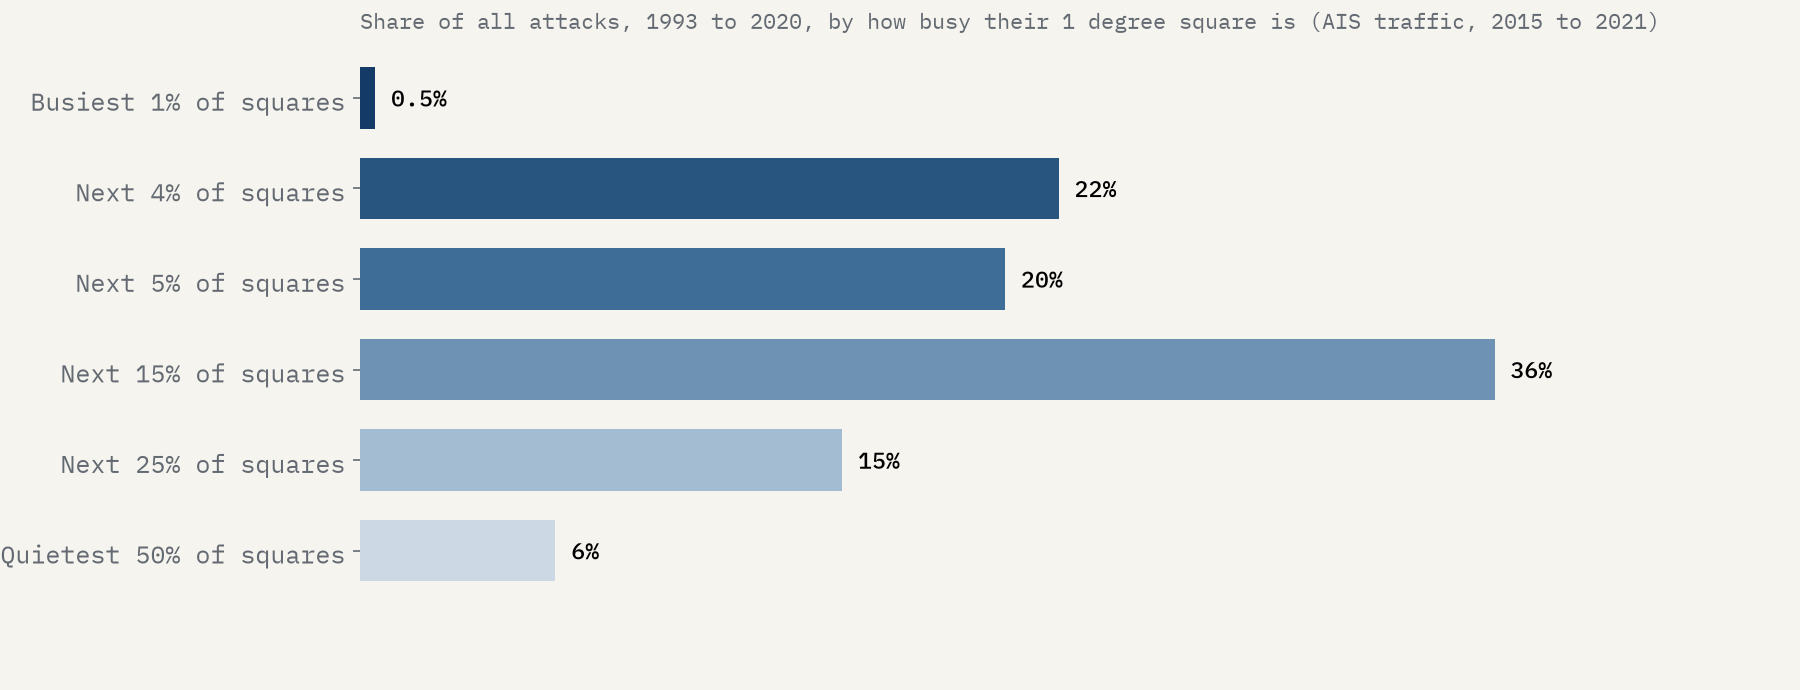
Most piracy, though, is not dramatic. 64% of all the attacks were boardings, typically a few robbers climbing aboard a ship at anchor to steal whatever they can carry, and only 7% were hijackings. And it happens where the ships are: 79% of attacks were in the busiest quarter of the sea by ship traffic. Busy is not enough, though: the very busiest waters, in the North Sea and the English Channel, saw almost none.
And today?
The database stops in 2020, so for the last few years I used the IMB’s own headline counts. They are not mapped points, but they tell a clear story. Worldwide the IMB counted 115 incidents in 2022, the lowest in three decades, and 137 in 2025. Of those, 80 were in the Singapore Strait, 58% of the world total and about as many as its previous peak in 2015, in one of the busiest waterways on earth. In 2026 the strait went quiet (13 incidents in January to September), but Somali pirates came back: all 8 hijackings reported worldwide in those nine months were theirs.
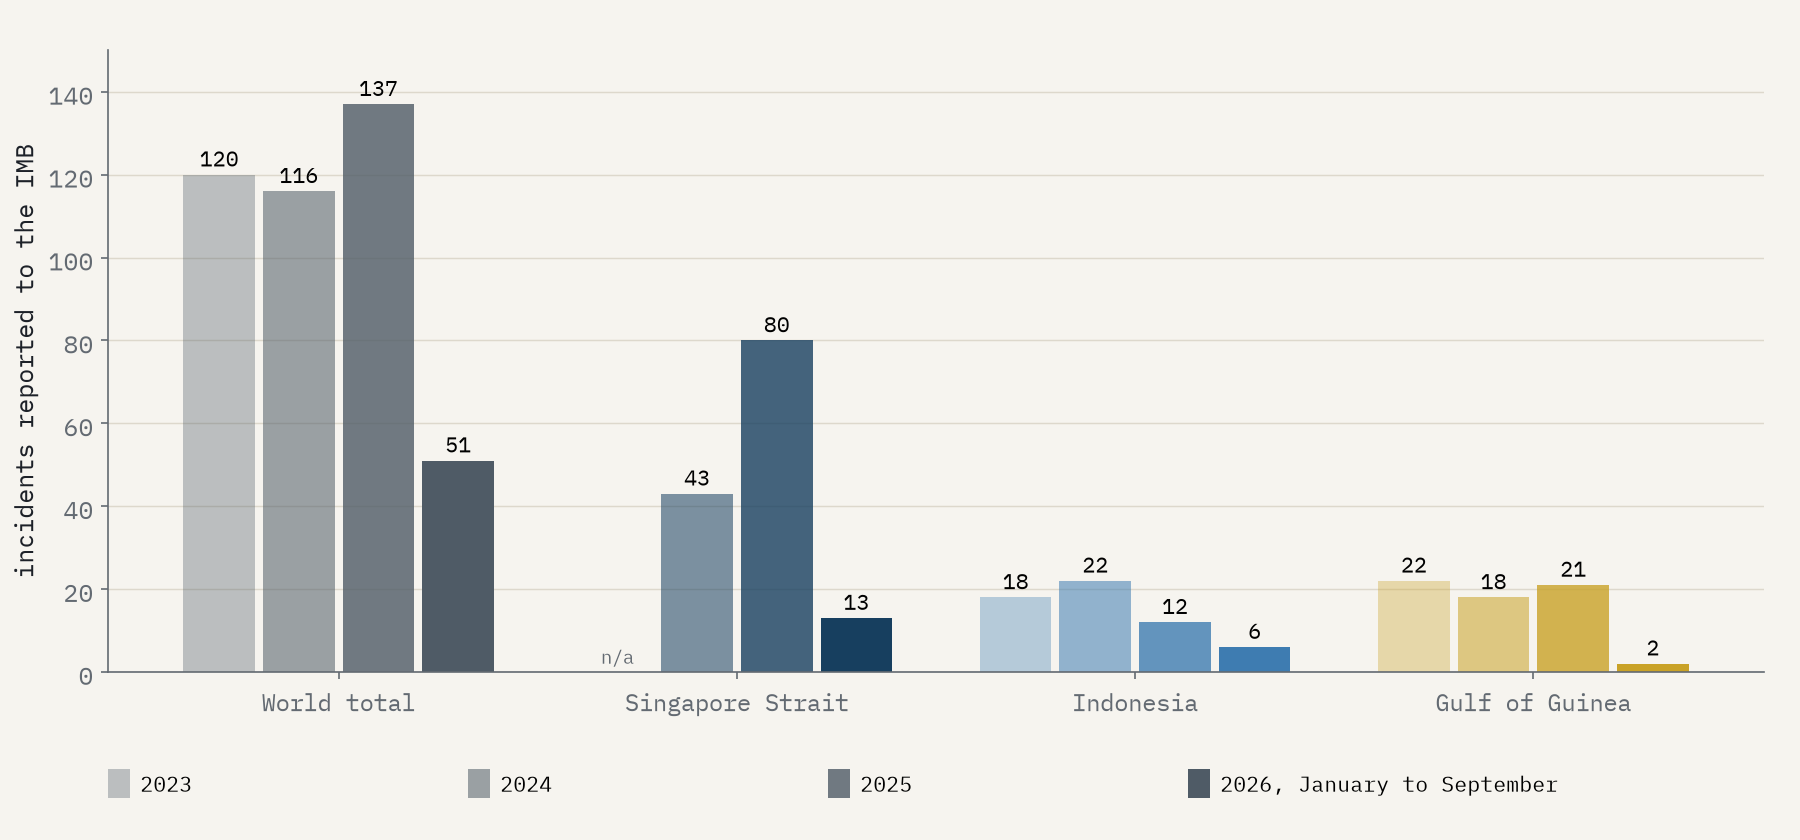
So the map keeps moving. The Gulf of Guinea, which led the world five years ago, had just 2 incidents in the first nine months of 2026. The Singapore Strait rose and fell within two years. And the Somali hijackers, who seemed finished a decade ago, are back at sea.
How I did this
The attacks come from the Crime at Sea database (Benden, Feng, Howell and Dalla Riva, 2021), built from IMB and NGA reports through the MAPPING piracy data of Brandon Prins (1993 to 2014) and IMB reports (2015 to 2020). I sorted every attack into a region using simple geography (a box for the Singapore Strait, a polygon for the Strait of Malacca, coasts and sea areas for the rest), grouped the years into six eras, and counted attacks in 1 degree squares and hexagons. Ship traffic comes from the World Bank and IMF’s map of AIS signals, 2015 to 2021, summed to 1 degree squares. The 2021 to 2026 numbers are the IMB’s headline counts from its reports and press releases. All of these are reported attacks: many, especially on small boats, never get reported at all.
Notes and sources
- Benden, P., Feng, A., Howell, C. and Dalla Riva, G. V. (2021) Crime at Sea: A Global Database of Maritime Pirate Attacks (1993 to 2020), Journal of Open Humanities Data 7: 19. Data on GitHub (CC BY 4.0), from IMB and NGA ASAM reports.
- ICC International Maritime Bureau, Piracy and Armed Robbery Against Ships reports and press releases, 2021 to 2026, including the October 2026 release. Headline counts only.
- World Bank and IMF, Global Shipping Traffic Density (CC BY 4.0).
- Natural Earth outlines (public domain). Base map tiles on the interactive page © Esri.
- I wrote the text, with drafting and editing assistance from Claude (Anthropic), which also helped prepare the analysis code. I reviewed and checked all text and results.

