
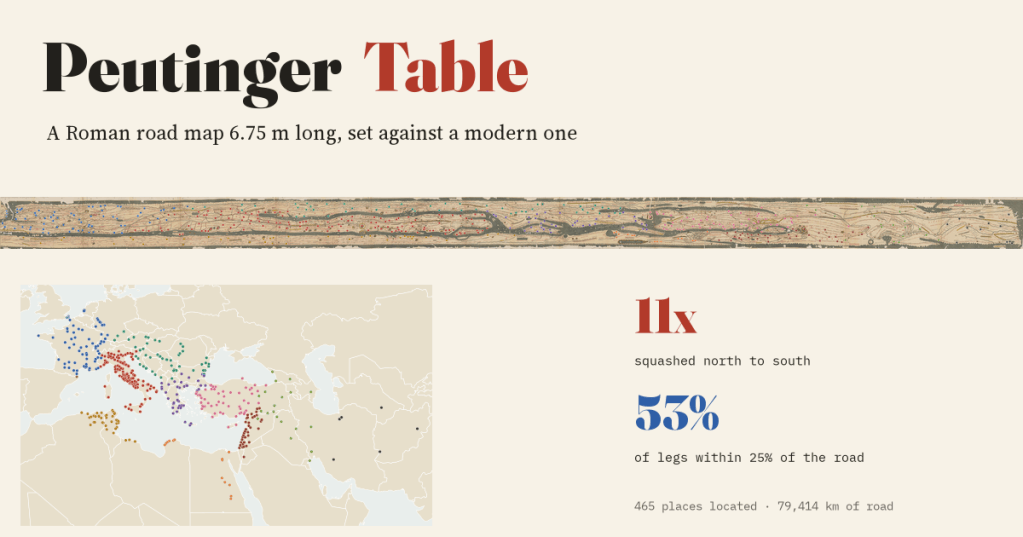
The Peutinger Table is a Roman road map squeezed onto a strip of parchment 6.8 metres long and 34 centimetres high. I found 465 of its places by eye, set it beside a modern map and measured its roads. The shape is hopeless. The numbers are not.
In the Austrian National Library in Vienna lies a medieval copy of a Roman map: eleven sheets of parchment glued into one long strip. On it the whole Roman world, and some of the world beyond, from the mouth of the Rhine to the tip of India, is pressed flat like a flower in a book. The seas are thin grey-green ribbons. Italy lies on its side. Yet the map is covered in roads, red lines with a little kink at every stopping place, and beside each stretch of road is a number: how far to the next station.
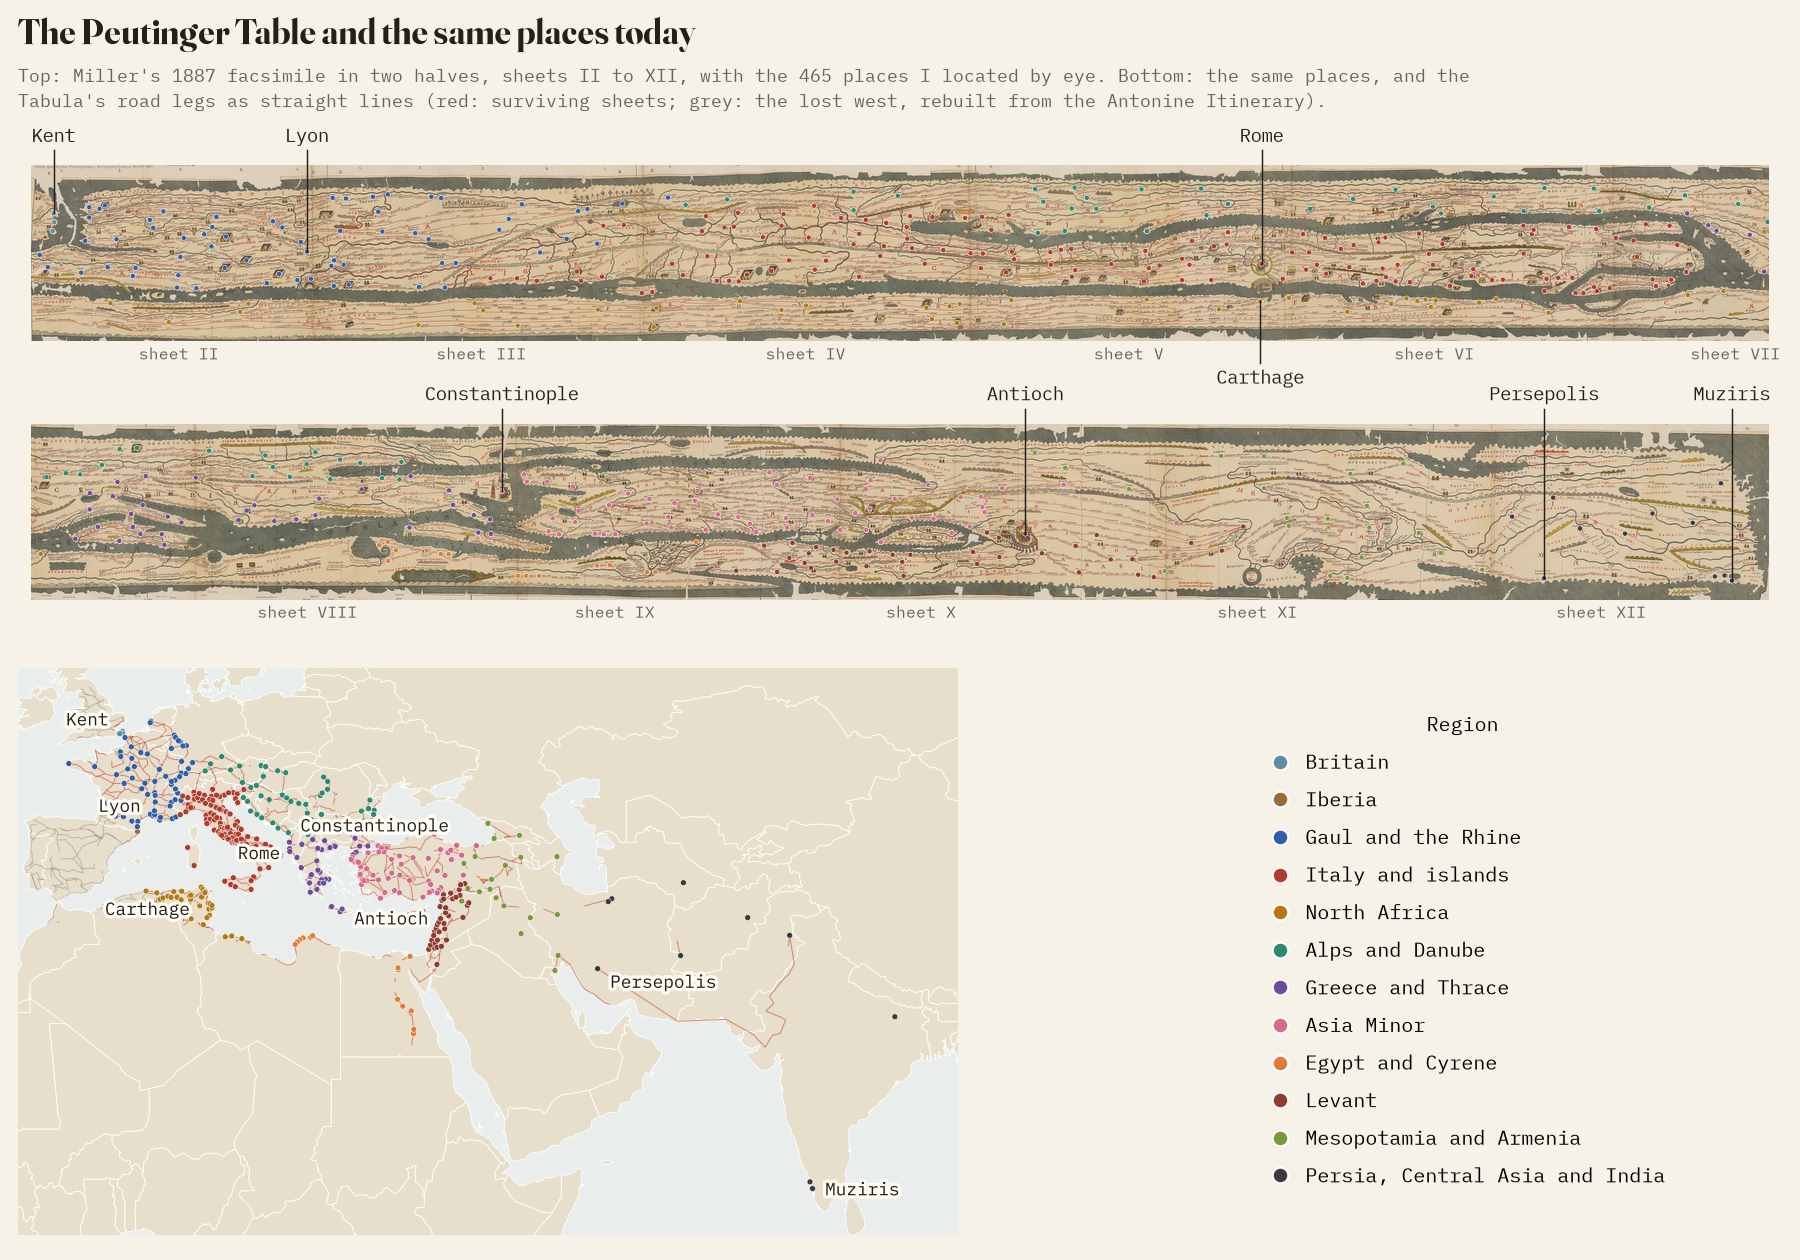
The OmnesViae project by René Voorburg, built on Richard Talbert’s edition of the map, turns it into a dataset of 2,762 stations and 2,971 road legs on the surviving sheets. I used that, found 465 of the places on Konrad Miller’s 1887 facsimile, and put the scroll and a modern map side by side.
A world pressed flat
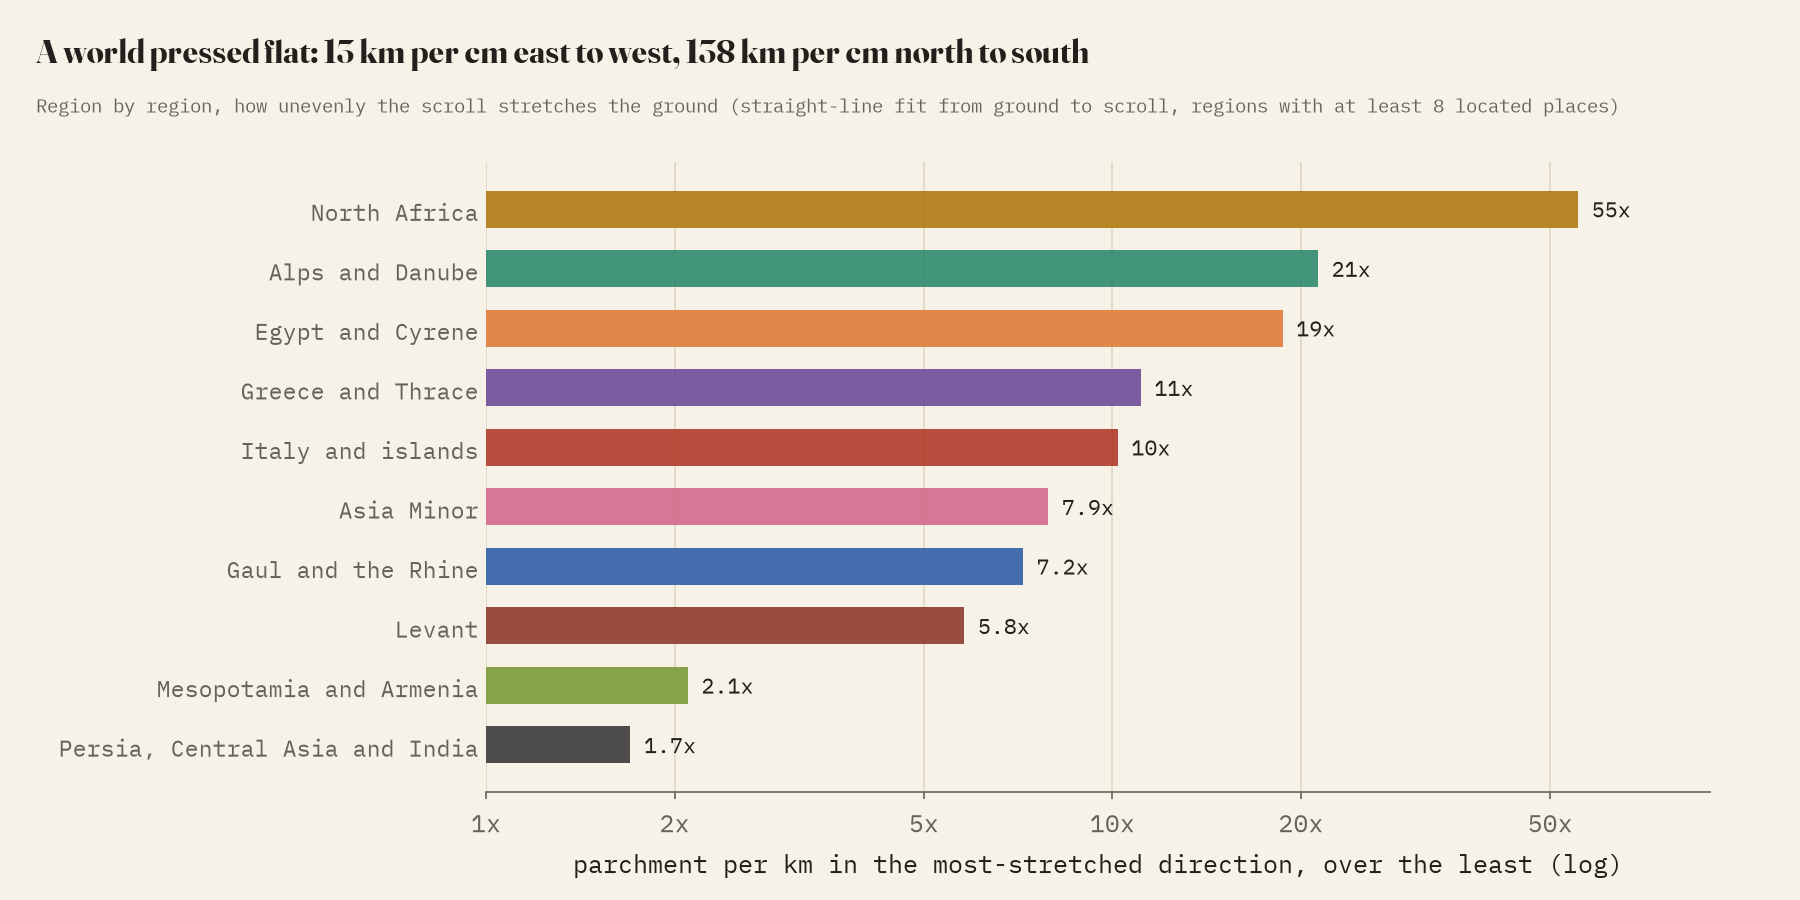
The places I located span about 8,526 km east to west and 4,676 km north to south. On the parchment, one centimetre covers about 12.6 km east to west but 137.5 km north to south: the world is squashed about 11 times more in one direction than the other. Some regions suffer more than others. North Africa becomes a ribbon of coast 55 times more stretched one way than the other; Italy, laid along the strip from north-west to south-east, about 10 times.
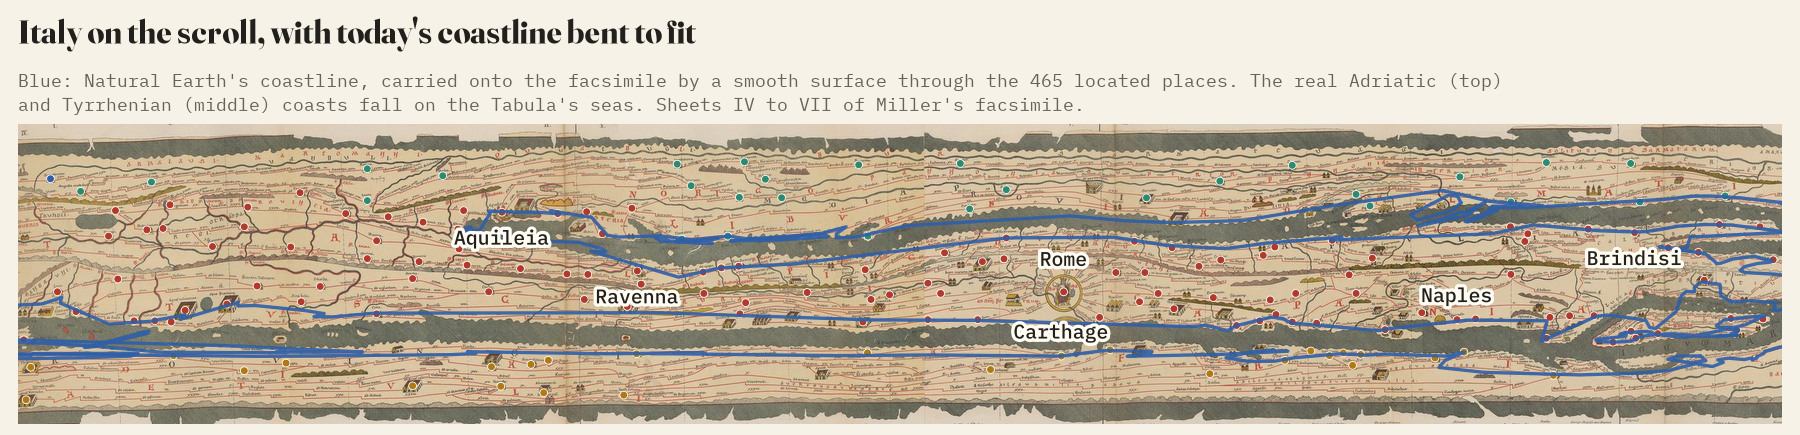
To see this I fitted a smooth surface through the located places and used it to bend today’s coastline onto the scroll. The real coasts of Italy land almost exactly on the Tabula’s seas.
But the numbers are right
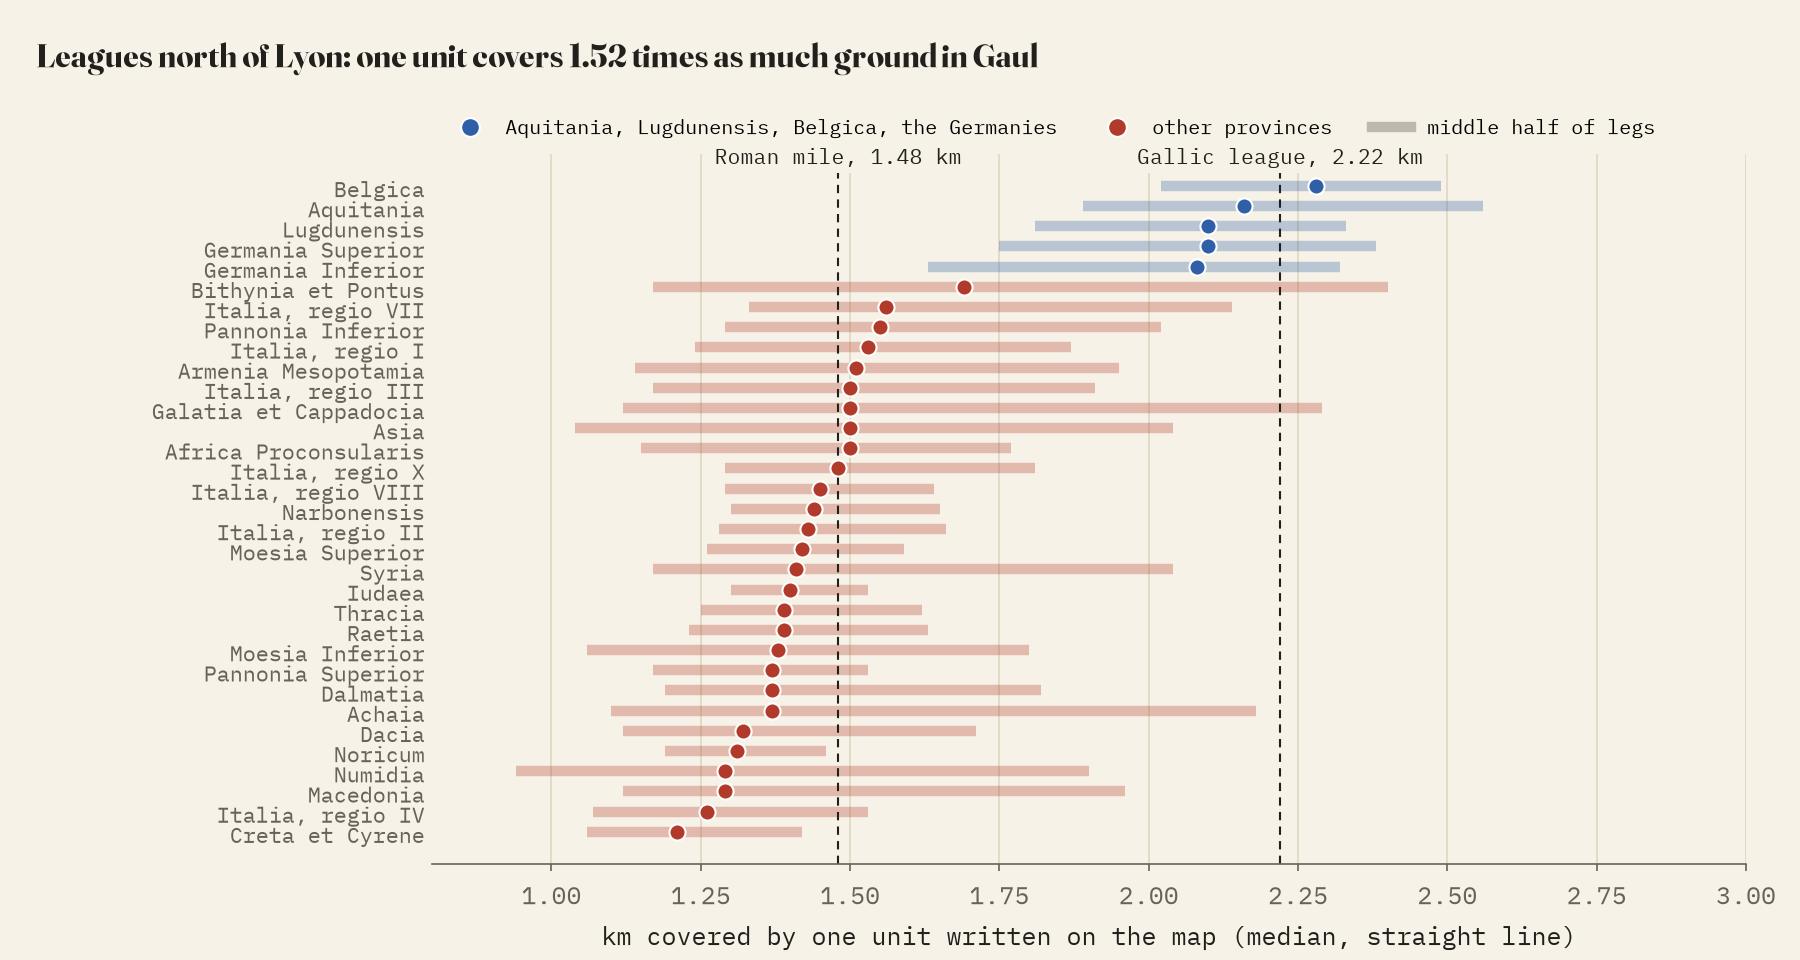
The figures on the map carry no unit. Scholars read them as Roman miles, except in Gaul, where they are Gallic leagues of one and a half miles; beside Lyon the map itself says “usque hic legas”, leagues up to here. The measurements agree. Outside Gaul, one unit covers a median 1.41 km as the crow flies. In Gaul north of Lyon and the Rhineland it covers 2.15 km, 1.52 times as much. Read as miles, Gaul’s figures would be far too short; read as leagues, they are right to within a few per cent.
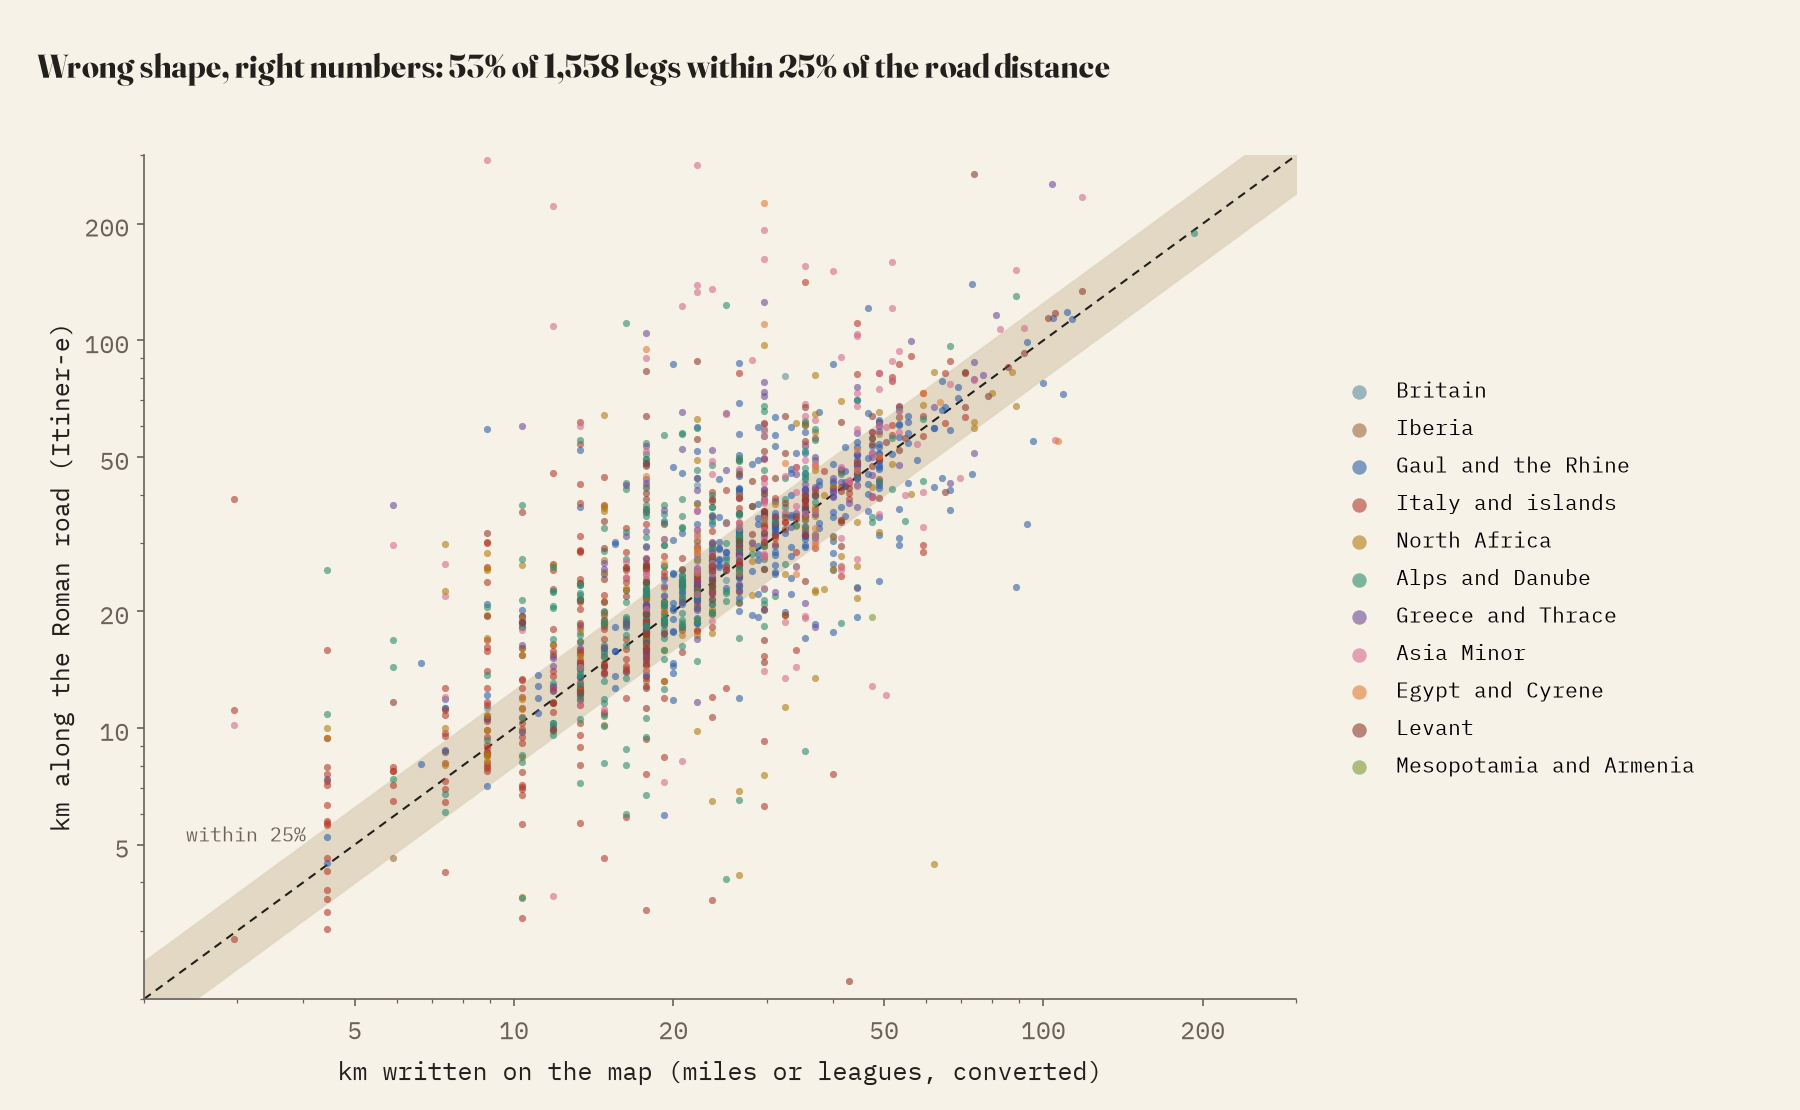
Converted that way, I compared every leg I could with the road network of the Itiner-e atlas of Roman roads. For 1,558 legs, the median road is 10% longer than the figure on the map and the median straight line 4% shorter, just where a road distance should sit. 53% agree with the road to within 25%. Over long journeys the errors cancel: by the Tabula’s own figures it is 1,120 km from Rome to Vienna, against 1,038 km along the mapped roads, and 1,487 to Cologne, against 1,444.
Who gets the parchment, and where is Rome?
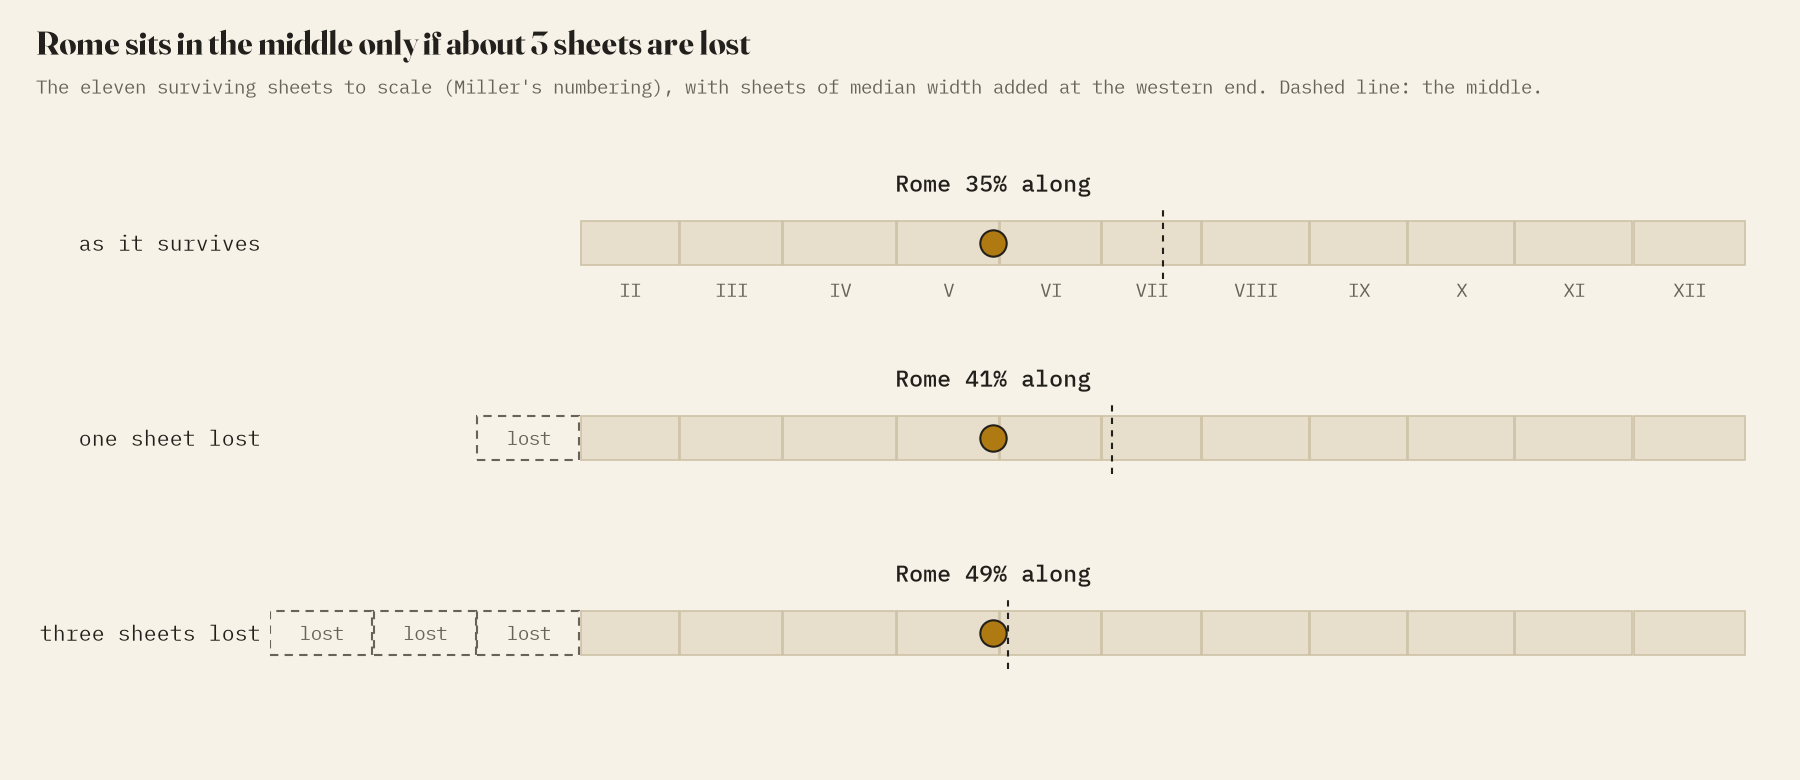
Italy takes 17.3% of the surviving scroll for 6.6% of the empire’s land, 2.6 times its share. Mesopotamia, Greece and the Levant are also generous; Gaul, North Africa and Asia Minor get about their fair share. Rome itself, enthroned in a gold circle, is not in the middle of what survives: it sits 35% of the way along. The first sheet is lost, but one lost sheet is not enough to centre it. It would take about 3.
79,000 kilometres of road
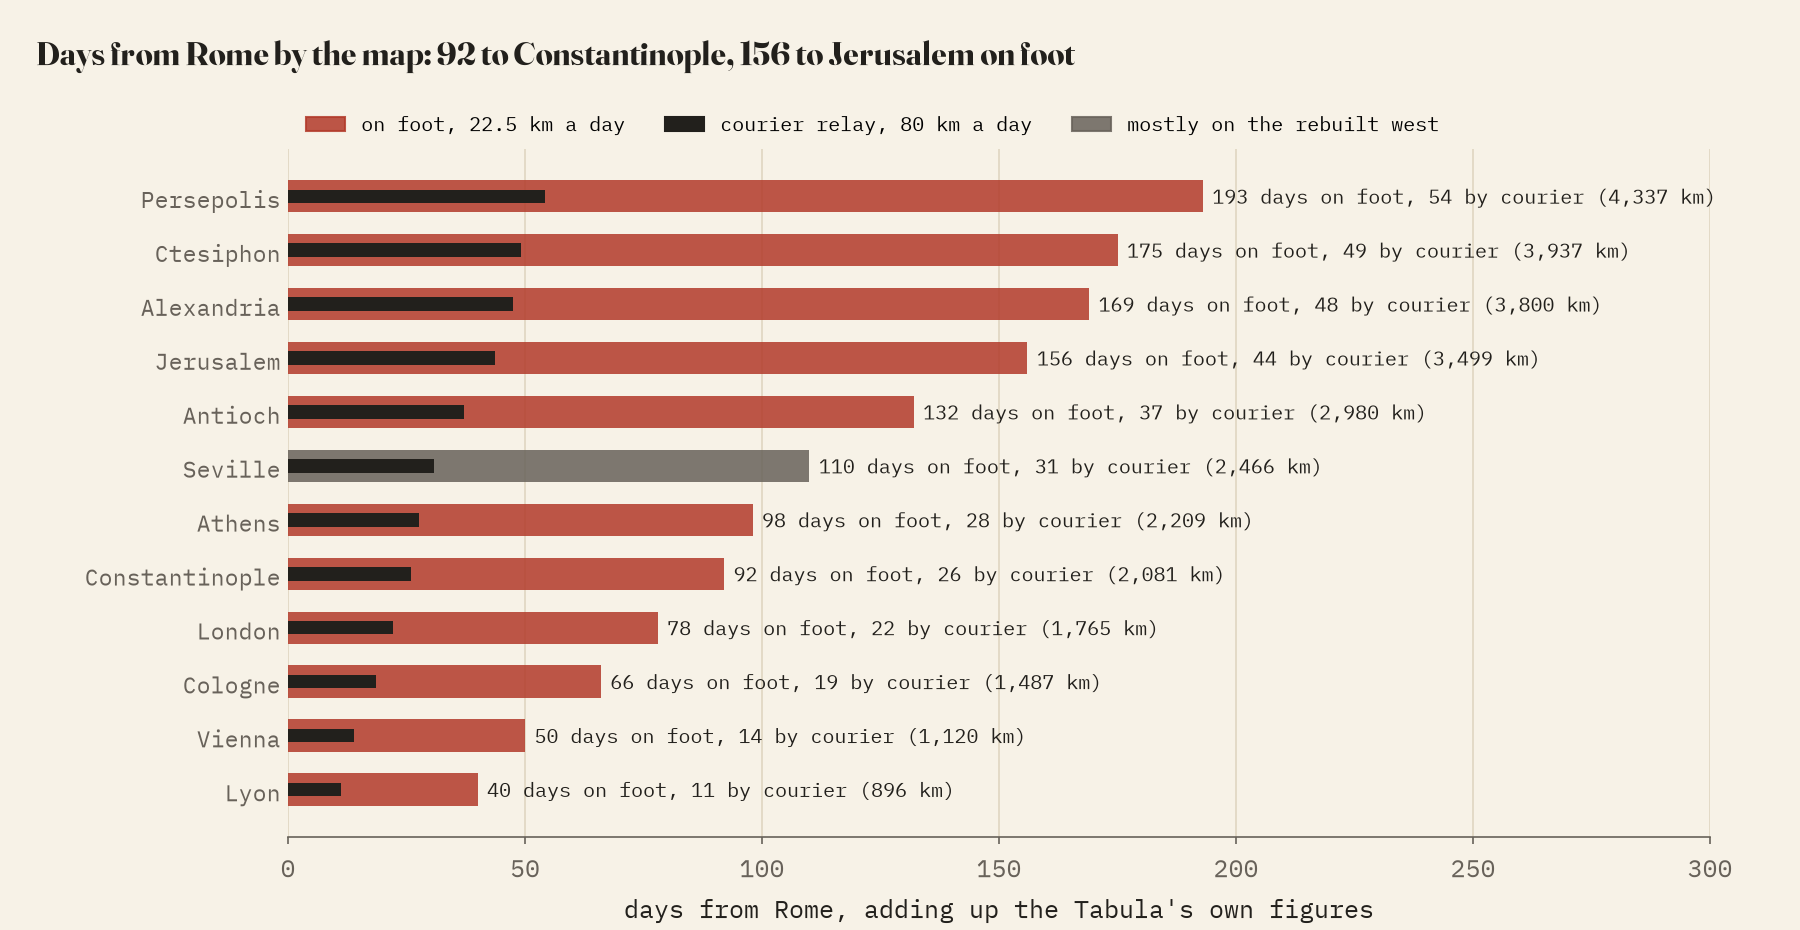
Adding up every figure on the surviving sheets gives about 79,414 km of road. Walking it, at the 20 to 25 km a day a Roman traveller managed on foot, would take 3,530 days, close to 10 years. By the map’s own figures, Rome to Constantinople is 92 days on foot and Rome to Jerusalem 156. The Tabula draws no sea routes, so Carthage, a few days away by ship, is 6,561 km by its roads, the long way round the whole eastern Mediterranean.
How I did this
The stations, their identifications and coordinates, and the legs with their figures are from OmnesViae, after Talbert’s edition; I used them as given. The 465 positions on the scroll are my own, read off Miller’s facsimile, so they favour legible, well-known places. Units are assigned by province. Road distances follow the Itiner-e network, which includes every bend of the road, so they lean long. The lost western sheet, which OmnesViae rebuilds from another Roman road book, the Antonine Itinerary, is kept separate throughout. The paper sets out the methods and their limits in full.
Notes and sources
- OmnesViae by René Voorburg, after R. J. A. Talbert, Rome’s World: the Peutinger Map Reconsidered (2010). Used as factual data, with credit.
- Konrad Miller’s 1887 facsimile, Wikimedia Commons, public domain.
- Itiner-e, the digital atlas of ancient roads (CC BY 4.0); Digital Atlas of the Roman Empire provinces (CC BY-SA); Pleiades (CC BY 3.0); Natural Earth; Wikipedia, Roman roads, for travel speeds (CC BY-SA 4.0).
- I wrote the text, with drafting and editing assistance from Claude (Anthropic), which also helped prepare the analysis code. I reviewed and checked all text and results.


