
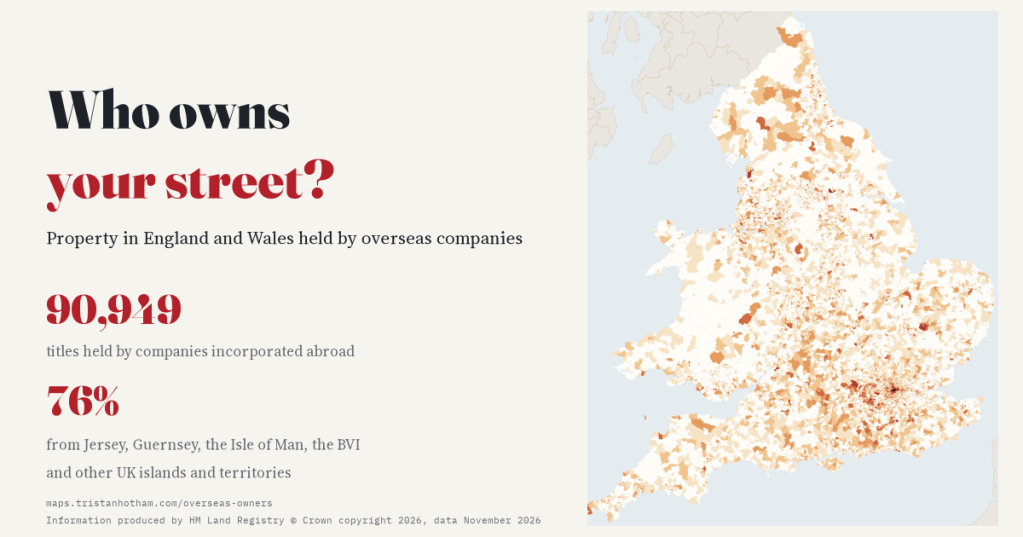
HM Land Registry keeps a list of every property title in England and Wales owned by a company registered abroad. There are 90,949 of them. I put every one I could on the map, small area by small area, to see where they are and what kind of street they are on. 76% belong to companies from Jersey, Guernsey, the Isle of Man, the British Virgin Islands and the UK’s other islands and territories.
Who owns your street? For most streets the answer is people: the families in the houses, the landlords who rent them out, the councils and housing associations. But some property in England and Wales is owned by companies incorporated in other countries. Since 2022 those companies have had to tell Companies House who really stands behind them. HM Land Registry has published the list of their properties for years, and it has become a favourite source for journalists and economists asking about money from abroad.
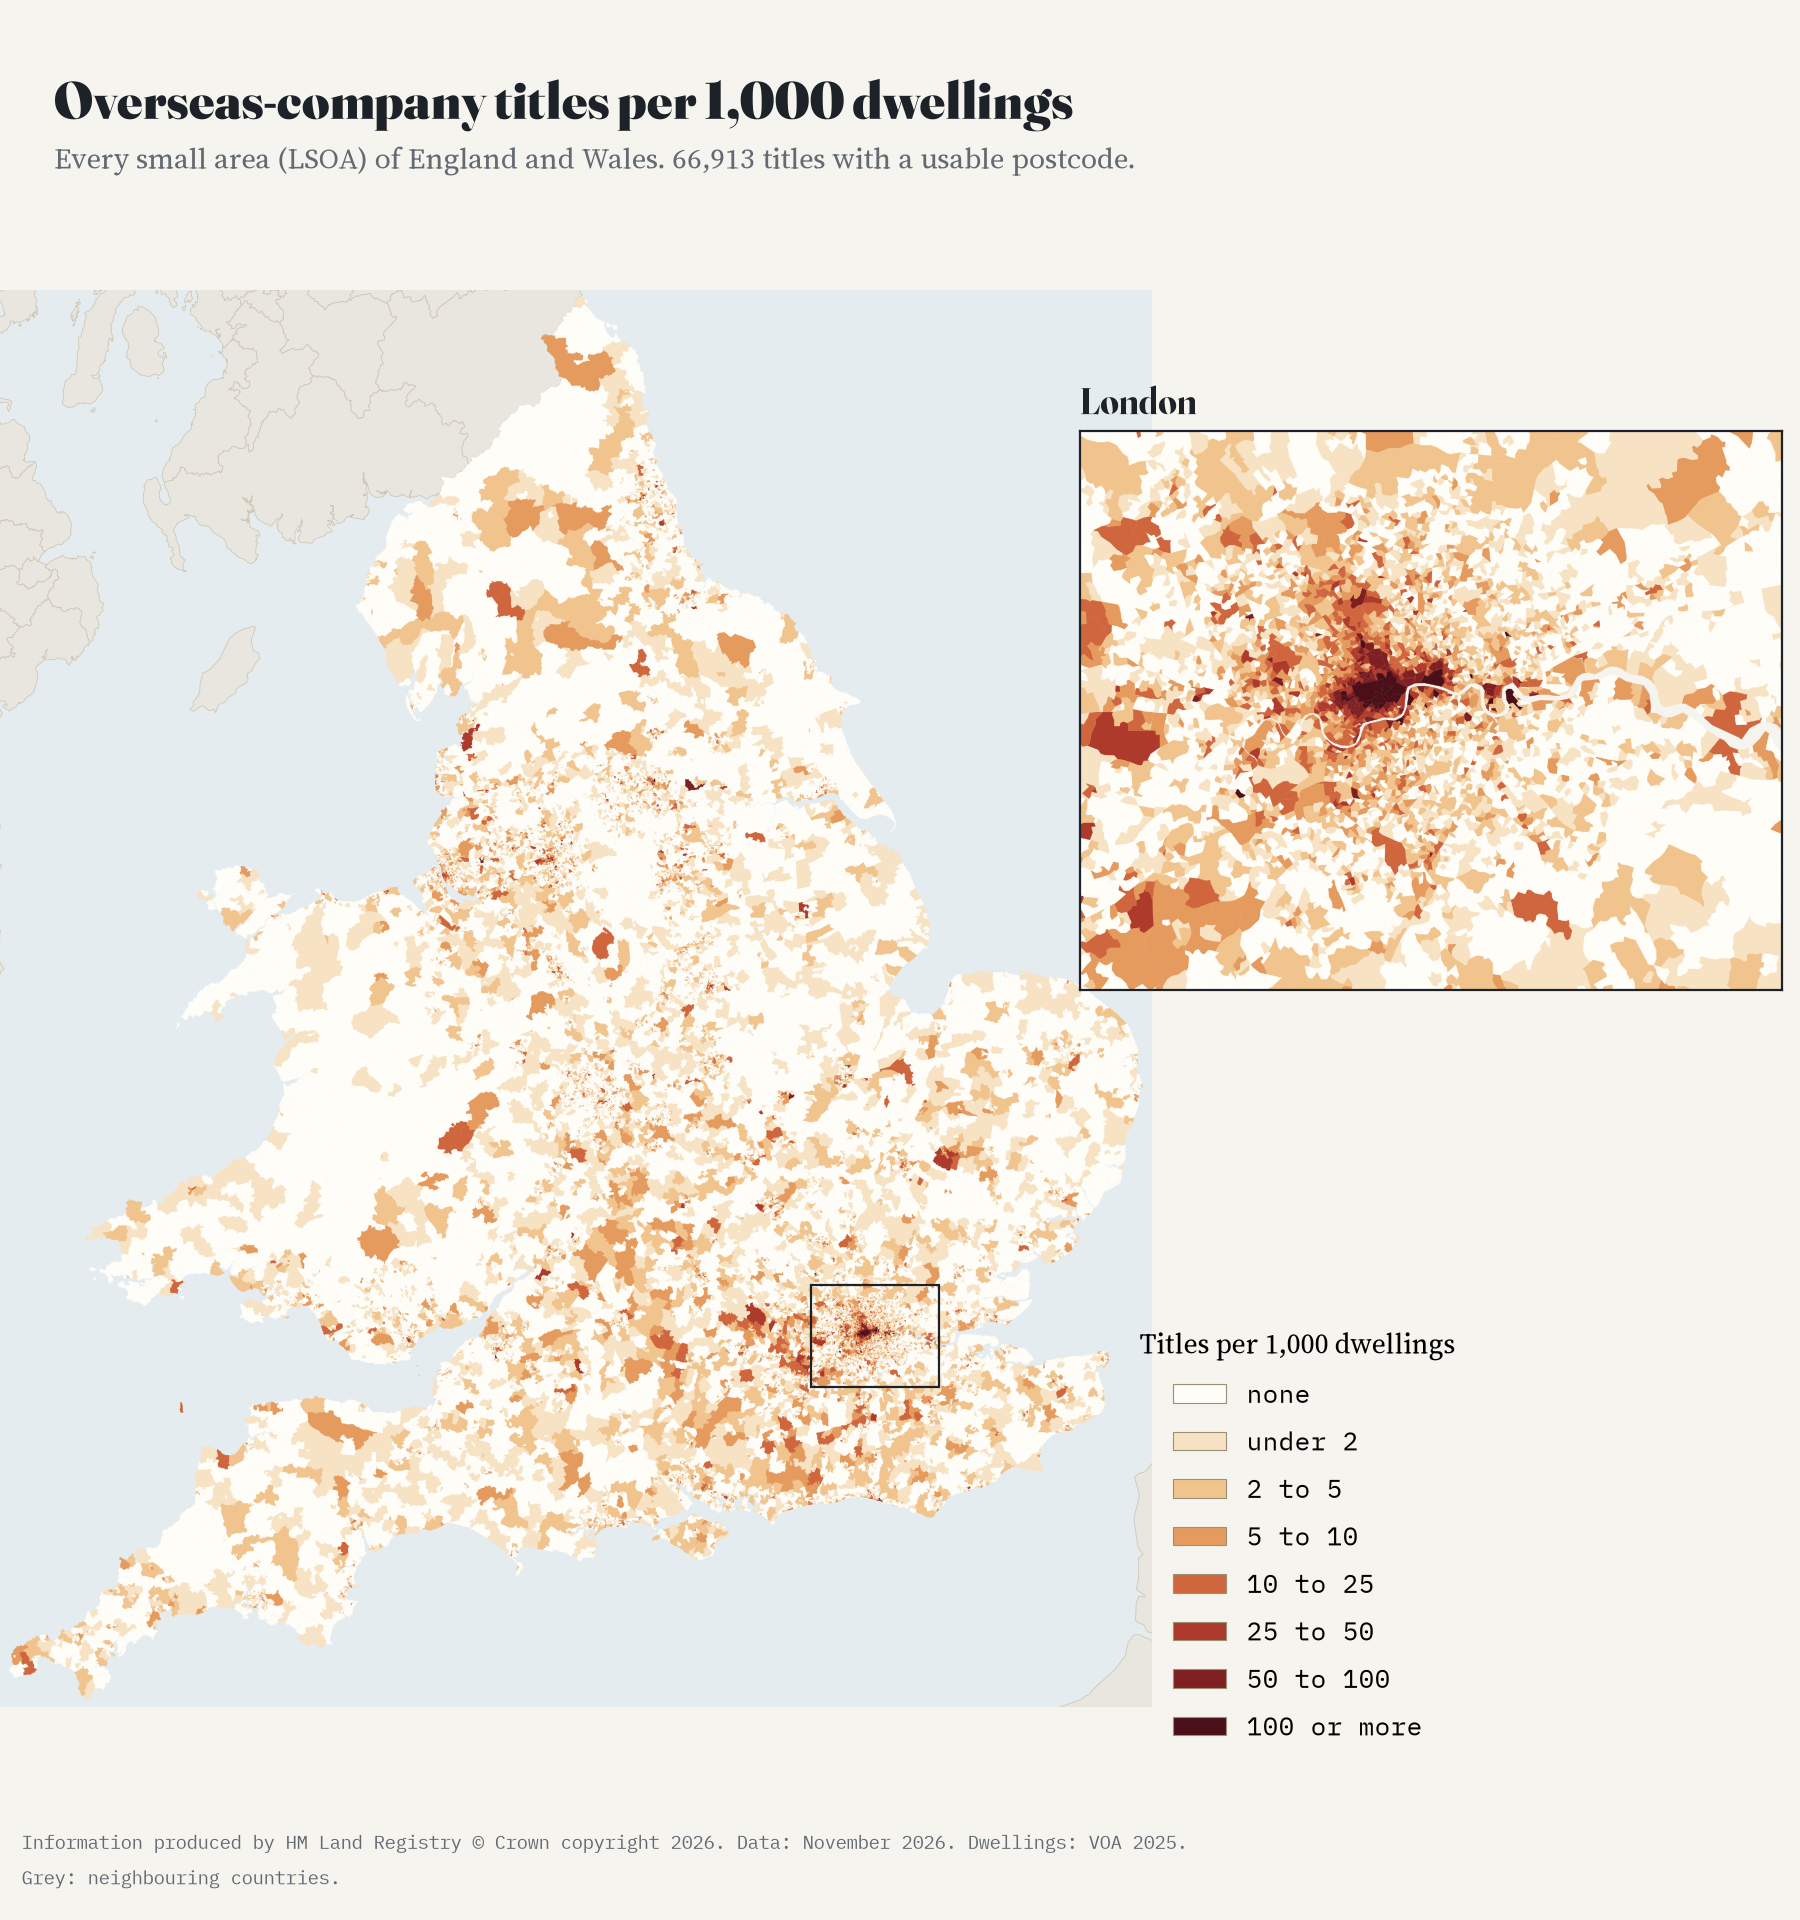
Most of that work looks at central London or at a single headline total. I wanted the plain map. Where, across the whole of England and Wales, are these titles? How bunched up are they? And once you look inside a single town or borough, what kind of neighbourhood are they in?
One thing to know first. A title is a legal registration, not a home. It can be one flat, a house, a shop, an office block or a field. So everything here is counted in titles, and I compare them with the number of homes in each area only to make big and small places comparable.
Central London, and then almost everywhere
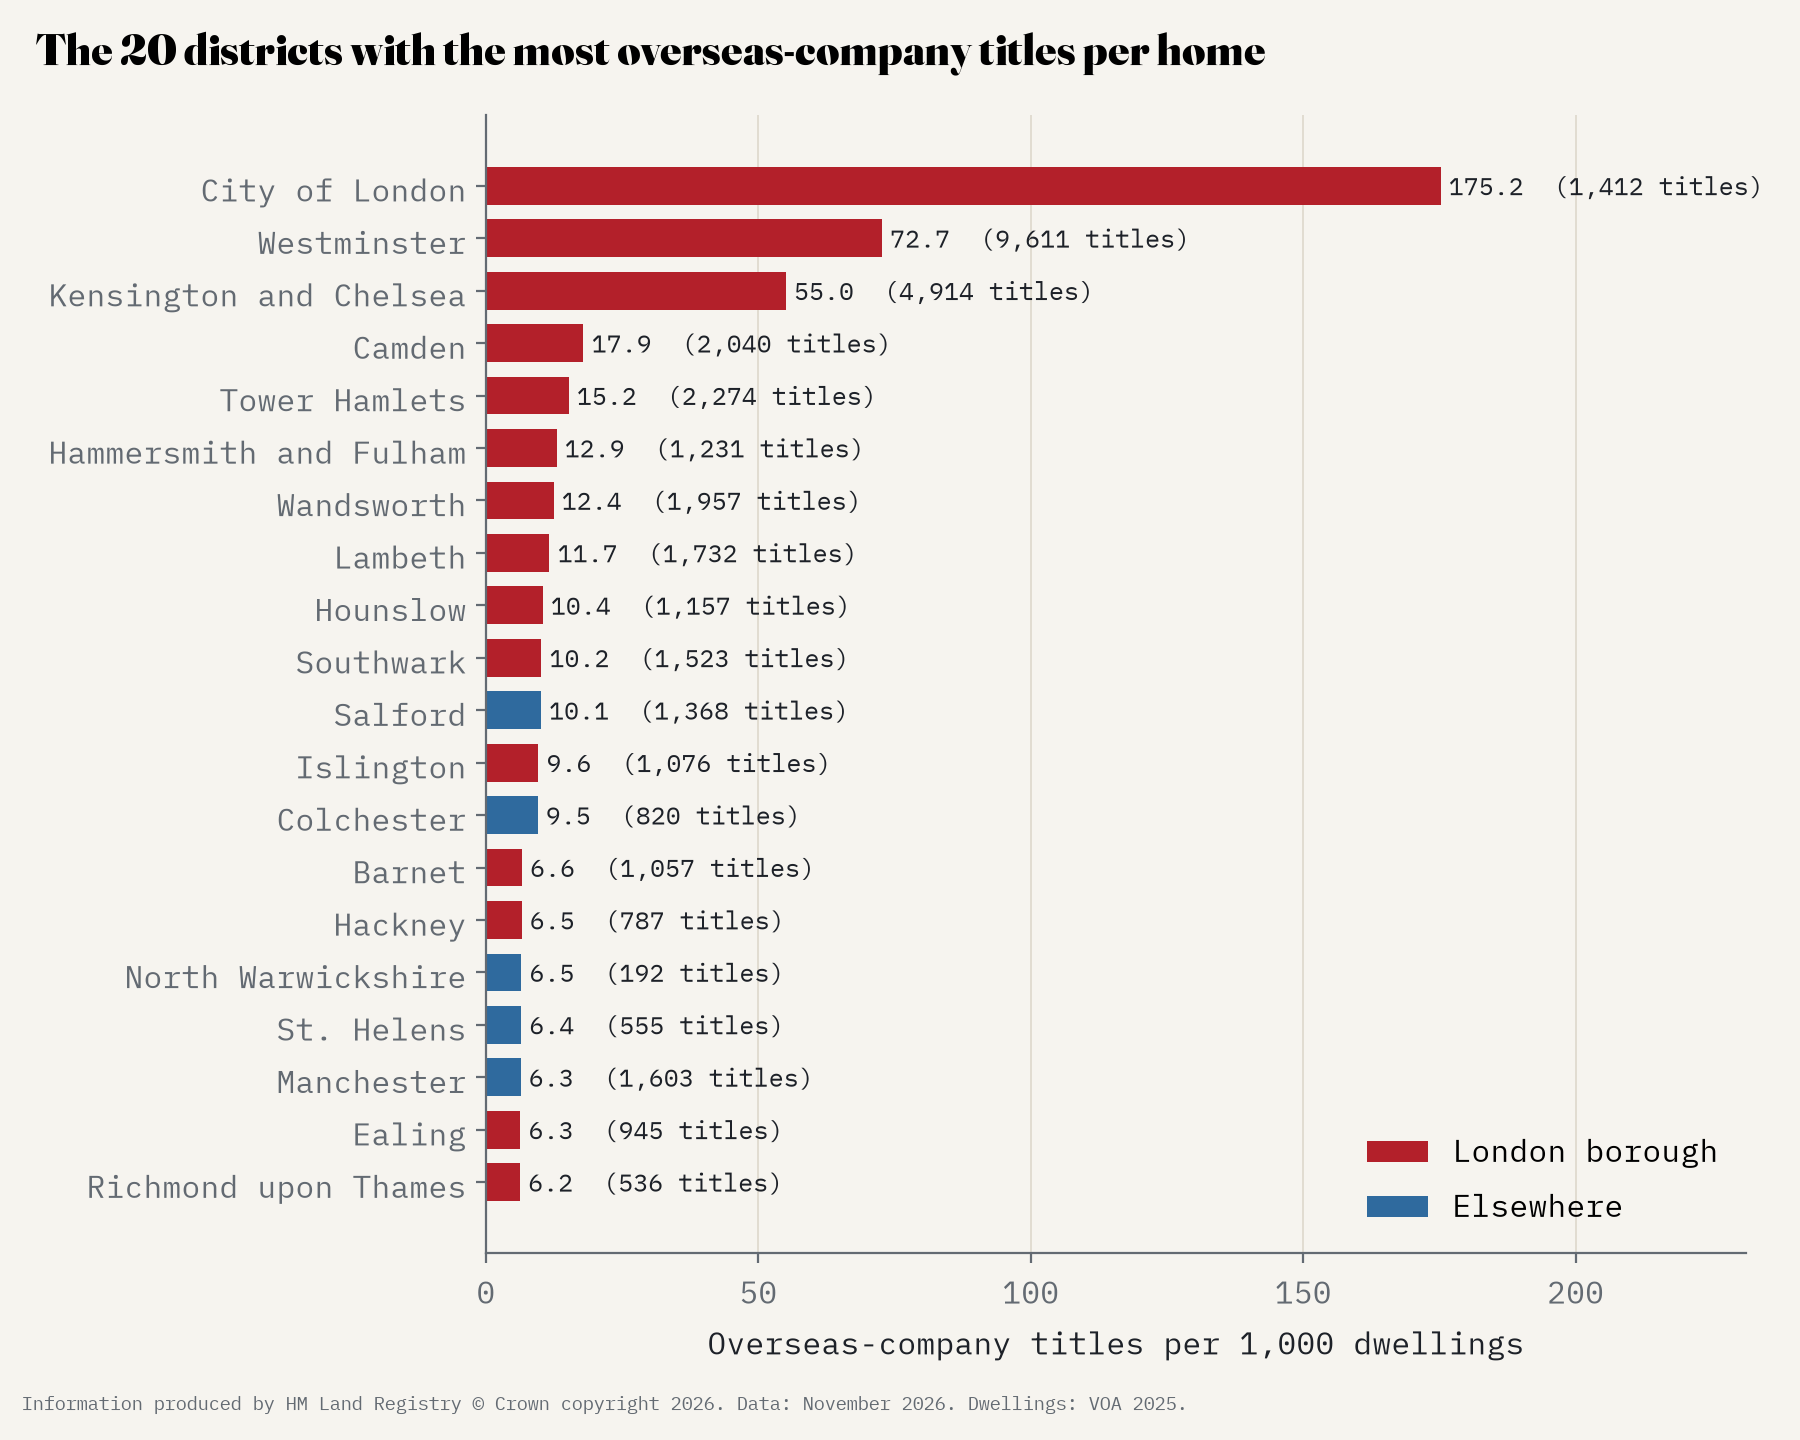
Across England and Wales there are 3.3 overseas company titles for every 1,000 homes. In Westminster there are 73. In Kensington and Chelsea, 55. Those two boroughs hold 14,525 titles between them, 16% of the whole list, with less than 1% of the homes. The City of London has the highest rate of all, 175 per 1,000 homes, but it has very few homes and a lot of offices.
Outside London the highest rate is in Salford, with 10.1 per 1,000 homes, followed by Colchester, North Warwickshire, St Helens, Manchester and Runnymede. London as a whole has 43% of the titles and 14% of the homes. That still leaves 57% of titles outside the capital, and every one of the 318 districts in England and Wales has at least some.
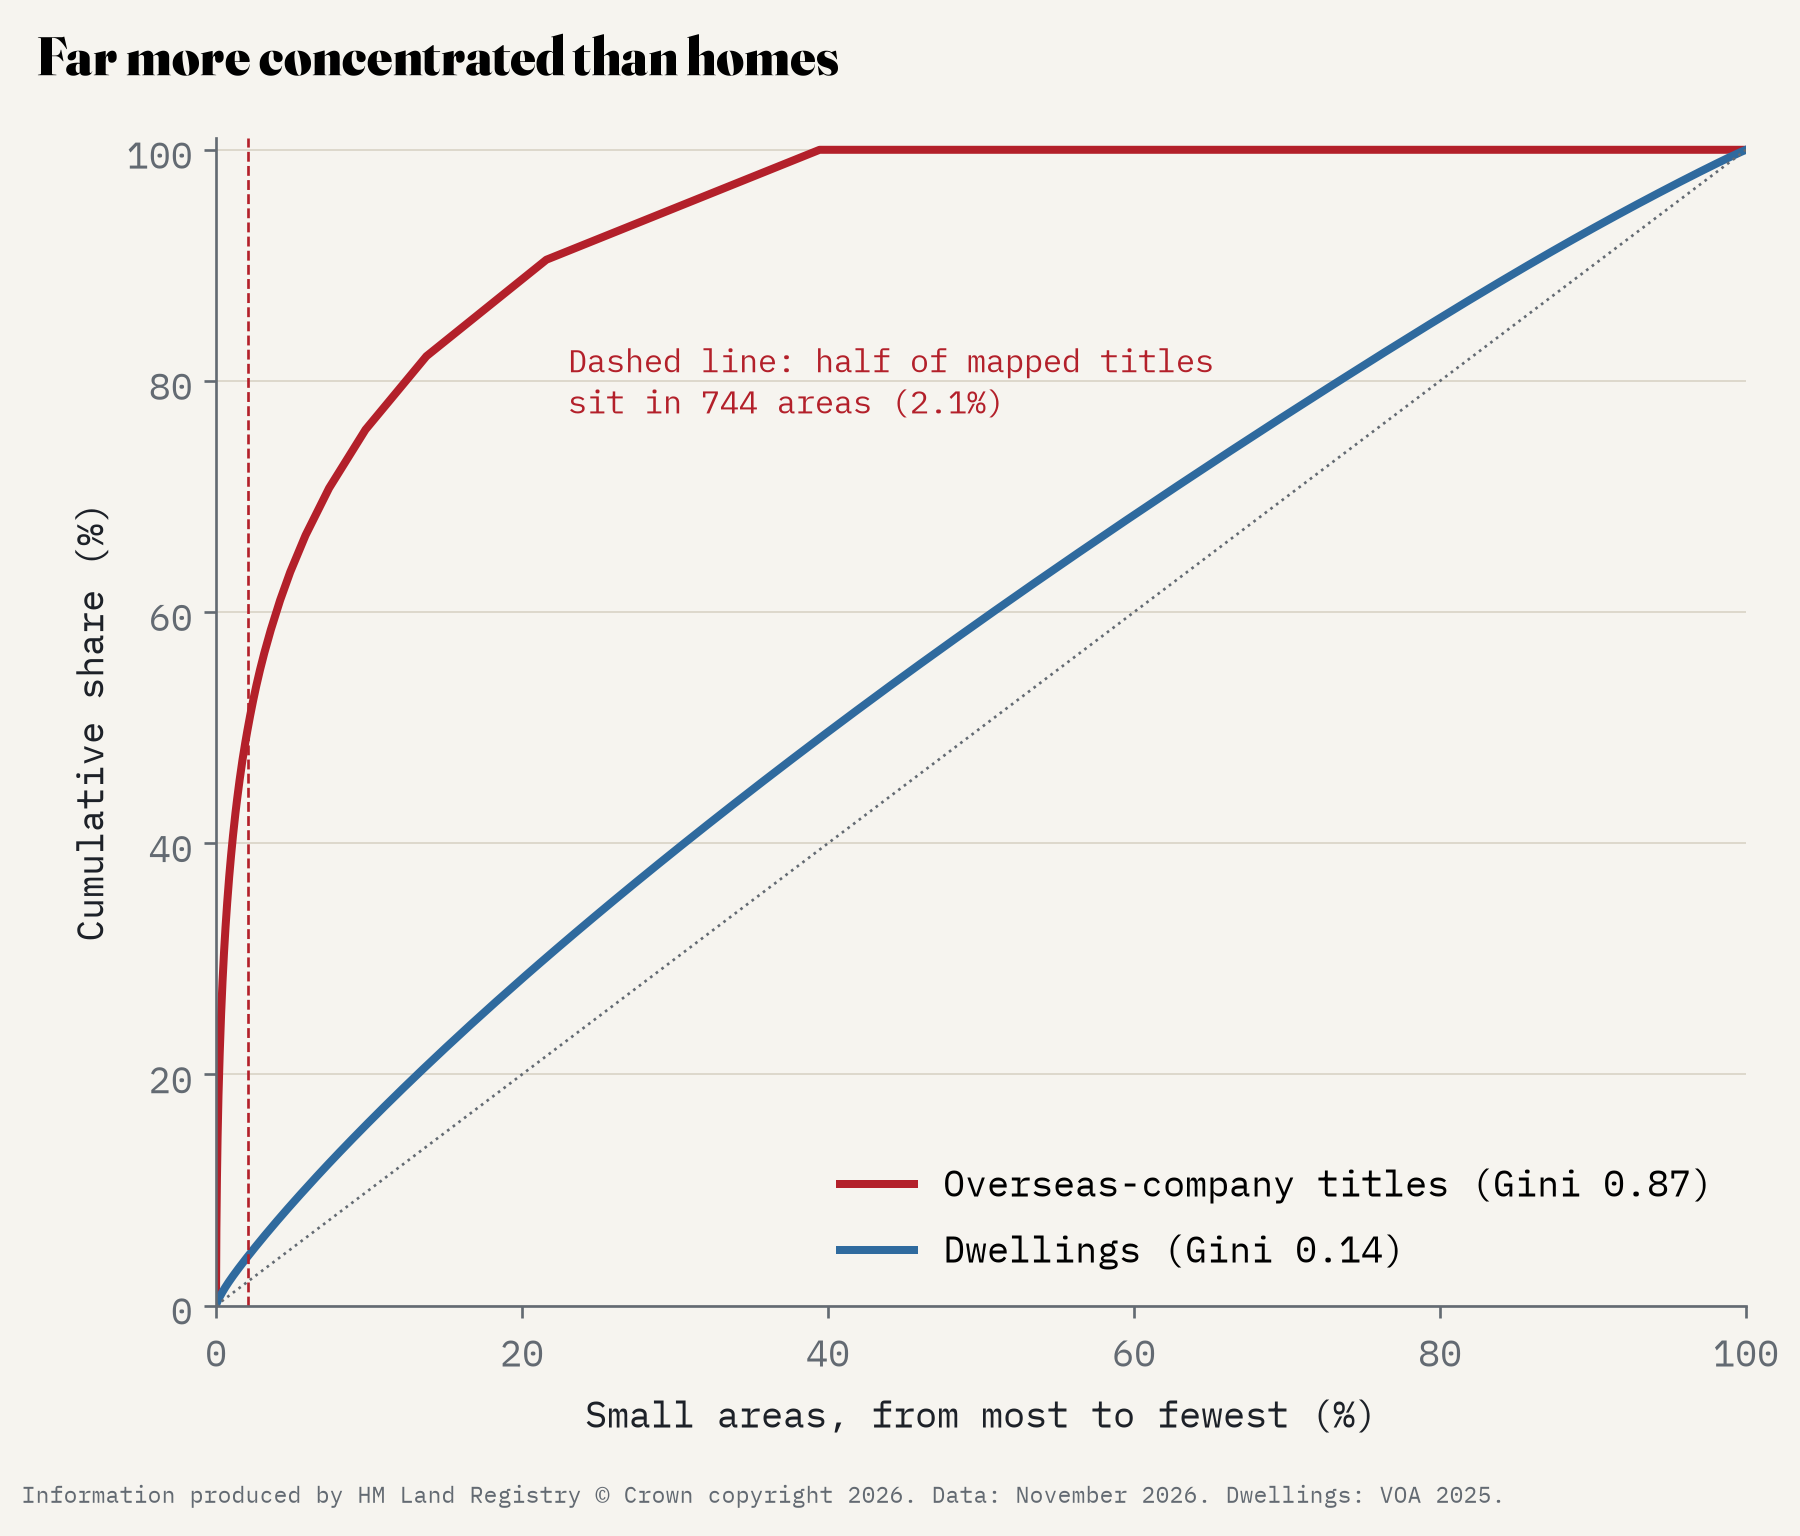
Zoom in further and it gets more extreme. Half of the titles that can be placed in a small area sit in just 744 small areas, 2.1% of the total. 61% of small areas have none at all. Some of the very highest are single buildings sold as many separate units: in 4 of the 10 highest small areas, one company holds more than half the titles.
Four places hold seven in ten
The companies come from 131 named places, from Singapore to Panama. But four places hold 71% of the titles, and all four have a special tie to the UK. Jersey has 24,372 titles, the British Virgin Islands 18,665, Guernsey 12,216 and the Isle of Man 9,632. Count all the Crown Dependencies and British Overseas Territories and it comes to 76%. The share is lower in London (70%) than anywhere else, and highest in Wales (86%).
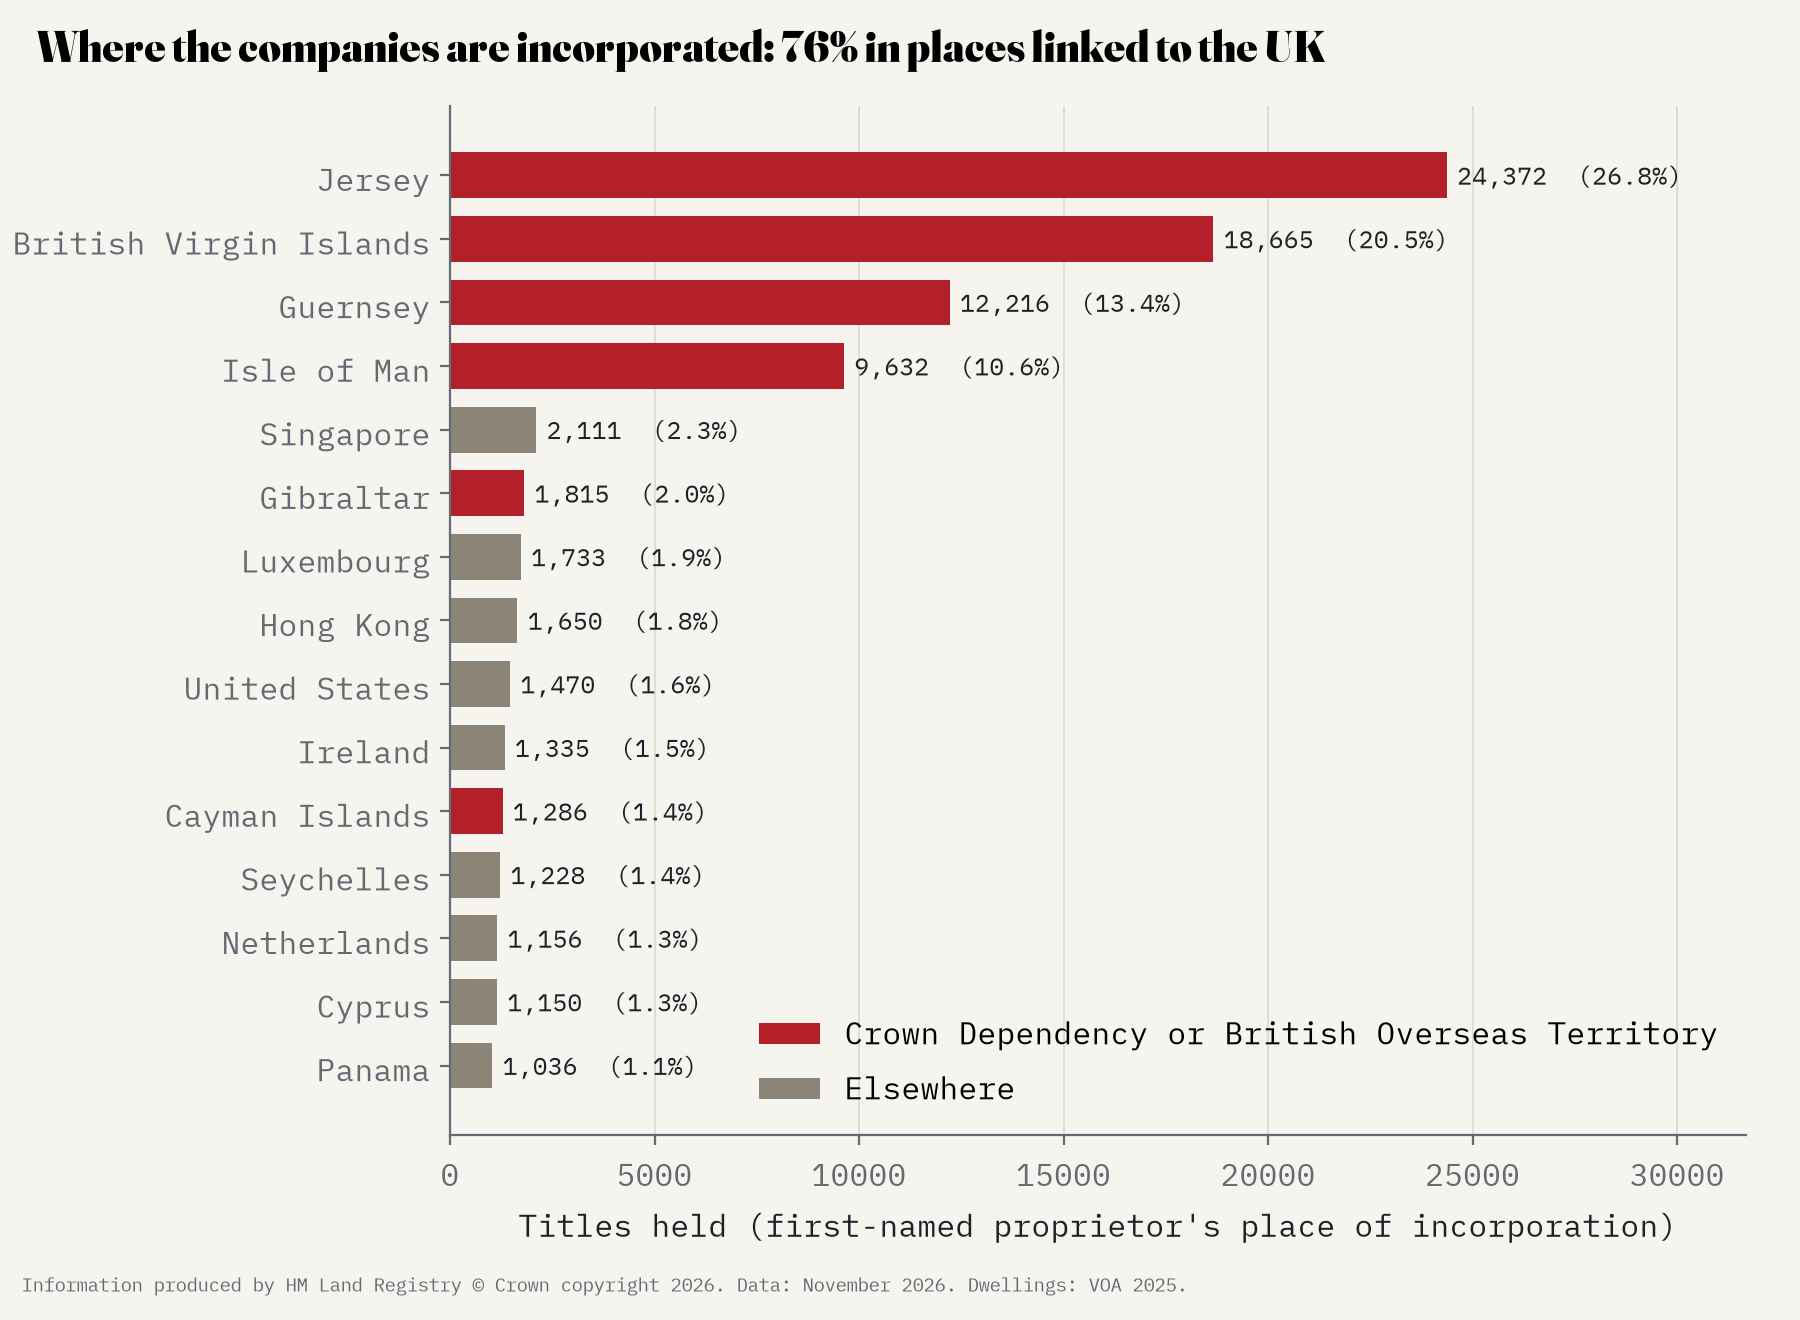
Owning property through a company registered abroad is legal, and companies do it for many different reasons. This list cannot tell those reasons apart, and the place a company is registered says nothing about how it behaves.
Half of the mapped titles sit in about one in fifty small areas. Yet 39% of small areas have at least one.
Dearer, flatter, newer
The big differences between places are easy to see. The more interesting question is what happens inside a single district. So I compared small areas within the same district, using what the Council Tax list says about their homes. Ten more percentage points of homes in the top Council Tax bands go with 29% more overseas company titles per home. Ten more points of flats go with 30% more. Ten more points of homes built since 2009 go with 10% more.
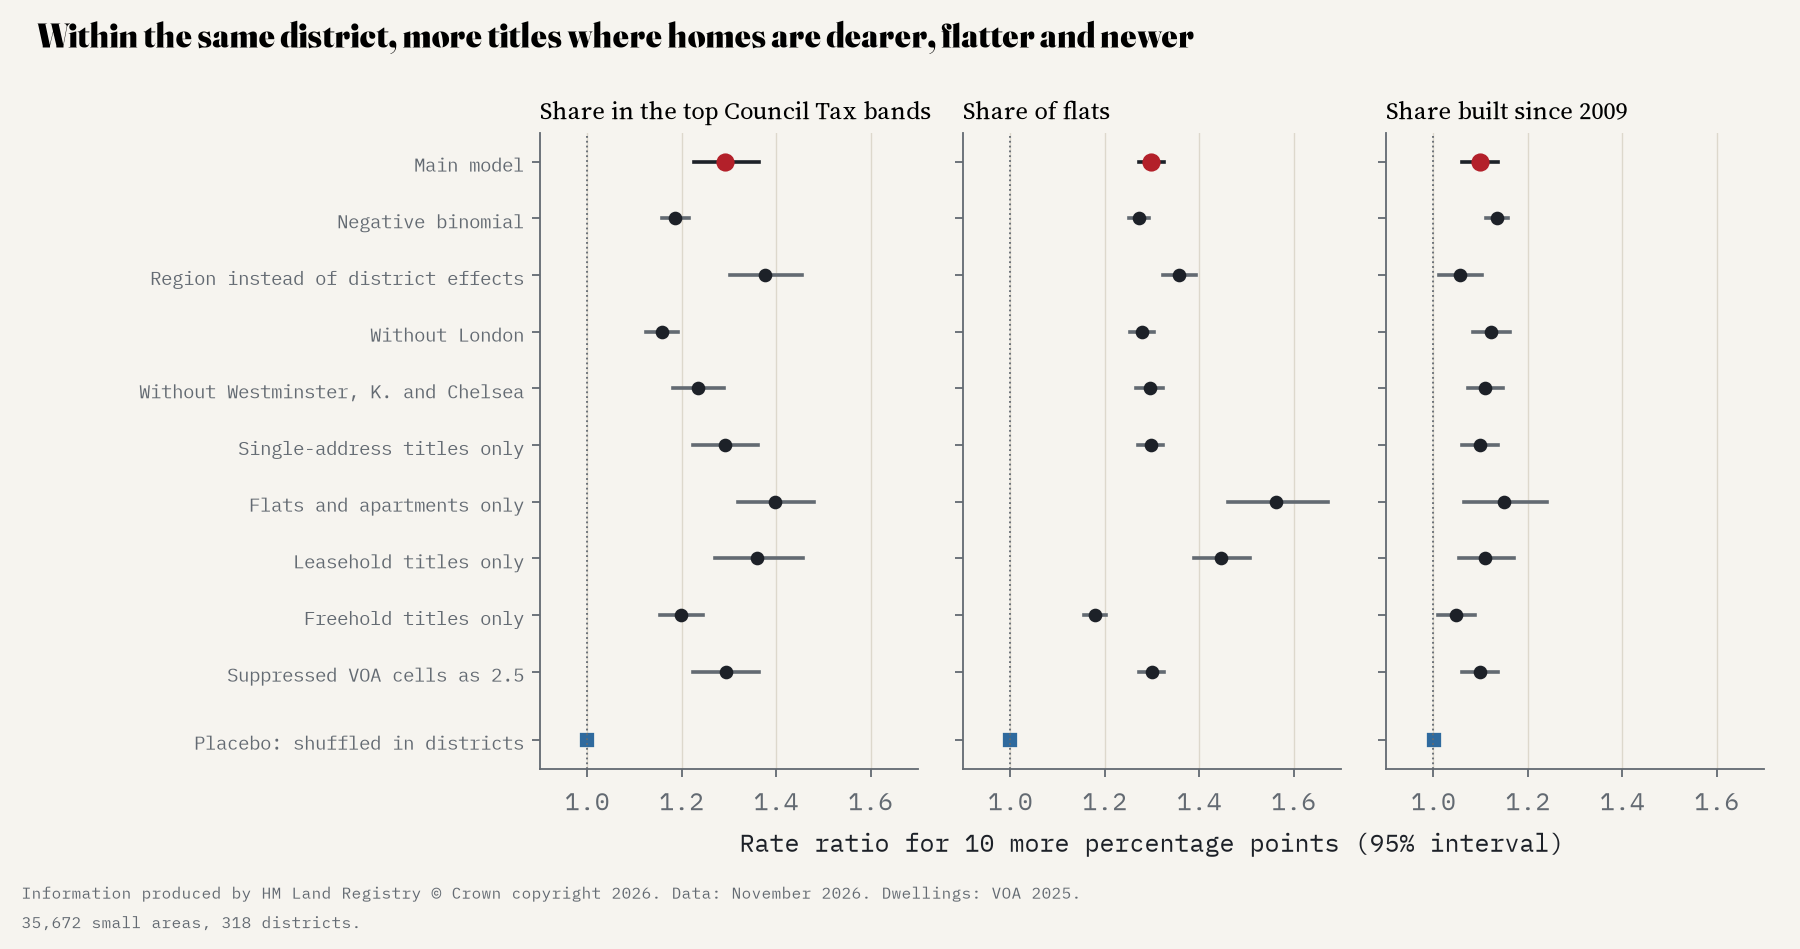
All three held in every one of the 18 checks I had planned, including leaving London out, leaving each region out in turn, and counting flats only. As a test, I also shuffled each district’s titles at random across its small areas 200 times. The shuffled versions show nothing at all, so the pattern is not an accident of the method. It describes where the titles are. It does not tell us why they are there.
A snapshot, not a history
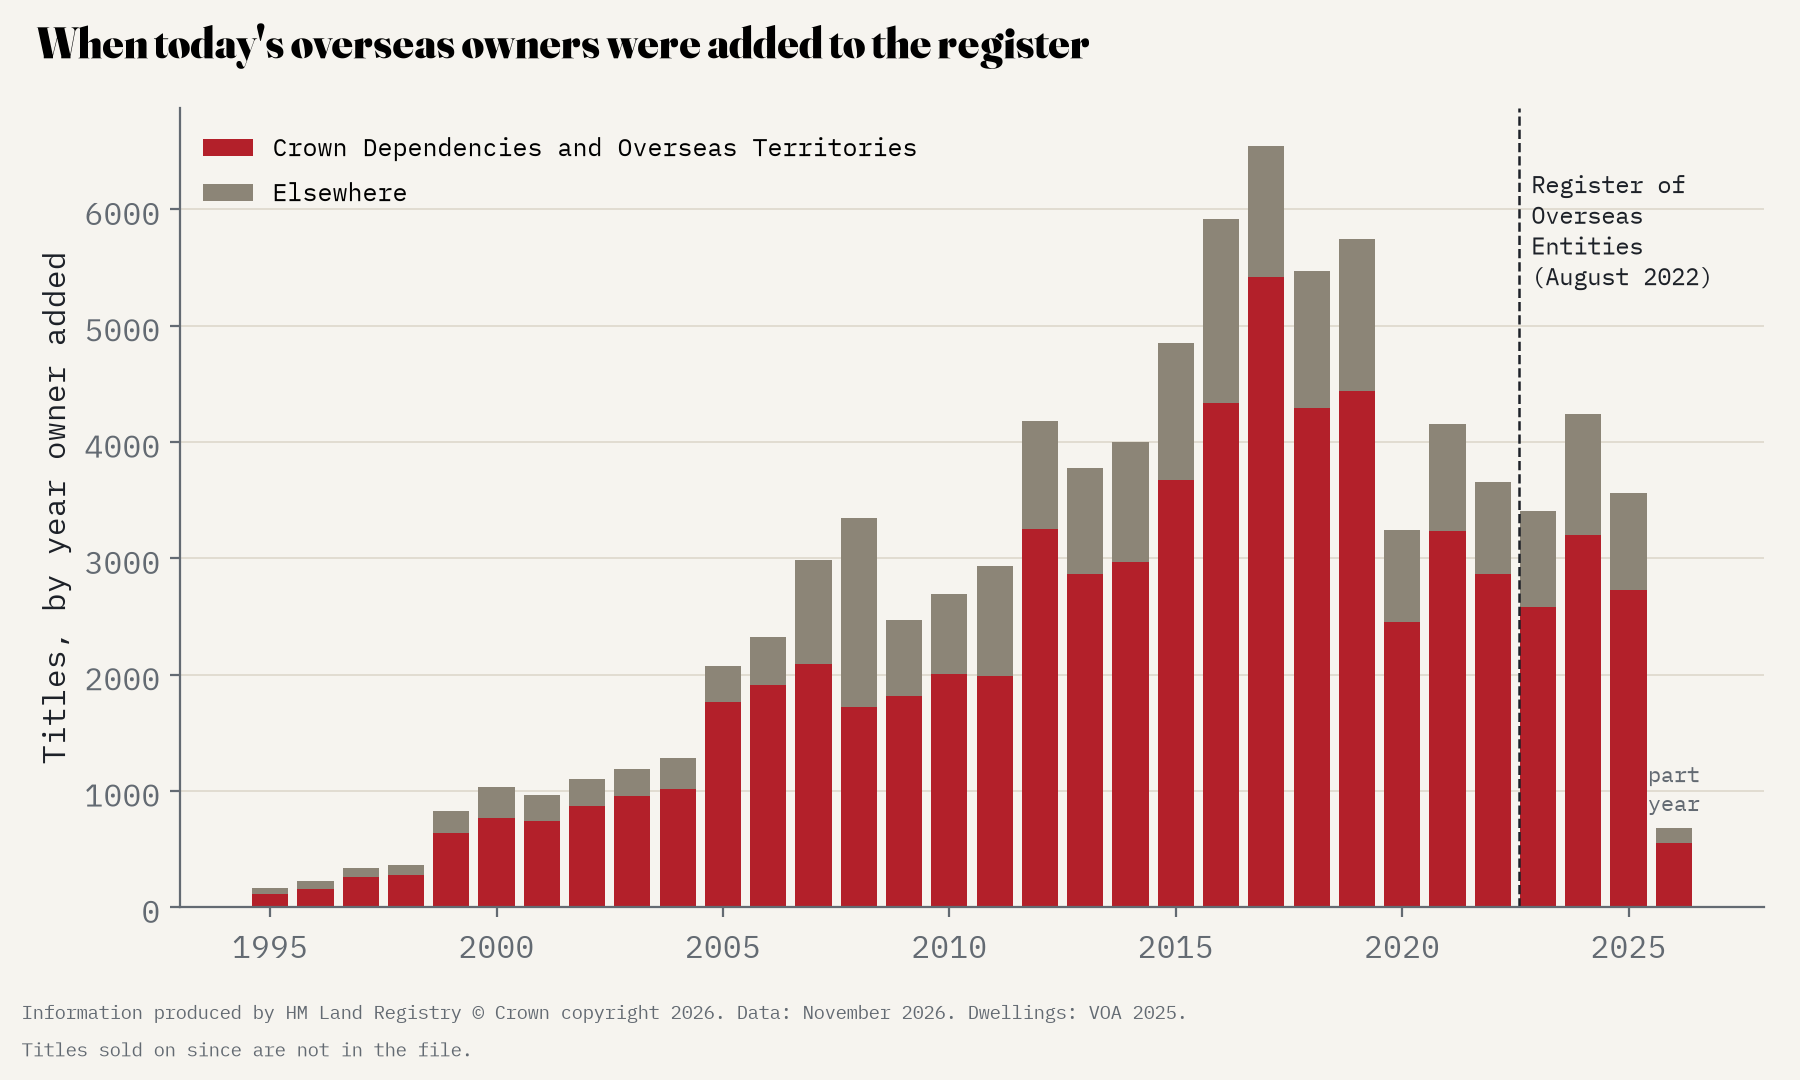
The list only contains titles owned today, with the date the current owner was added. The most common year is 2017, with 6,544 titles. Since 2022, 15,551 titles have been added. Titles that were sold on are no longer in the list, so the older years look smaller than they really were.
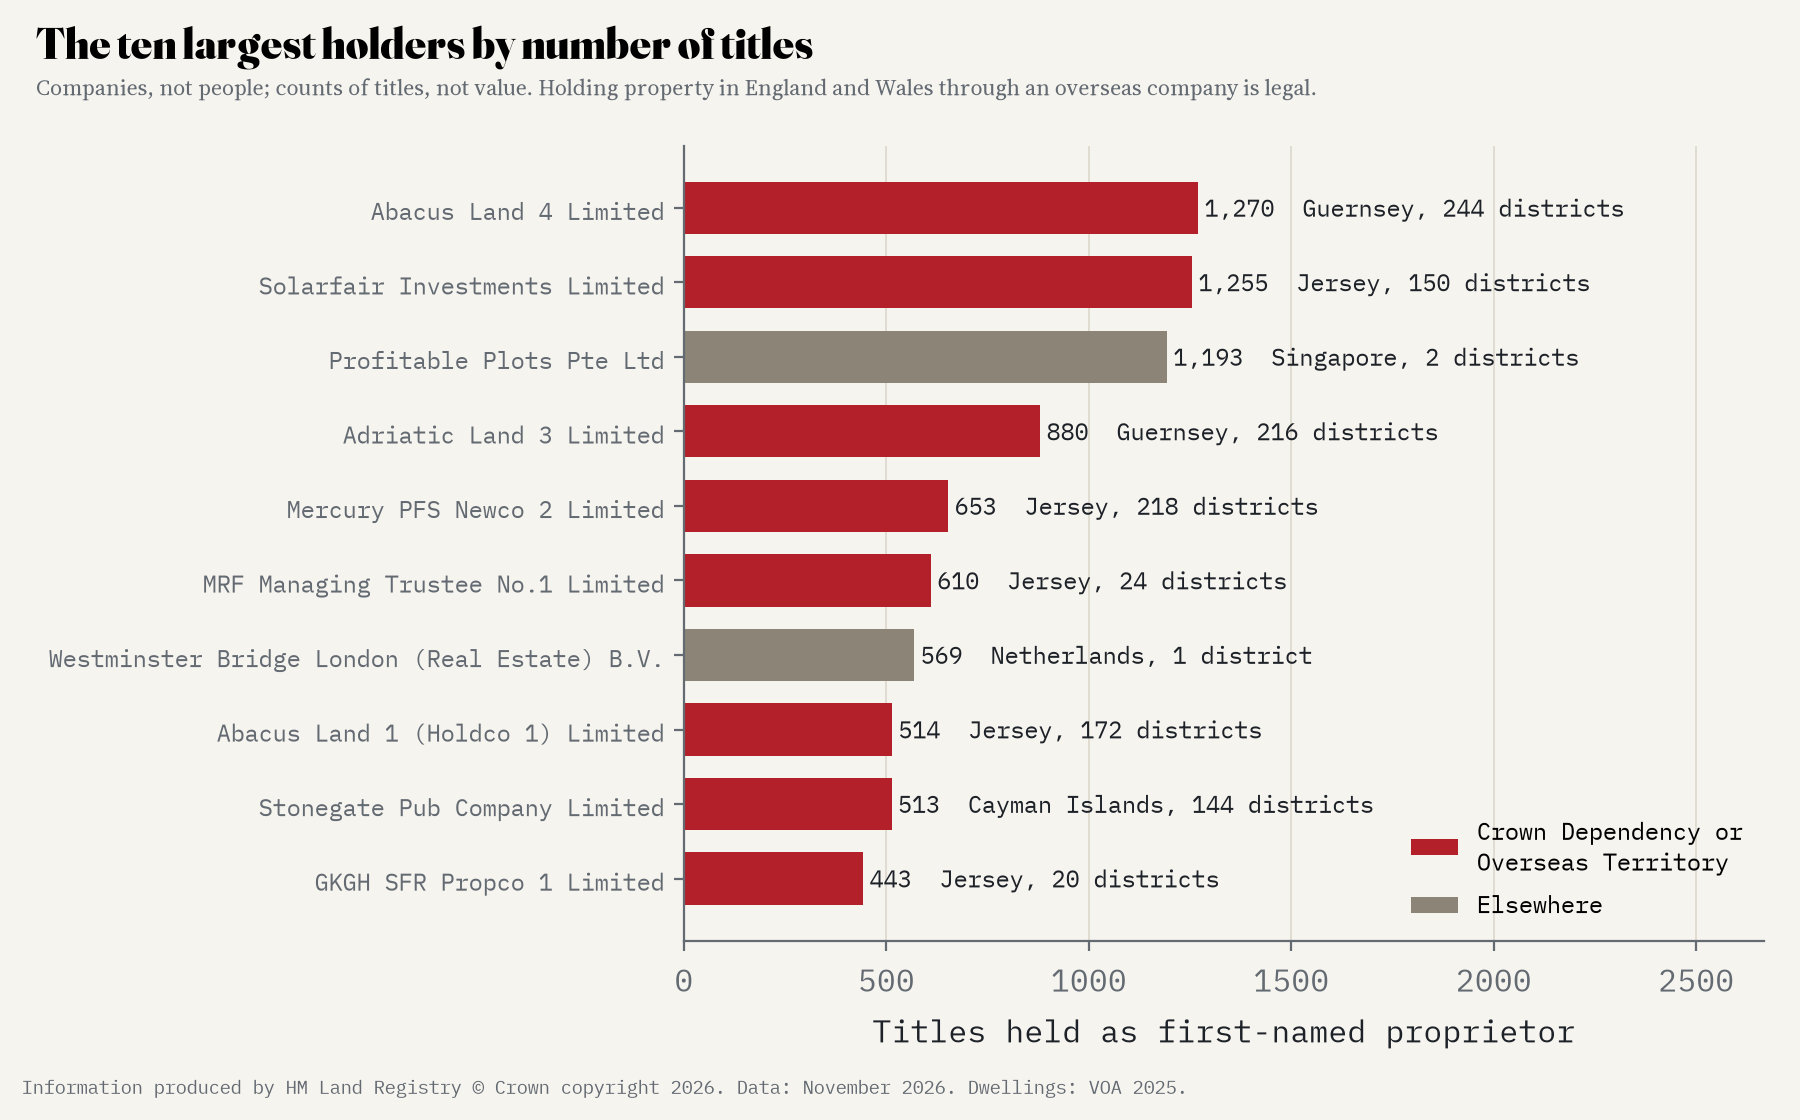
Most owners hold just one title: 63% of the 28,198 companies. A few hold hundreds, and 6 of the ten largest hold titles in more than 100 districts each. Counting titles is not counting value, and a big count says nothing about how a company behaves.
How I did this
The titles come from HM Land Registry’s list of overseas companies that own property in England and Wales, the full file for November 2026. I matched each title’s postcode to its small area (an LSOA, about 1,500 people). 66,913 titles (74%) have a postcode that works; the rest, often land, are counted in their district only. Homes and their Council Tax bands, type and age come from the Valuation Office Agency’s 2025 tables. I cleaned the countries (American states into the United States, the emirates into the UAE and so on) and wrote down my questions, my definitions and the checks I would run before computing any counts. The analysis was pre-specified in a written plan, and the paper reports it in full.
The licence for this list allows non-commercial use and does not allow the list itself to be republished. So the map, the paper and the data only ever show counts for areas, countries and years. No title, address or postcode from the list appears anywhere.
What this can’t tell you: who really owns these companies, what the properties are used for, or why they are where they are. The list leaves out property owned from abroad through UK companies, trusts or in a person’s own name. A title can be a parking space or a business park. And the Council Tax bands I used to describe each area are based on 1991 values in England and 2003 values in Wales.
Notes and sources
- Information produced by HM Land Registry © Crown copyright 2026. Overseas companies that own property in England and Wales, full file, data at November 2026. Used under HM Land Registry’s licence for non-commercial use; only aggregate counts are published.
- Homes: Valuation Office Agency, Council Tax: stock of properties 2025 (Open Government Licence). Postcodes to small areas: postcodes.io (ONS Postcode Directory, Open Government Licence). Boundaries: ONS (Open Government Licence). Base map: OpenFreeMap, OpenStreetMap contributors (ODbL).
- Further reading: R. Fernandez, A. Hofman and M. Aalbers, London and New York as a safe deposit box for the transnational wealth elite (2016); R. Atkinson, Alpha City (2020); F. Sá, The effect of foreign investors on local housing markets (2025); M. Collin, F. Hollenbach and D. Szakonyi, The end of Londongrad? (2025); Transparency International UK, Faulty Towers (2017).
- I wrote the text, with drafting and editing assistance from Claude (Anthropic), which also helped prepare the analysis code. I reviewed and checked all text and results.

