
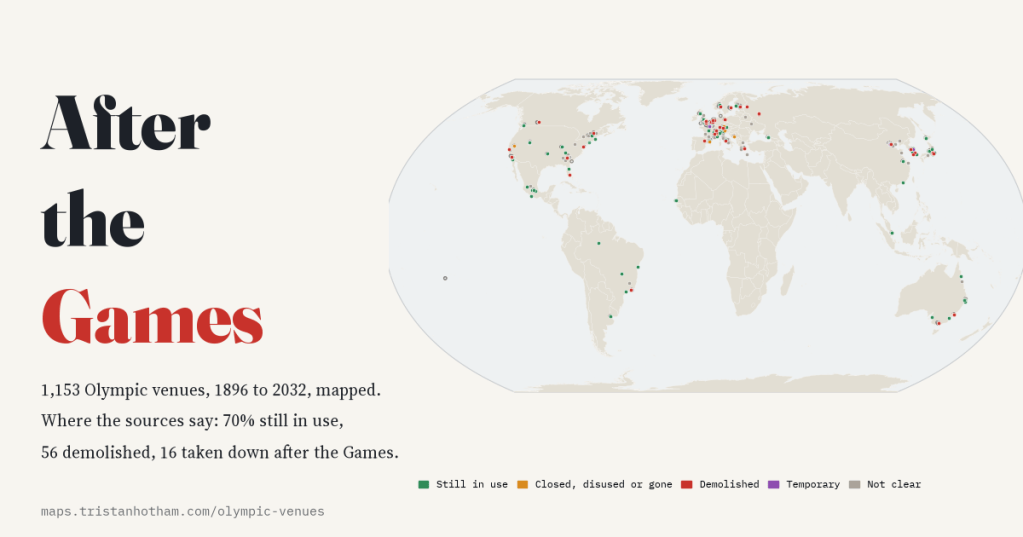
Every Olympics leaves a city full of stadiums, pools, rinks and ski jumps. I mapped all 1,153 venues that Wikipedia lists, from Athens 1896 to Brisbane 2032, and went looking for what became of them.
Wikipedia keeps a category of venues for every Olympic Games: “Venues of the 1908 Summer Olympics”, “Venues of the 2026 Winter Olympics” and so on, 66 of them, Youth Olympics included. Put them together, match each article to Wikidata, and you get 1,153 places that hosted, or will host, an Olympic event, 1,038 of them with coordinates. That is the raw material for this map.
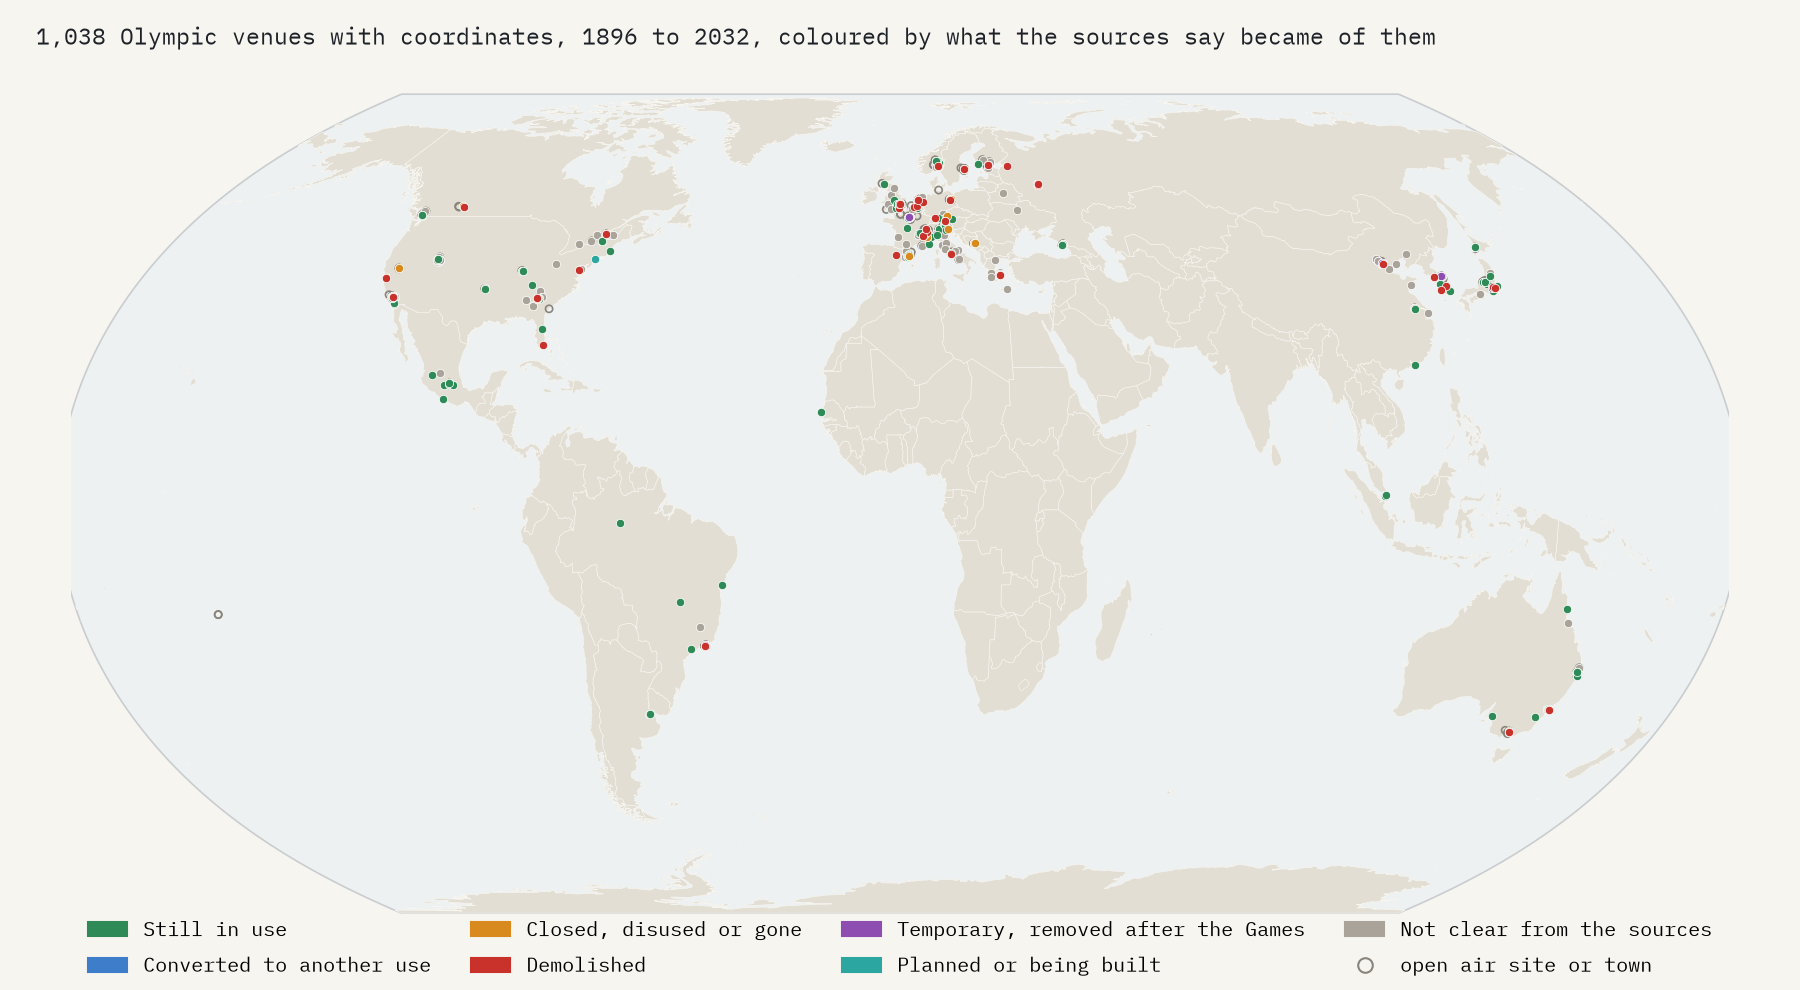
Where the Games went
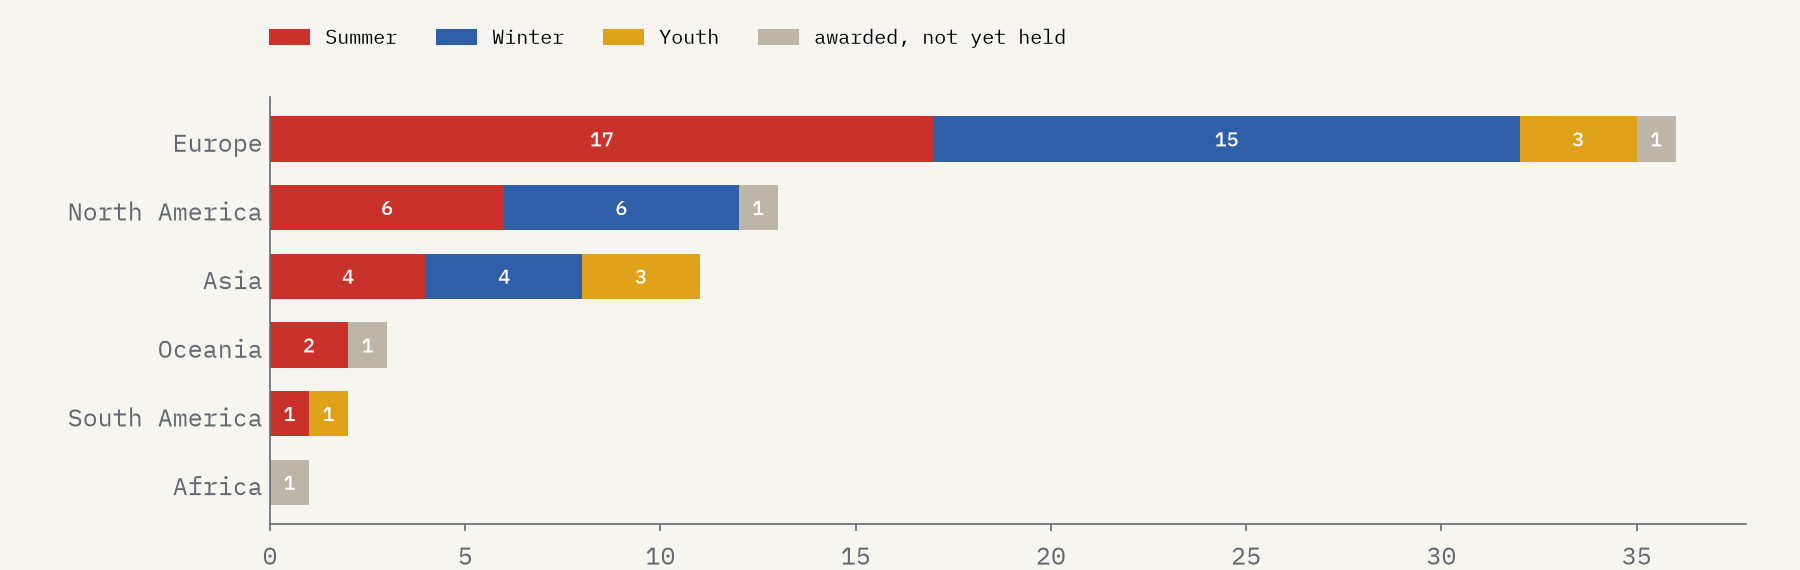
The map is heavily European. Of the 55 Summer and Winter Games held so far, 17 Summer and 15 Winter editions were in Europe, 58% of the total. North America has had 6 of each, Asia 4 of each, Oceania two Summer Games and South America one. No Winter Games has been held in the southern hemisphere, and the Youth Games in Dakar in 2026 are the first Olympics of any kind in Africa.
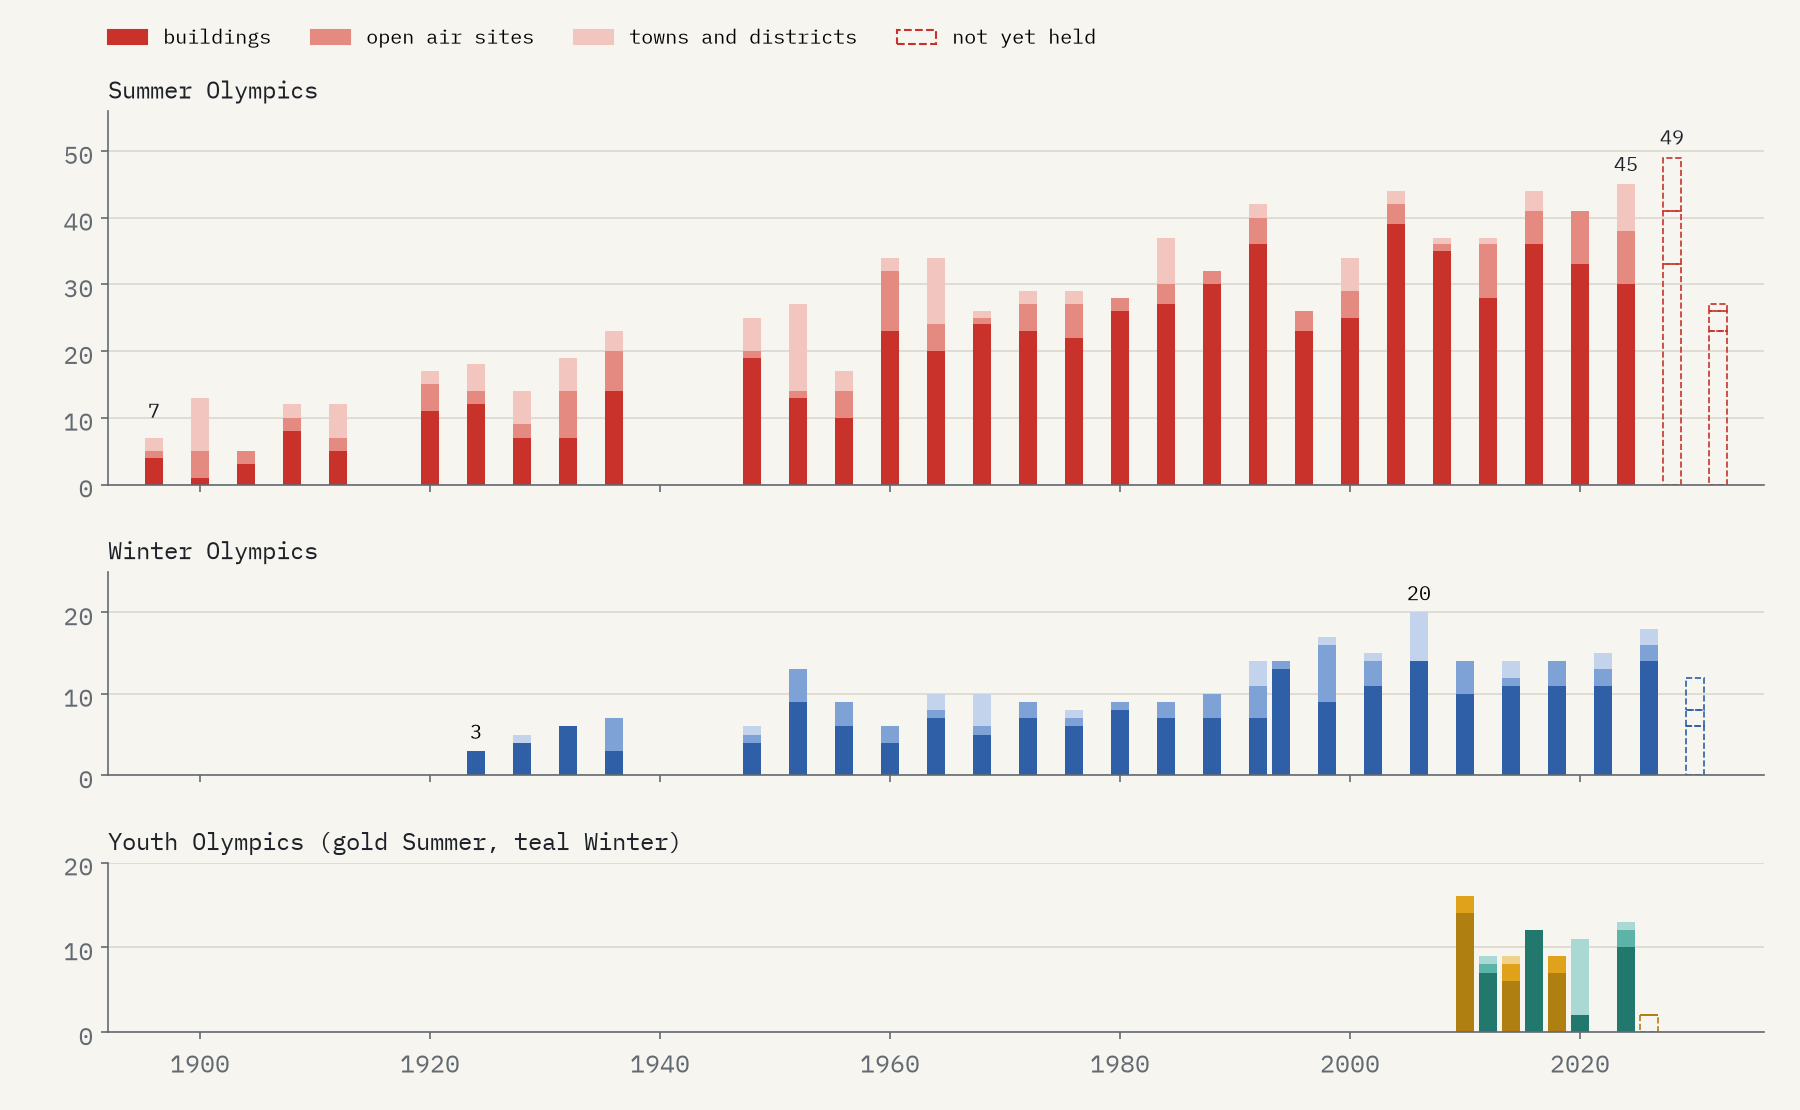
The Games also got bigger. Athens in 1896 needed 7 venues; Summer Games since 1990 have averaged 38.9 in Wikipedia’s categories, and Paris 2024 used 45. Los Angeles has 49 listed for 2028.
Compact cities, scattered mountains
How spread out is an Olympics? I took the middle of each Games’ venues and measured the distance to each one. For a typical Summer Games, half the venues are within 8.4 km of the middle, and that has hardly changed in a century. The exceptions are single events sent far away: Melbourne’s 1956 horse events went to Stockholm because of Australian quarantine laws, 15,597 km away, and Paris 2024’s surfing took place at Teahupoʻo in Tahiti, 15,724 km from the rest of the Games.
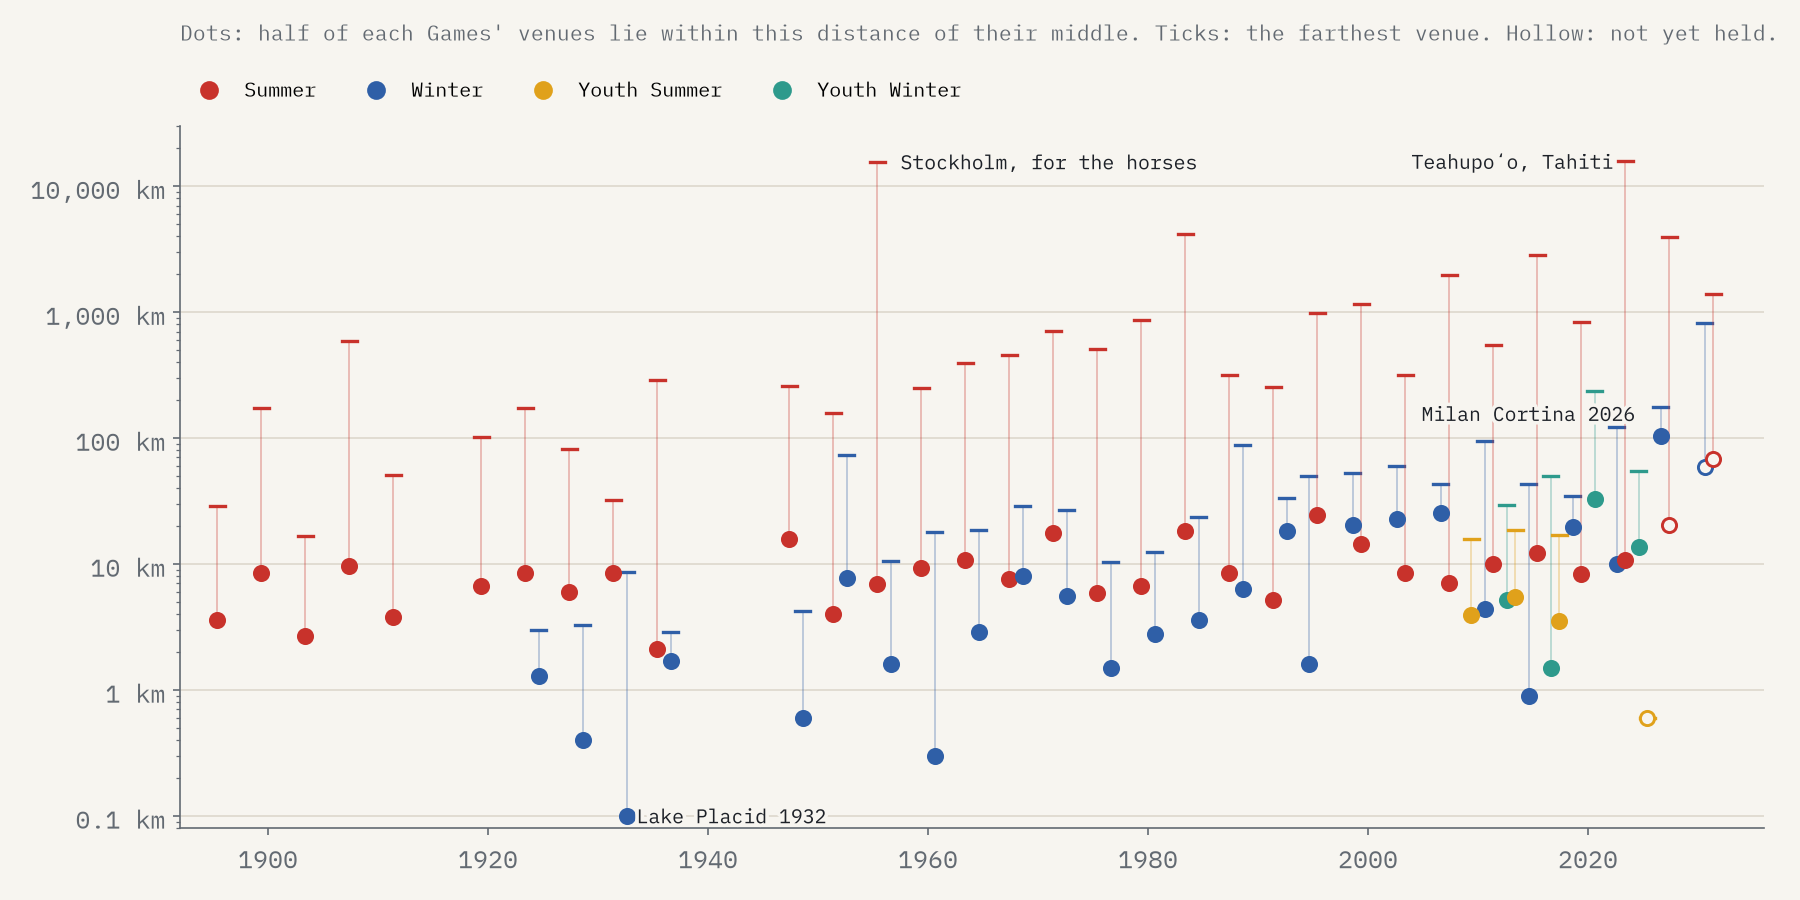
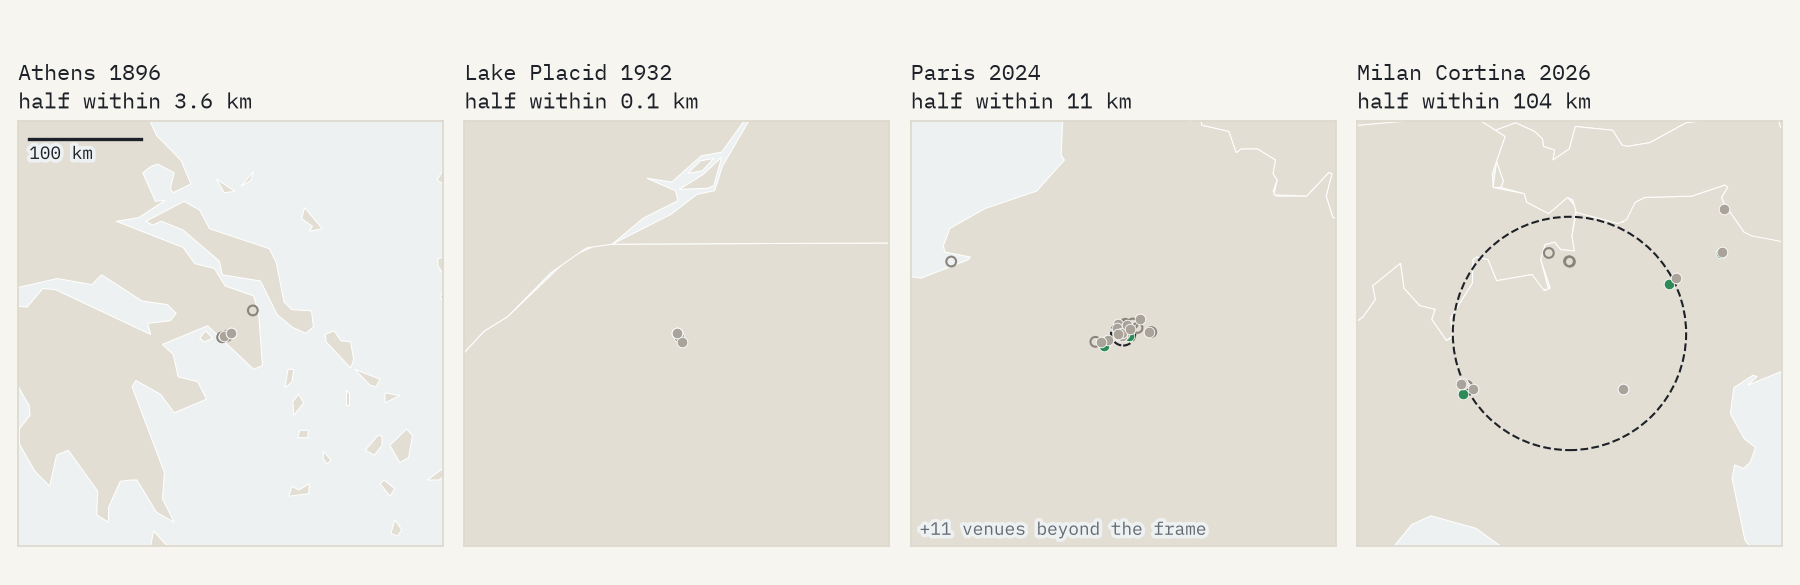
The Winter Games are the real story. Until the 1980s they fitted inside one resort: half of St. Moritz’s 1928 venues were within 0.4 km of their middle, Lake Placid’s in 1932 within 0.1 km. Since 1990 hosts have paired a city for skating and hockey with distant mountains for skiing, and the typical figure has risen from 1.7 km to 18.9 km. Milan Cortina 2026 broke the scale: half its venues were more than 104 km from the middle.
Used again
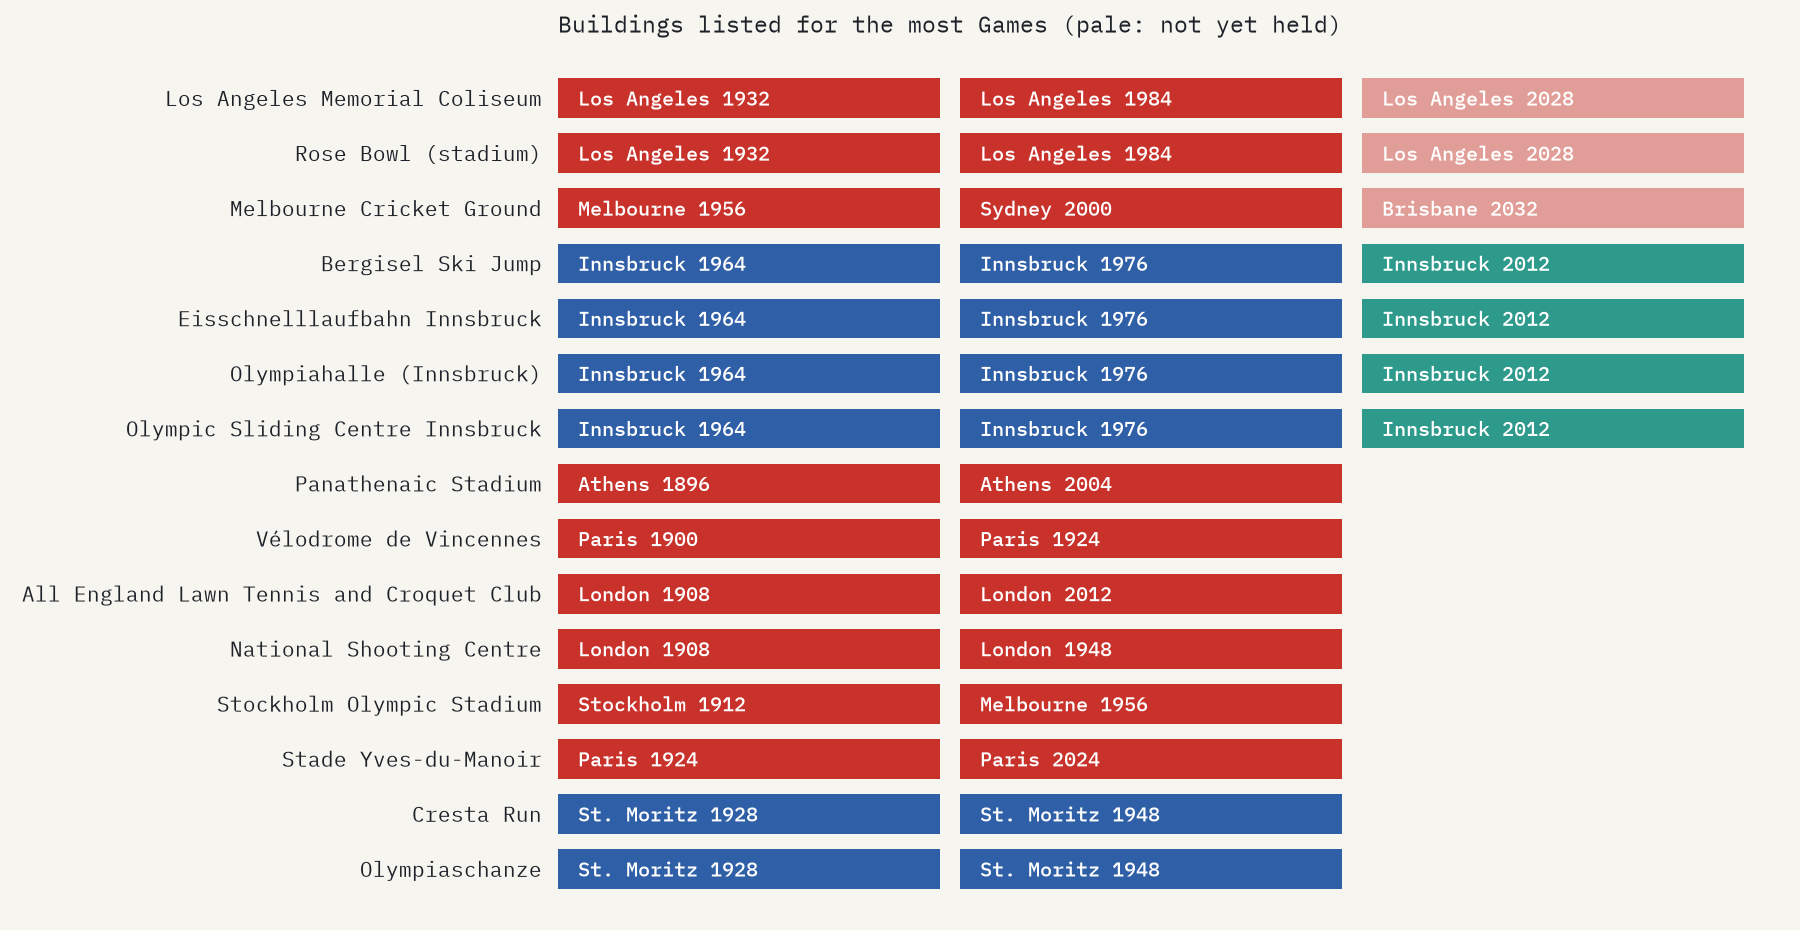
88 venues appear in the lists of two or more Games. The Los Angeles Memorial Coliseum and the Rose Bowl are listed for 1932, 1984 and 2028; the Melbourne Cricket Ground for 1956, 2000 and 2032; Innsbruck’s ski jump, oval, ice hall and sliding track for 1964, 1976 and the Youth Games of 2012. 8 venues served both a Summer and a Winter Games: seven in Beijing, which went back to the Bird’s Nest and the Water Cube in 2022, and the Japanese resort of Karuizawa.
What became of them
This is where the sources run thin. For each of the 788 buildings and built sports grounds of past Games I looked for a clear statement in Wikidata (a demolition date, “permanently closed”, “temporary sports venue”) or in the first paragraph of its Wikipedia article (“was demolished”, “has been abandoned”, “was a temporary venue”), counting a sentence only when it is about the venue itself. That gives a fate for 344 of them, 44%. For the rest, the honest answer is that the sources do not say.
Among the venues with a stated fate, 70% are still in use, often as the home of a football or hockey club. 56 have been demolished, from London’s White City Stadium of 1908 (gone in 1985) to Tokyo’s 1964 National Stadium (2015) and Atlanta’s Georgia Dome (2017). 29 are closed, abandoned or described only in the past tense, among them the bobsleigh tracks of Sarajevo 1984 and Turin 2006. And 16 were temporary, built to be taken away, like London 2012’s basketball arena, dismantled in January 2013, and Paris 2024’s Grand Palais Éphémère.
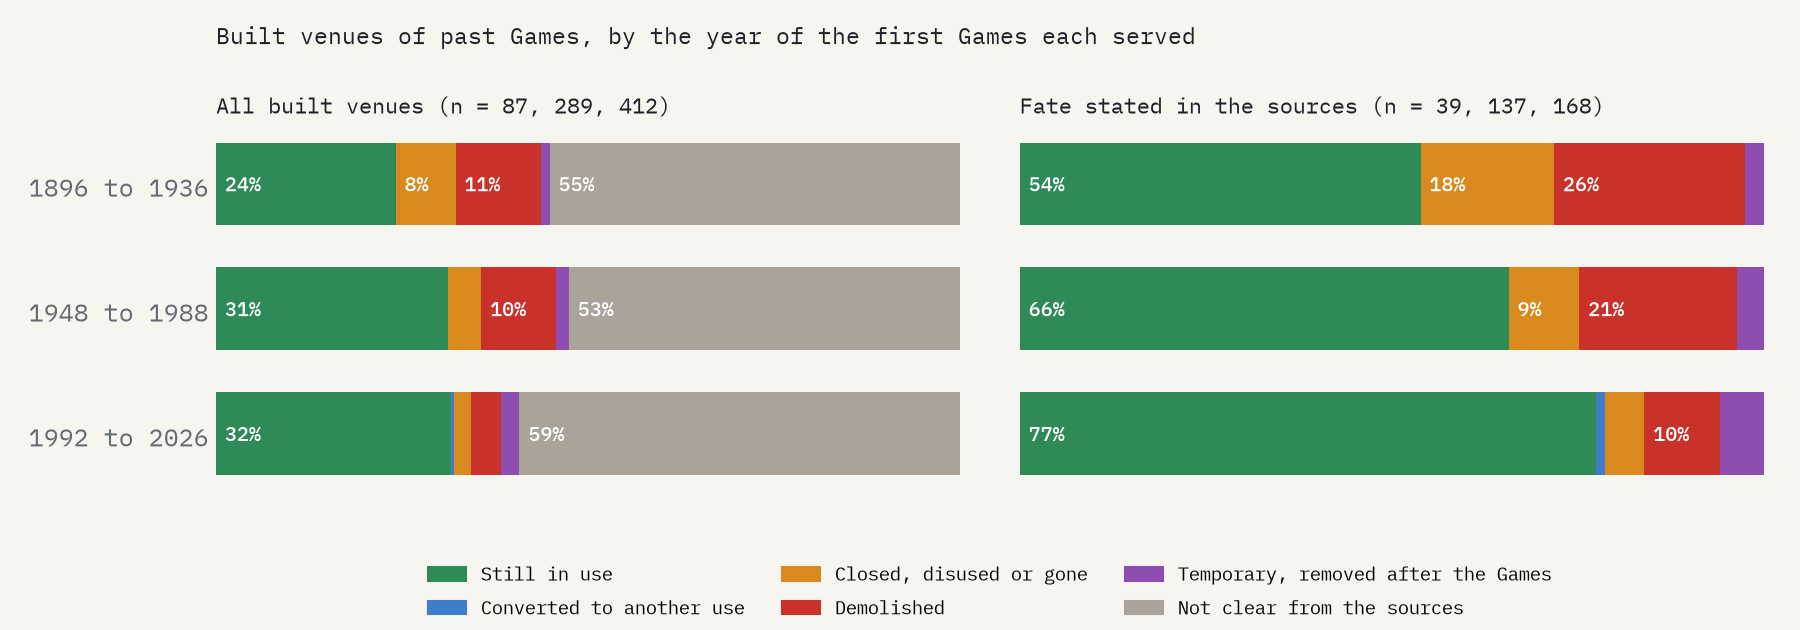
Of the venues first used before the Second World War whose fate is known, 46% are gone or closed. For those first used since 1992, 21%.
Age explains much of that: an arena that has stood for ninety years has had ninety years to be replaced. But demolitions keep coming. 40 of the 54 demolitions with a year in the sources happened since 2000, a median of 28 years after the venue’s last Games.
Caveats
This is Wikipedia’s list, not the IOC’s: venues without an article are missing, and some categories list a town or a park rather than a stadium. “Still in use” means the article describes a working venue, not that it is busy or paying its way. Most fates are unknown, and the known ones are probably skewed towards venues where something dramatic happened. The map lets you check every classification: click any dot to see the sentence it rests on.
Data: English Wikipedia (CC BY-SA 4.0) and Wikidata (CC0); outlines from Natural Earth. The interactive map, paper, data and code are linked above; the code is on GitHub. I wrote the text, with drafting and editing assistance from Claude (Anthropic), which also helped prepare the analysis code. I reviewed and checked all text and results.

