
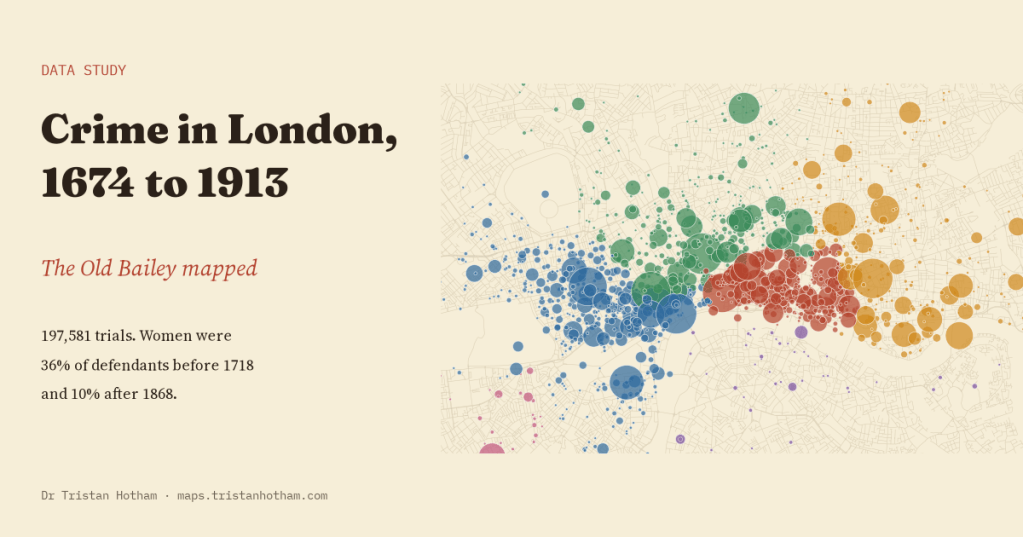
For 240 years, people accused of serious crimes in London stood trial at the Old Bailey, and an account of almost every trial was printed. I rebuilt the whole record, 197,581 trials from 1674 to 1913, to see what Londoners were tried for, how they were punished, how many of them were women, and where in the city the crimes happened.
The Old Bailey Proceedings are one of the great records of ordinary London life. They began in 1674 as a cheap pamphlet sold after each session of the court, and they carried on until 1913. The Old Bailey Online project transcribed every page and, crucially for a data person, tagged every defendant, every offence, every verdict and every sentence, and joined them up. The tagged data are free to use for research.
I read the whole XML release in place, one session at a time, and made one row for each defendant on each charge: 256,274 rows. Before I looked at any trend, I wrote down six things I expected to find and how I would test them. Some came out as expected. One did not.
From the gallows to the prison
The clearest story is punishment. Before 1718, a guilty defendant faced death, branding, a fine or a whipping. Prison was hardly ever the sentence. Then Parliament passed the Transportation Act, and almost overnight the court began shipping convicts across the Atlantic. In the 1720s, 67% of guilty defendants were sentenced to transportation. The share peaked at 72% in the 1760s.
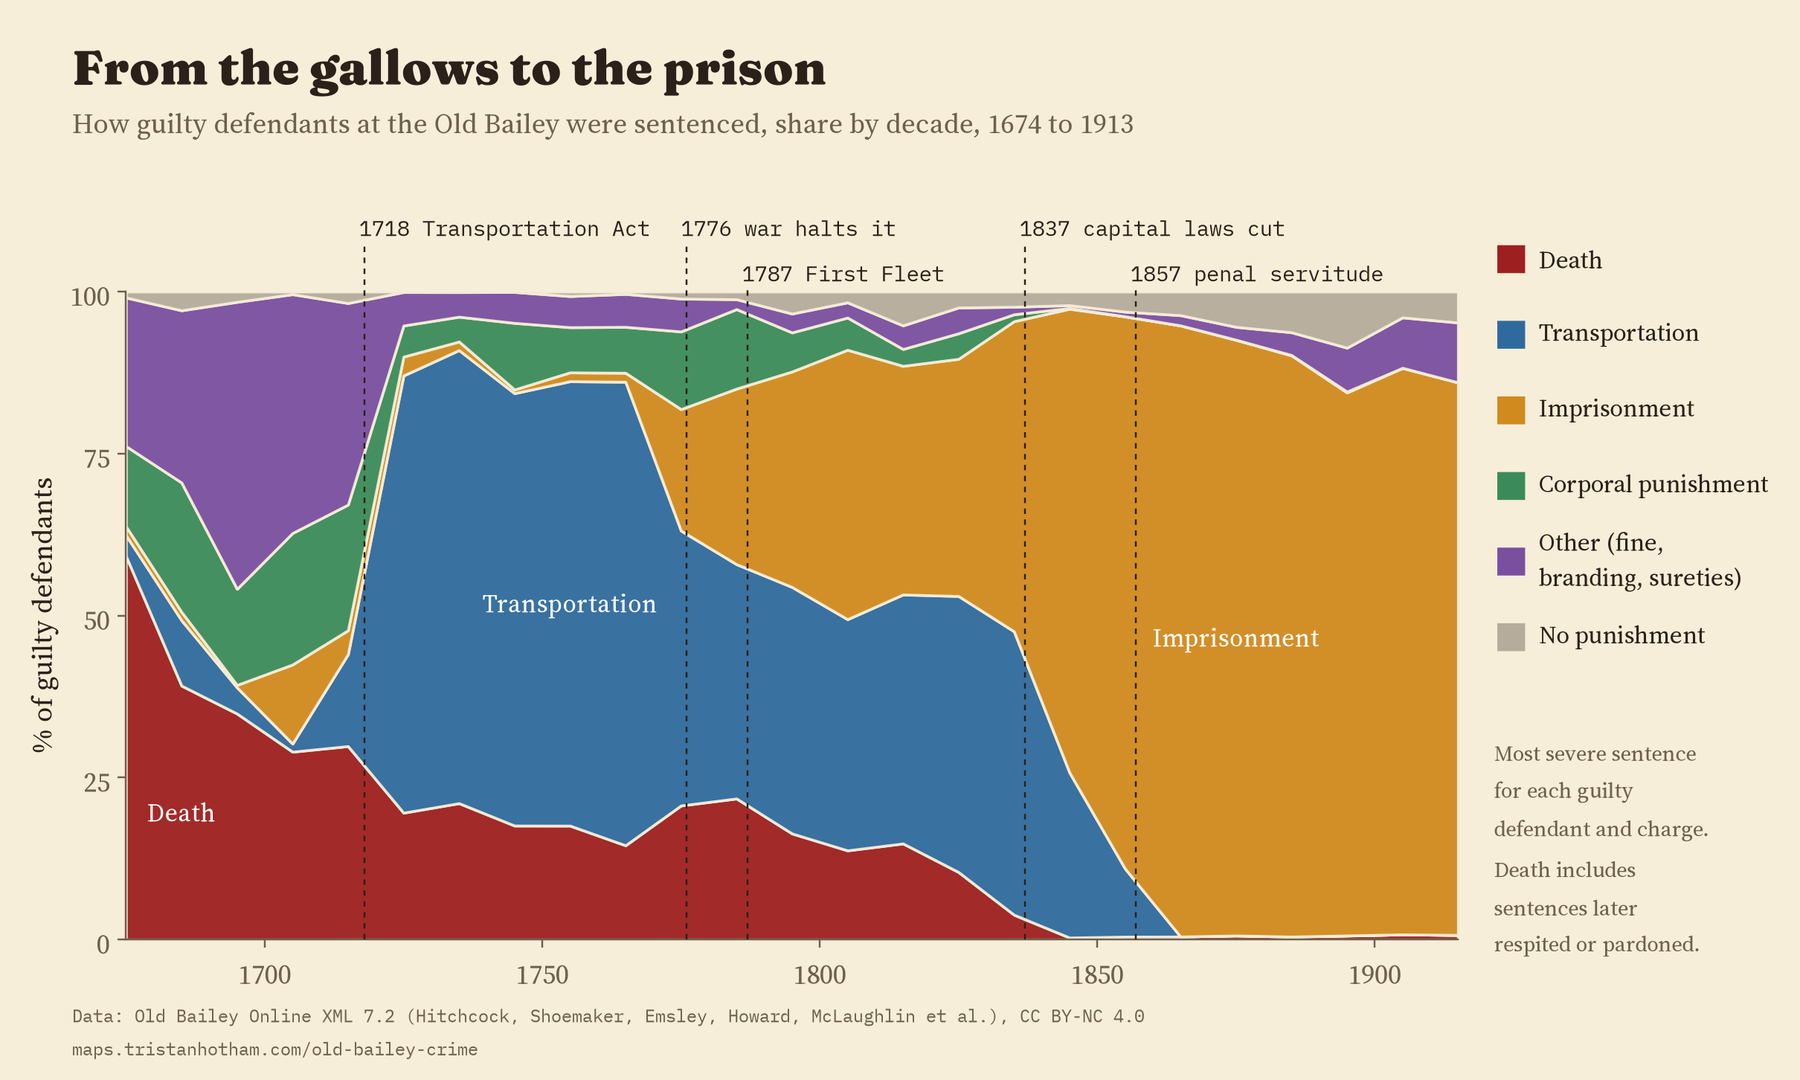
Then the American war closed the colonies. In 1775, 57% of guilty defendants were sentenced to transportation. In 1777, 0%. The courts had to put people somewhere, so they put them in prison and in old ships moored on the Thames. Transportation sentences came back in the 1780s (48% in 1786, the year before the First Fleet sailed for Australia), but prison never gave the ground back. It has been the most common sentence in every decade since the 1830s, and by the 1900s it was 87% of all sentences.
The surprise was the death sentence. I expected it to peak at the end of the eighteenth century, the high point of what historians call the Bloody Code. As a share of guilty verdicts, though, it was highest right at the start: 39% in the 1680s, before transportation existed. It did rise again in the 1780s, to 22%, and then it fell away: 10% in the 1820s, 3.8% in the 1830s and 0.3% in the 1840s, as Parliament cut the list of capital crimes. These are sentences, not executions; many people sentenced to death were later spared.
The vanishing female defendant
In 1991 Malcolm Feeley and Deborah Little published a paper with a memorable title, “The Vanishing Female”. Using the Old Bailey records, they argued that women had been a big part of the criminal courts in the eighteenth century, more than 45% of defendants at times, and that they then almost disappeared. With every trial now tagged, I could count again.
They were right. Women were 36% of defendants from 1674 to 1717, 23% from 1775 to 1833, and 10% from 1868 to 1913. The decline is not because the court started hearing different kinds of crime. Among people tried for theft alone, women were 41% from 1700 to 1739 and 6% from 1880 to 1913. Nor is it because the court’s area grew in 1834: the share of women went up a little when the boundary changed, not down.
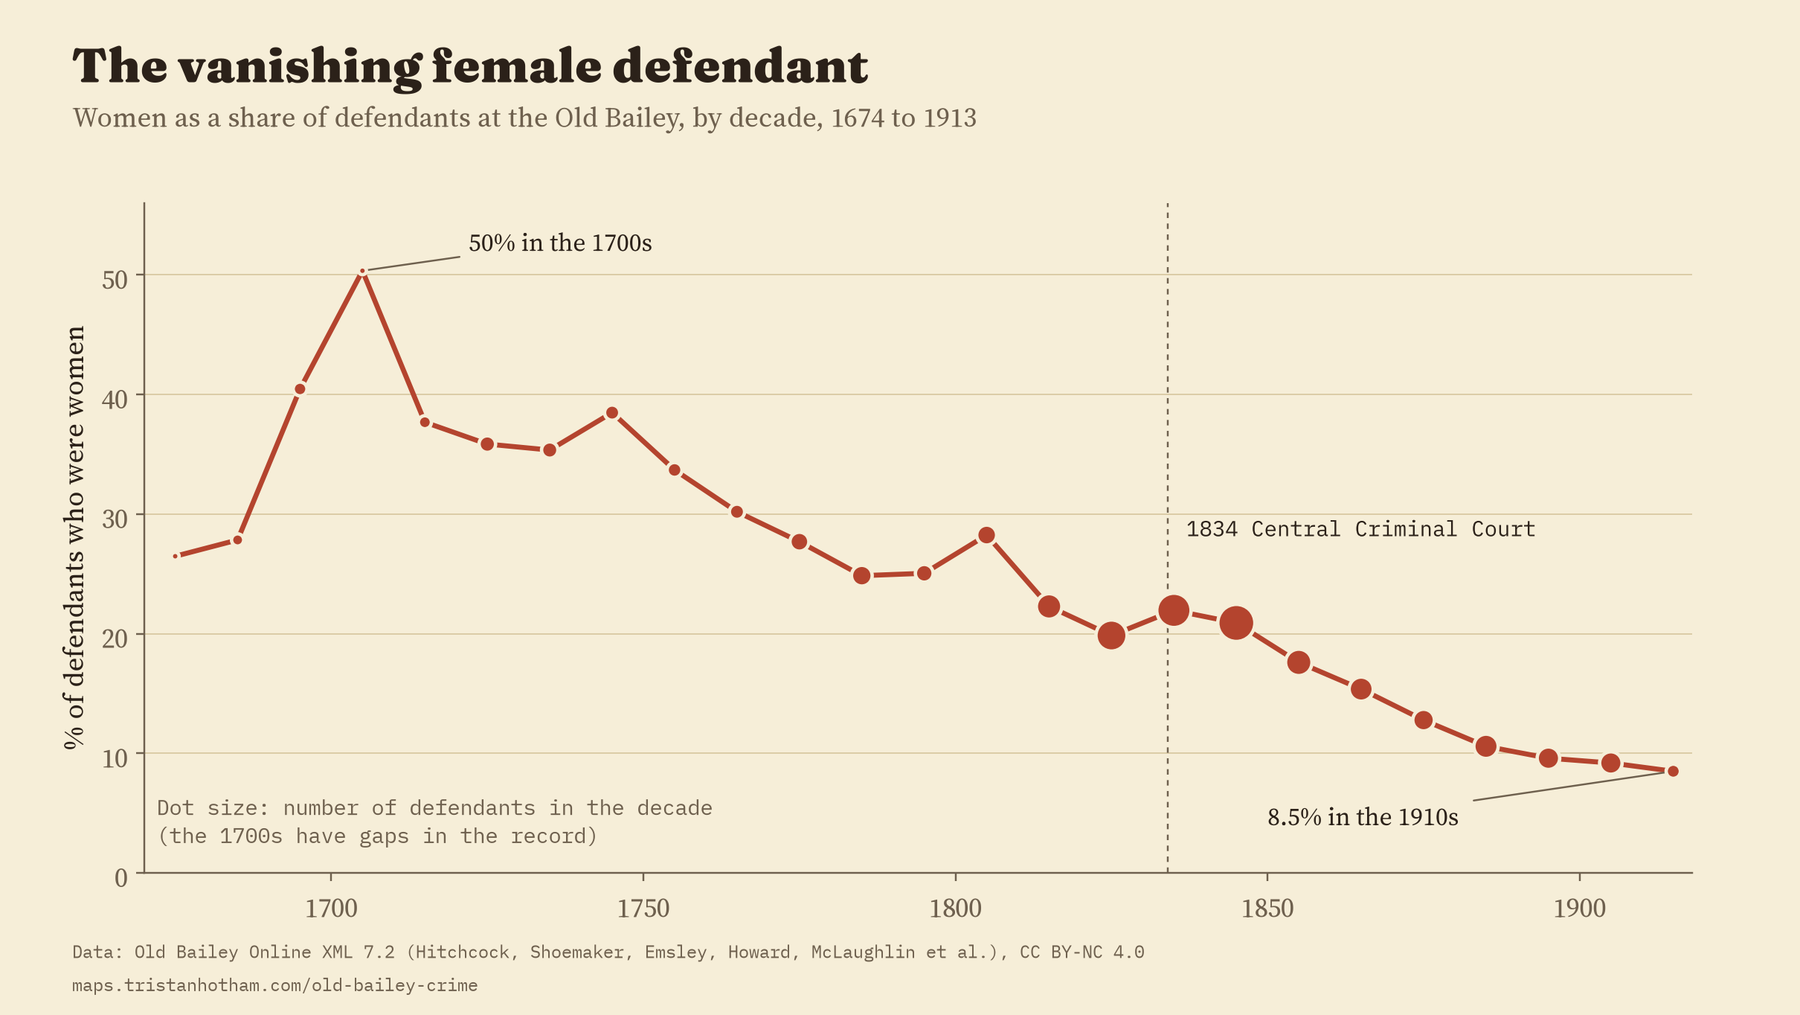
Why it happened is a harder question than the counting can answer. It could be about what women did, or about who chose to prosecute them and in which court. What the full record does show is that the fall is real, steady and long.
Fewer thefts, more violence
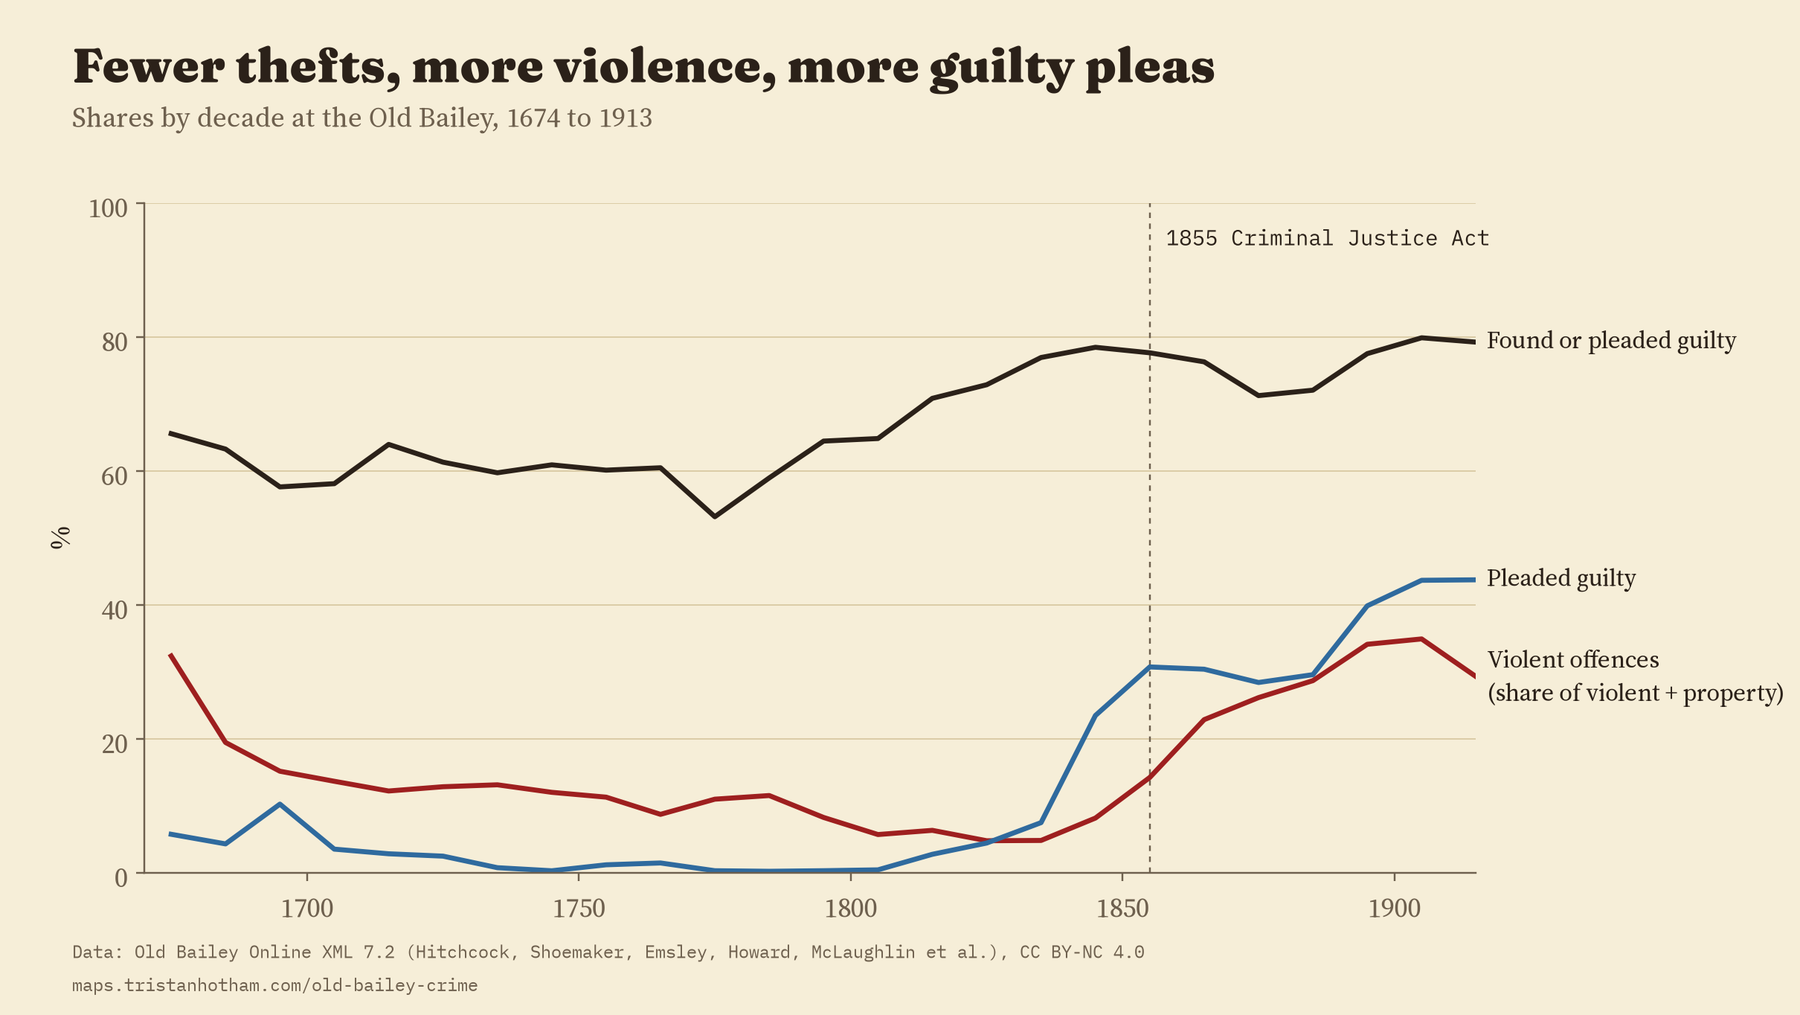
Theft was 72% of all the offences tried at the court. But the mix moved. Violent offences (killing, robbery, sexual offences, assault and wounding) were 16% of violent and property offences in the first period, only 7% from 1775 to 1833, when the court was flooded with thefts, and 31% from 1868 to 1913. This is most likely not London getting more violent, but small thefts going to magistrates instead, which left the Old Bailey with the serious cases. I expected a jump at the Criminal Justice Act of 1855 and did not find one: the rise was gradual.
The way trials ended changed too. Guilty pleas were rare for most of the eighteenth century and only 0.5% of outcomes in the decade from 1800 to 1809. By the 1850s they were 31%, and by the 1900s 44%.
Where the crimes were
This was the part I most wanted to see. From 1674 to 1834, the tagged records say where an offence happened: “Oxford-street”, “St. Martin in the Fields”, “the Cherry tree, in Kingsland road”. 55,987 offences have a place like this. After October 1834 the records only rarely tag a place, so the map ends there.
To put those places on a map I needed a gazetteer of old London. I used today’s streets from OpenStreetMap, districts and villages from Wikidata, and a hand-made list of 365 historic parishes, wards and renamed or vanished streets. Fleet Market is under Farringdon Street now. Rosemary Lane became Royal Mint Street. Ratcliff Highway is The Highway. In the end 80% of the located offences found a street or district.
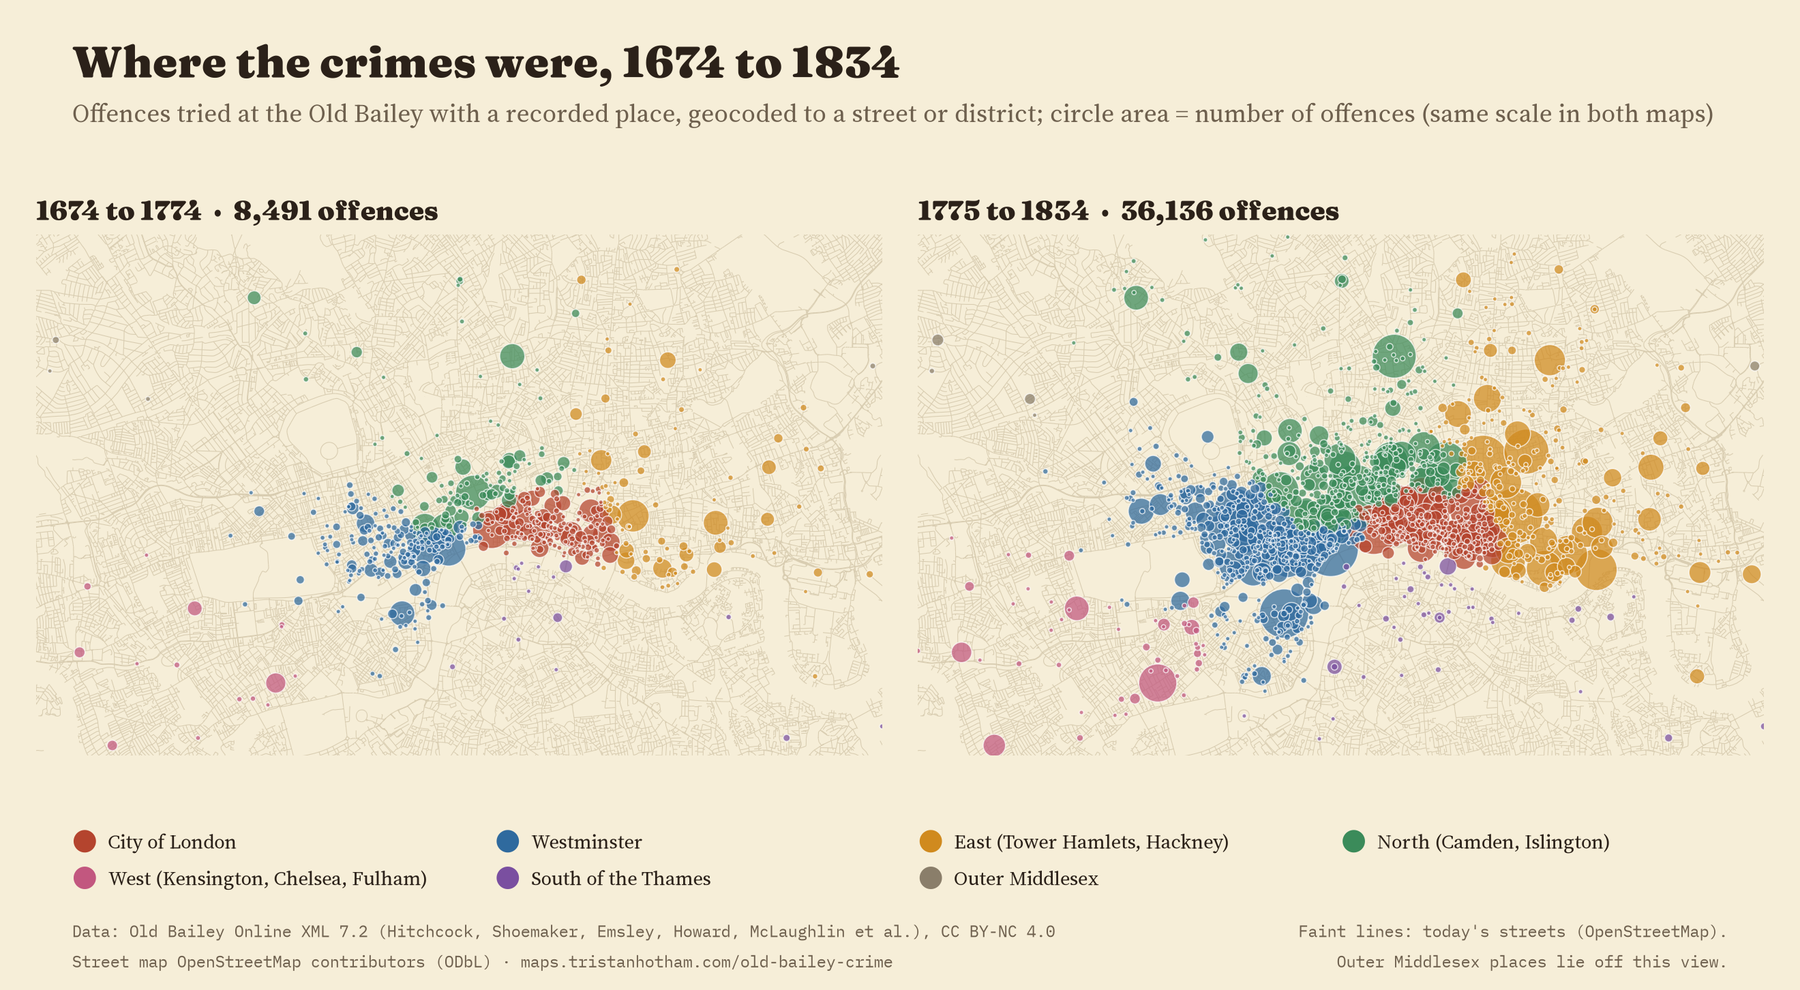
As London grew, the prosecuted crimes followed. The City of London’s share of mapped offences fell from 33% in 1674 to 1717 to 21% in 1775 to 1833. Westminster, the parishes to the north and the East End all grew. One honest caveat: this shift is a shift in thefts. Leave thefts out and there is no clear trend in the rest.
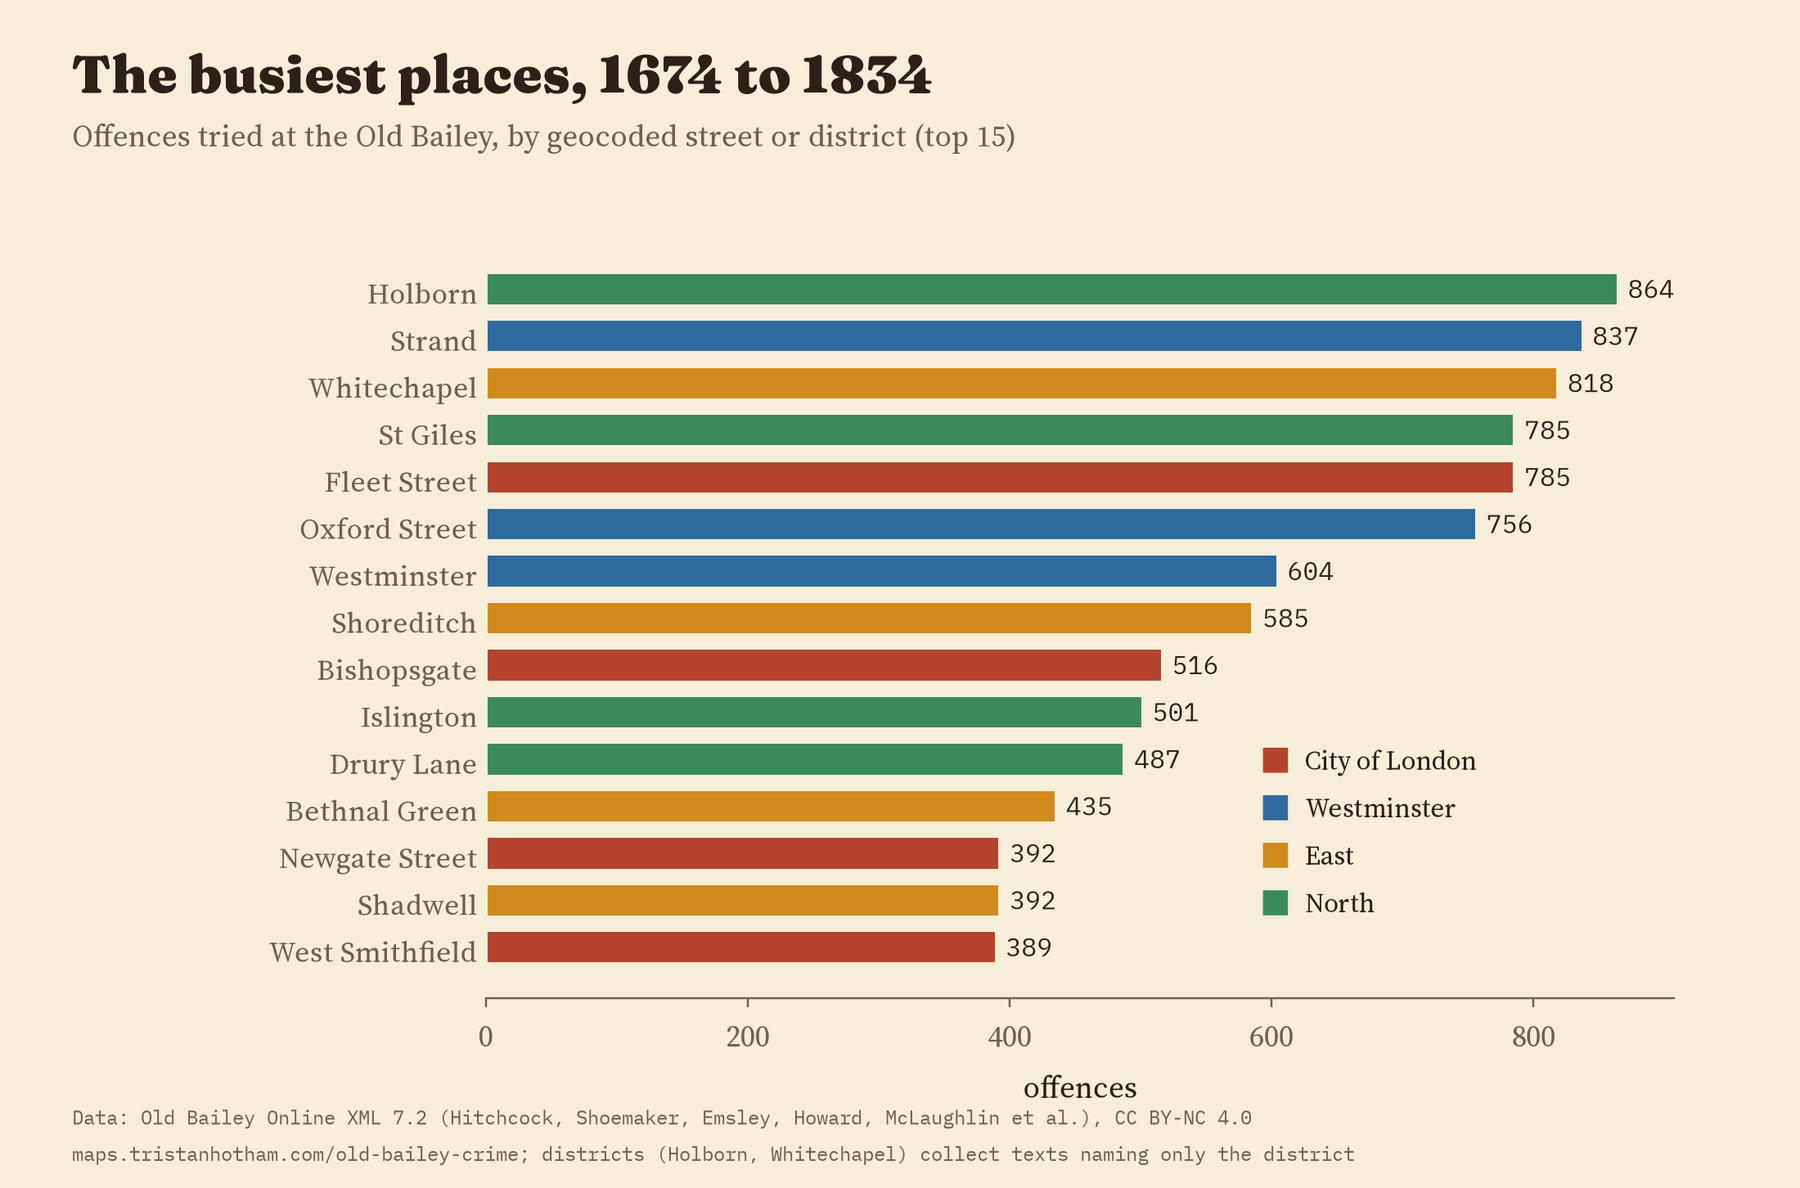
The busiest places were Holborn, the Strand and Whitechapel. From 1775 to 1833, Oxford Street topped the list.
On the interactive map you can slide through the decades, pick one kind of offence, and click any street to see its counts and a few example trials on Old Bailey Online.
How I did this
Everything comes from the Old Bailey Online XML release, version 7.2. Each defendant is linked to their offences and verdicts by tags in the files, and I followed those links. A sentence is the most severe one given to that defendant in that trial. I kept no names. The analysis was pre-specified in a written plan before I computed any trend, and the paper reports the planned tests, including the ones that went against me. Every number here comes from one results file that also fills the paper and the map.
There are limits. These are trials, not crimes: who ended up in court depended on victims, constables and magistrates. The places are where the record says, usually the victim’s house or shop, and they are approximate, often a street’s middle or a district’s centre. The early decades are thin. And the court’s boundary changed in 1834.
Notes and sources
- Old Bailey Online XML data, version 7.2 (Old Bailey Proceedings Online 1674 to 1913; Tim Hitchcock, Robert Shoemaker, Clive Emsley, Sharon Howard, Jamie McLaughlin and others; University of Sheffield, doi:10.15131/shef.data.4775434), CC BY-NC 4.0. This work builds on Old Bailey Online, which is licensed under a Creative Commons Attribution-NonCommercial 4.0 International License.
- Gazetteer: OpenStreetMap contributors (ODbL), Wikidata (CC0) and the author’s list of historic names. Borough outlines: Office for National Statistics (Open Government Licence v3.0).
- Further reading: M. Feeley and D. Little, “The Vanishing Female”, Law and Society Review (1991); J. M. Beattie, Crime and the Courts in England, 1660 to 1800 (1986); T. Hitchcock and R. Shoemaker, Tales from the Hanging Court (2006) and London Lives (2015); V. A. C. Gatrell, The Hanging Tree (1994).
- Derived data are CC BY-NC 4.0, as the source requires.
- I wrote the text, with drafting and editing assistance from Claude (Anthropic), which also helped prepare the analysis code. I reviewed and checked all text and results.

