
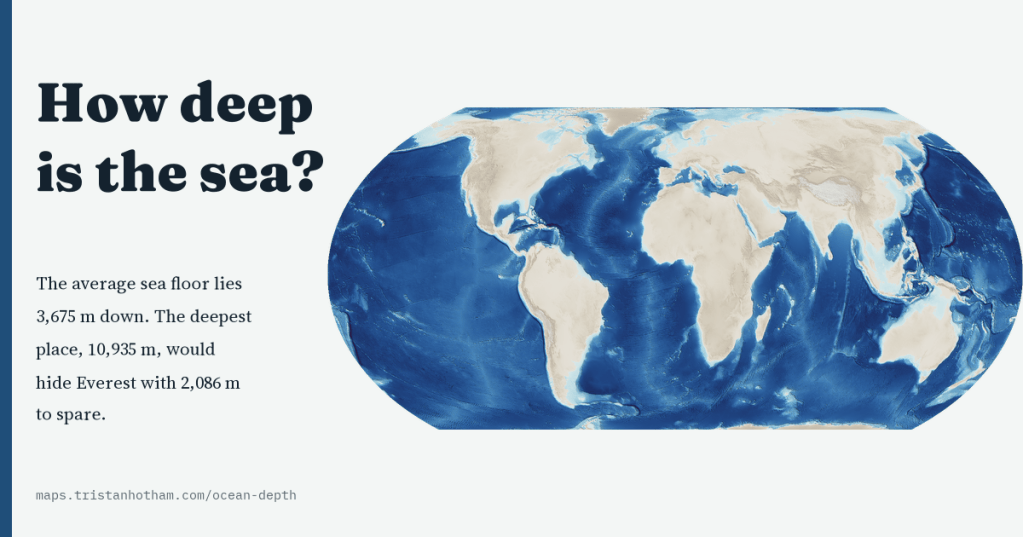
The average sea floor lies 3,675 m down, and the deepest place on Earth is deep enough to hide Everest with 2,086 m to spare. I made a map of the floor of the whole ocean, sharp from ocean basins down to single seamounts, to see how deep the sea really is, and how little of it anyone has actually measured.
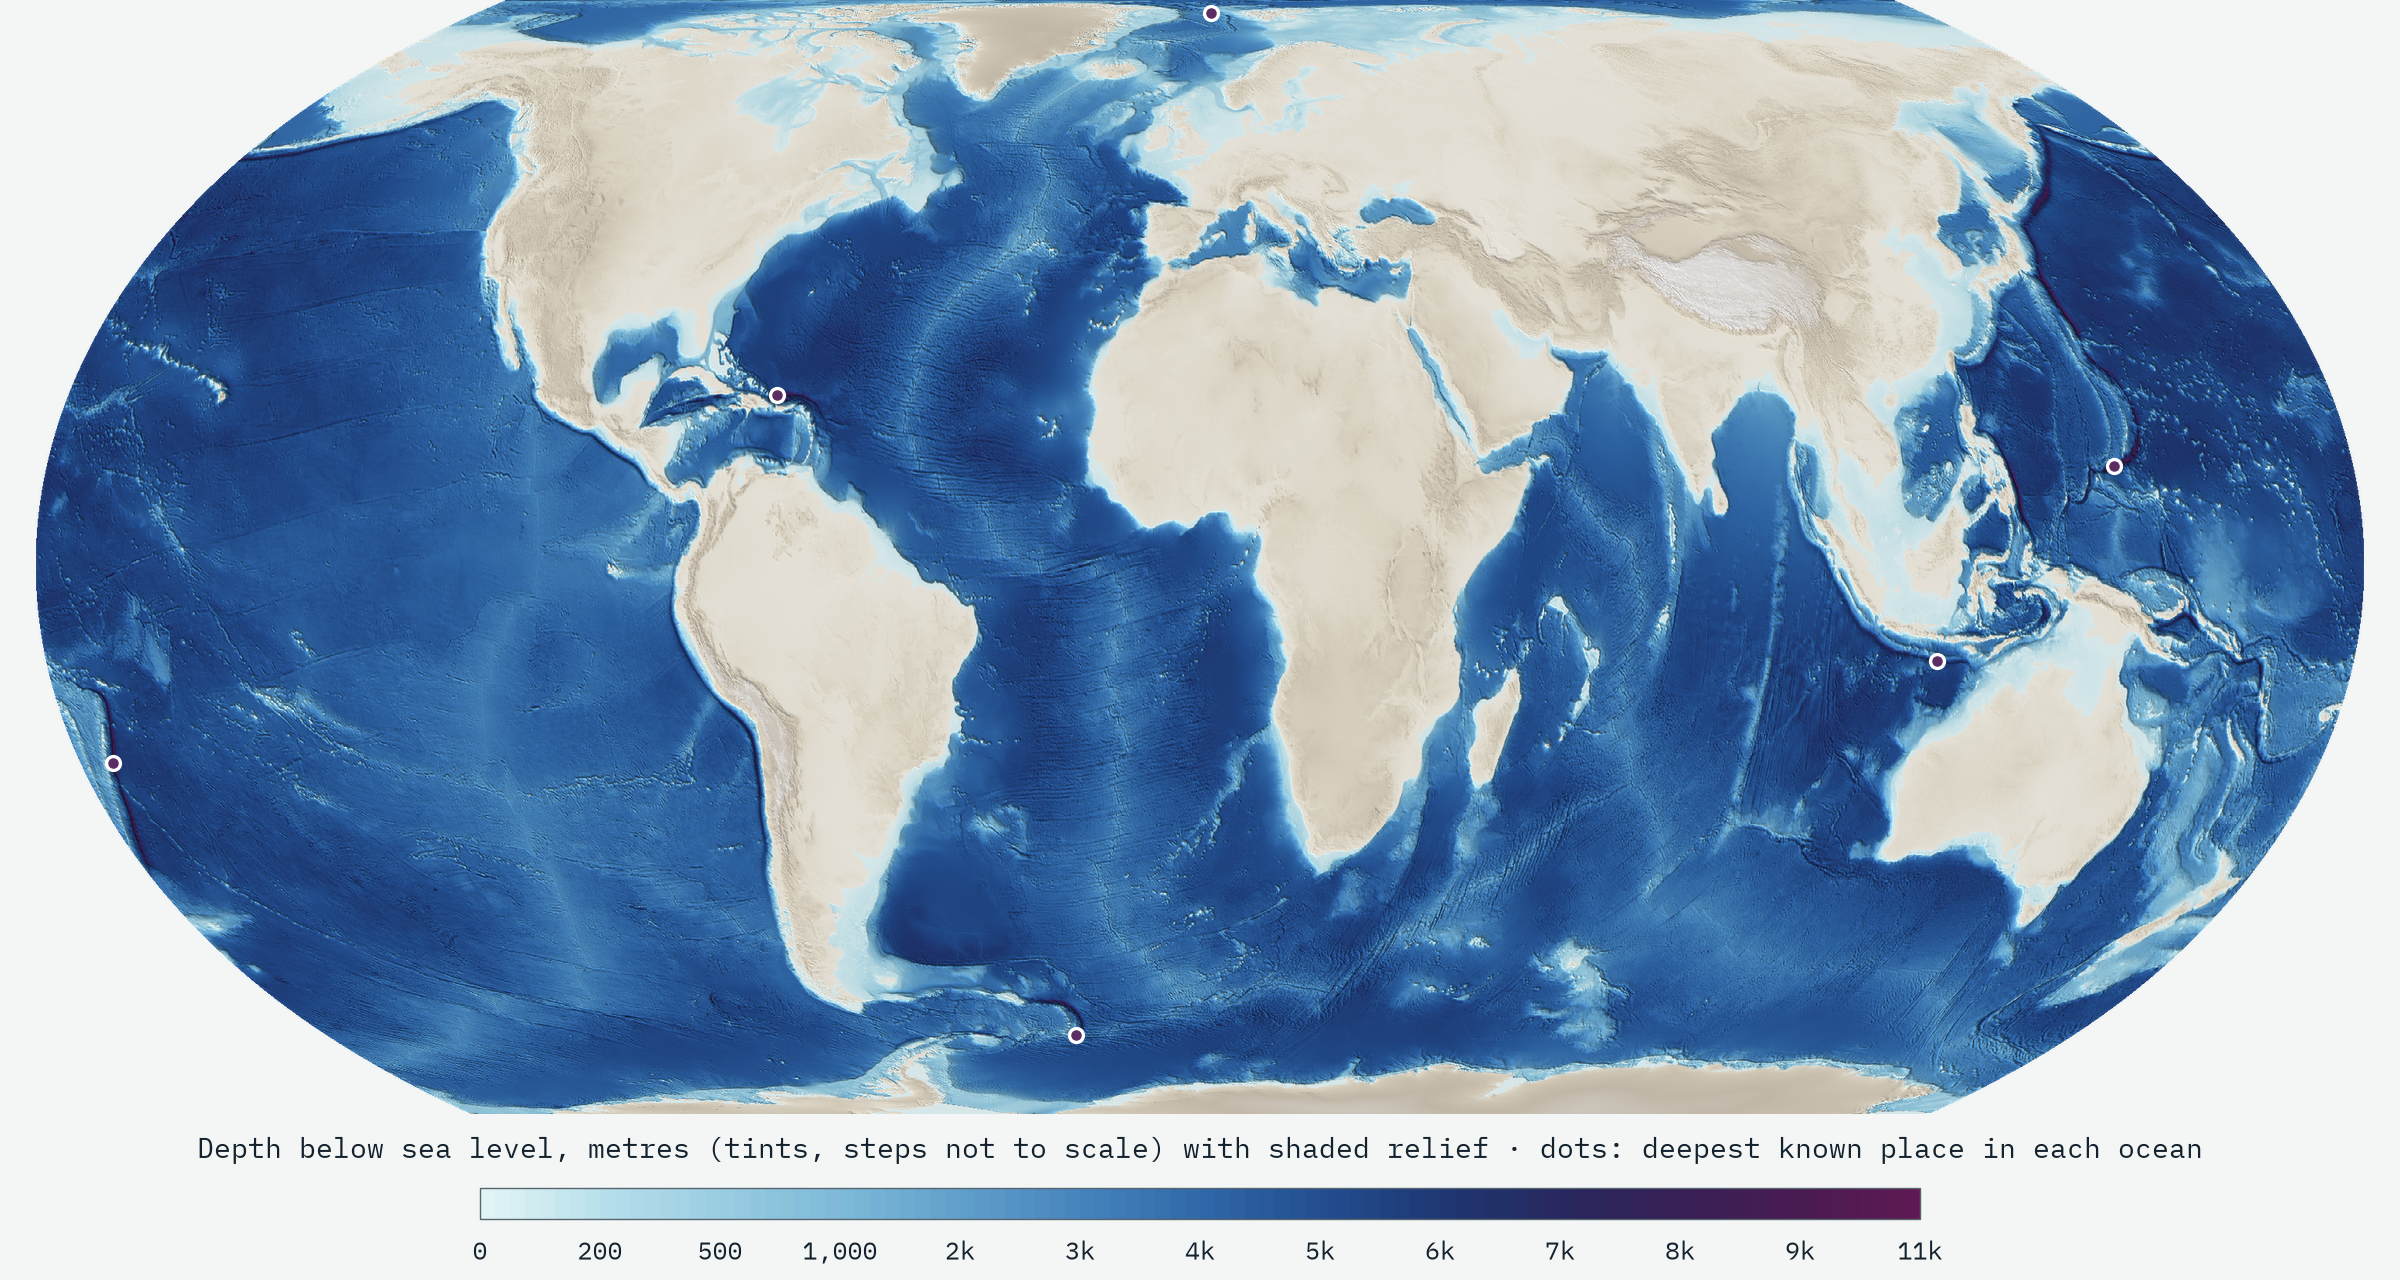
After mapping how high the world’s land is, I wanted to turn the same question upside down. Two thirds of the planet is under water, and the landscape down there is stranger than anything on land: plains of mud kilometres deep, a volcanic ridge that runs round the globe like the seam on a tennis ball, and trenches deep enough to swallow mountain ranges. Most maps paint it a flat, comforting blue.
The same open terrain tiles I used for the land, first built by Mapzen and now hosted by Amazon, carry the sea floor too, from the global ETOPO1, GEBCO and SRTM15+ compilations. Each tile is a picture whose colours are a code for height, negative under the sea. The interactive map decodes them in your browser and turns them into depth tints and shaded relief at every zoom, and tells you the depth of any spot you click.
Most of the sea is deep
To measure the sea I used the tiles at their coarsest level, a world grid of cells about 9.8 km across, weighting every cell by its true area on the globe. On that grid the sea covers 362.9 million km², 71.2% of the Earth. Its average depth is 3,675 m, and half of the sea floor is deeper than 4,089 m. Fill it in and you would need 1.33 billion cubic kilometres of water, close to what oceanographers have calculated from finer data.
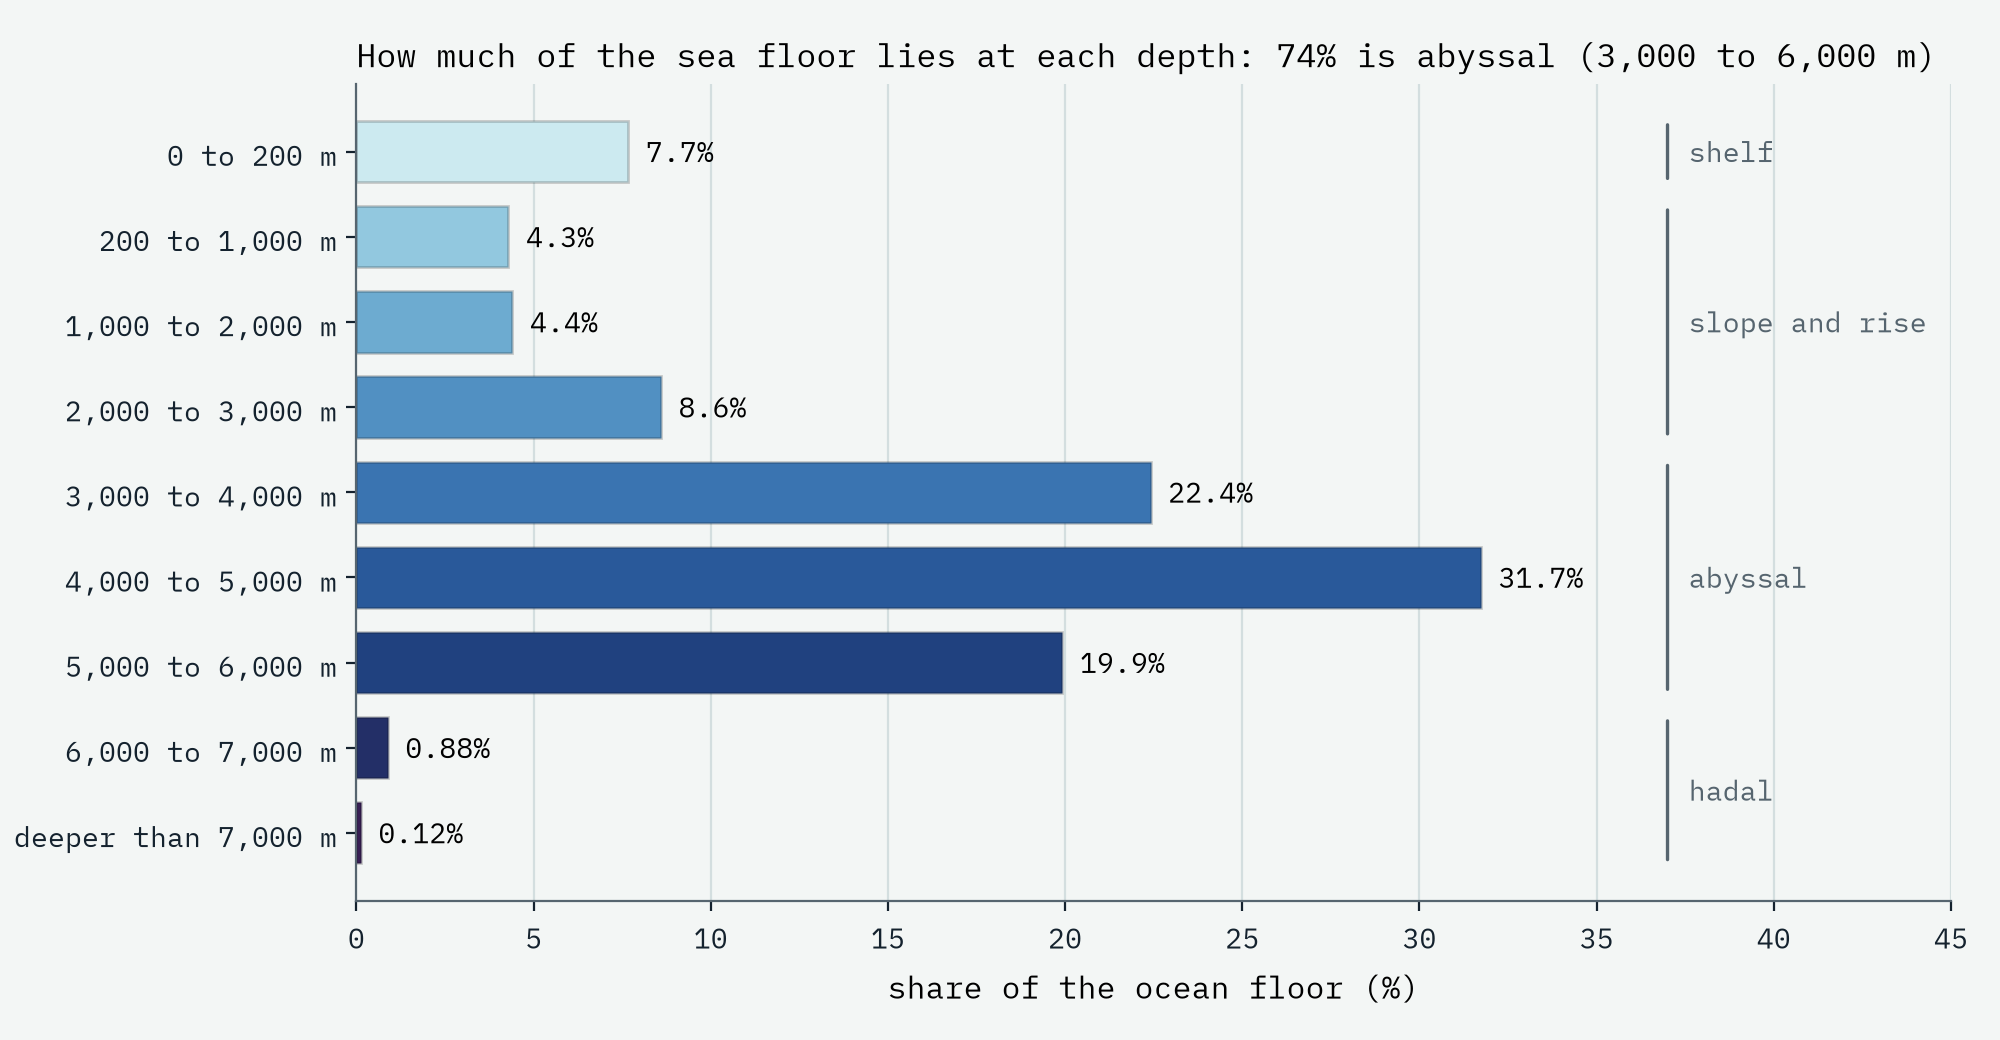
The shallow seas we know, the shelves round the continents less than 200 m deep, where almost all fishing, oil rigs and wind farms are, cover only 7.7% of the sea floor. The continental slopes and the shallower ridges between 200 and 3,000 m take 17%. Then come the abyssal plains and hills between 3,000 and 6,000 m: 74% of the sea floor, and more than half of the surface of the whole planet. Pick a spot on Earth at random and the odds are better than one in five that it lies 4 to 5 km under water.
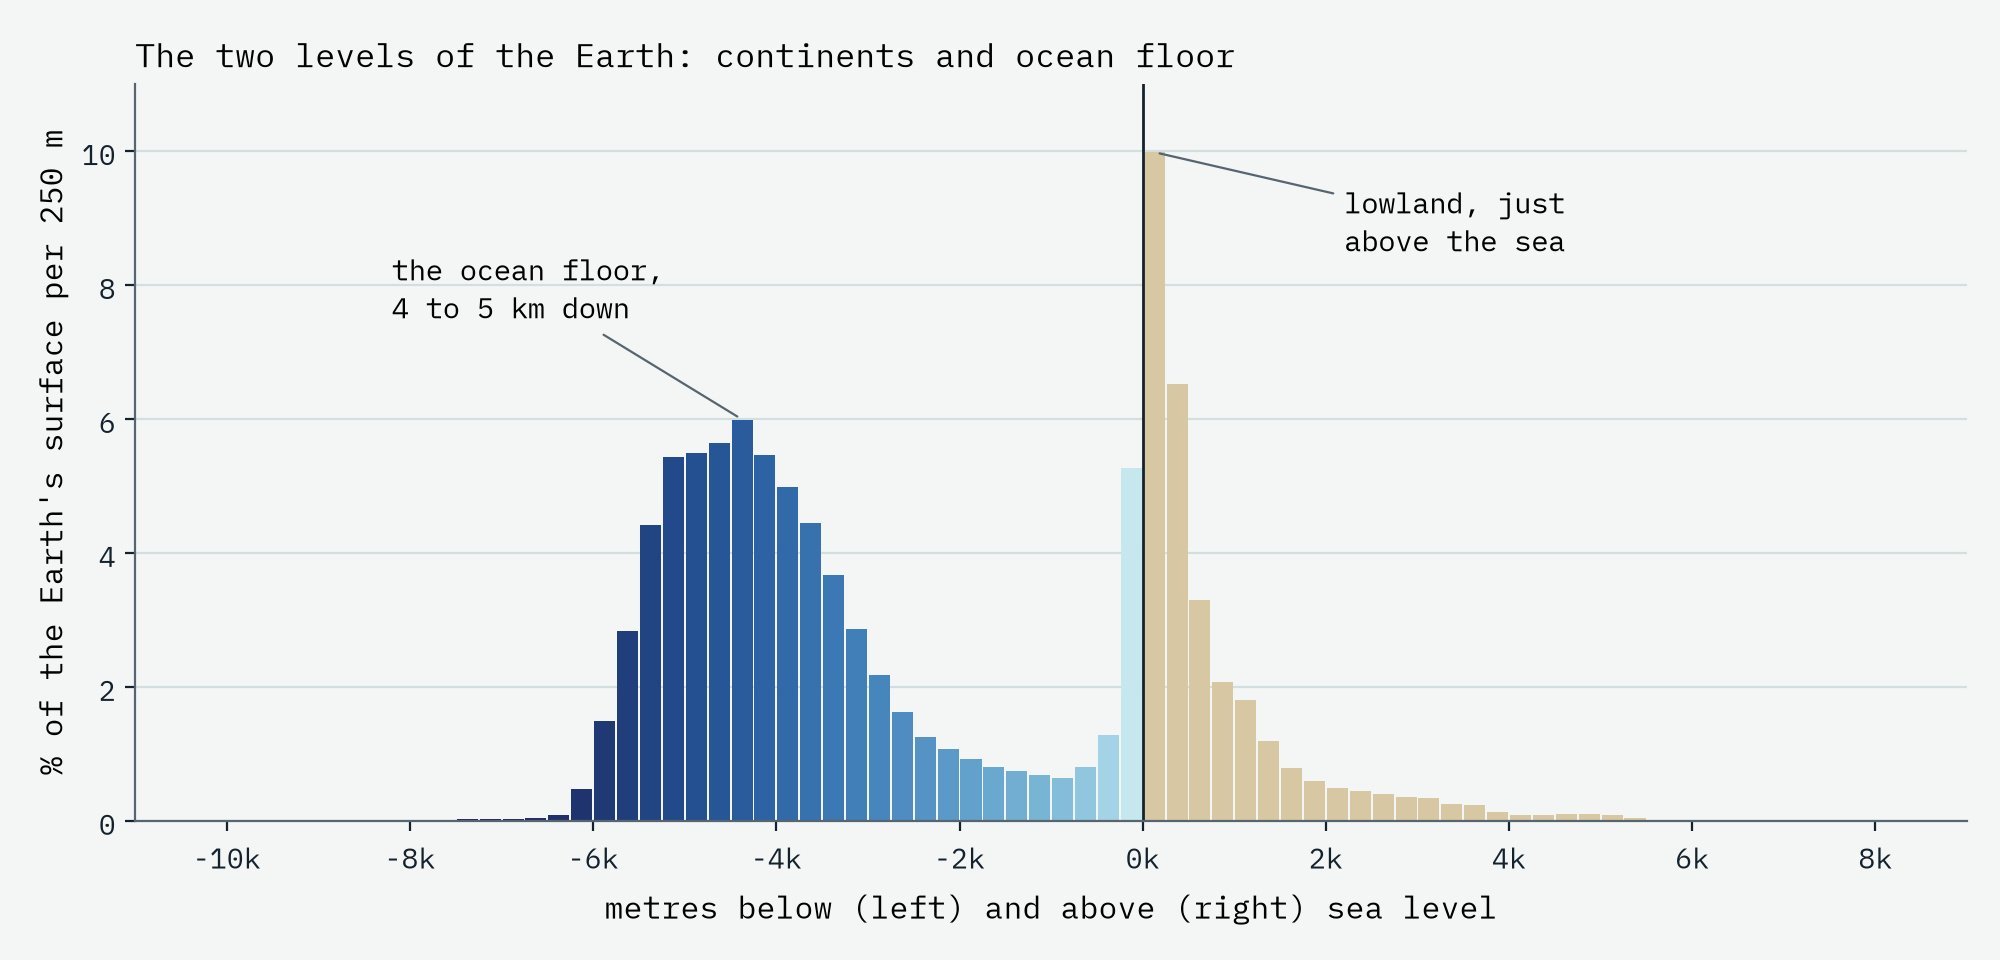
Put the land and the sea together and the Earth turns out to have two levels, not one. A chart of every height and depth has two humps: one just above sea level, and a bigger one around 4,000 to 5,000 m down. They are two different kinds of crust: thick, light continents floating high, and thin, dense ocean floor riding low. The average sea floor lies 4.6 times deeper than the average land stands high.
Five oceans
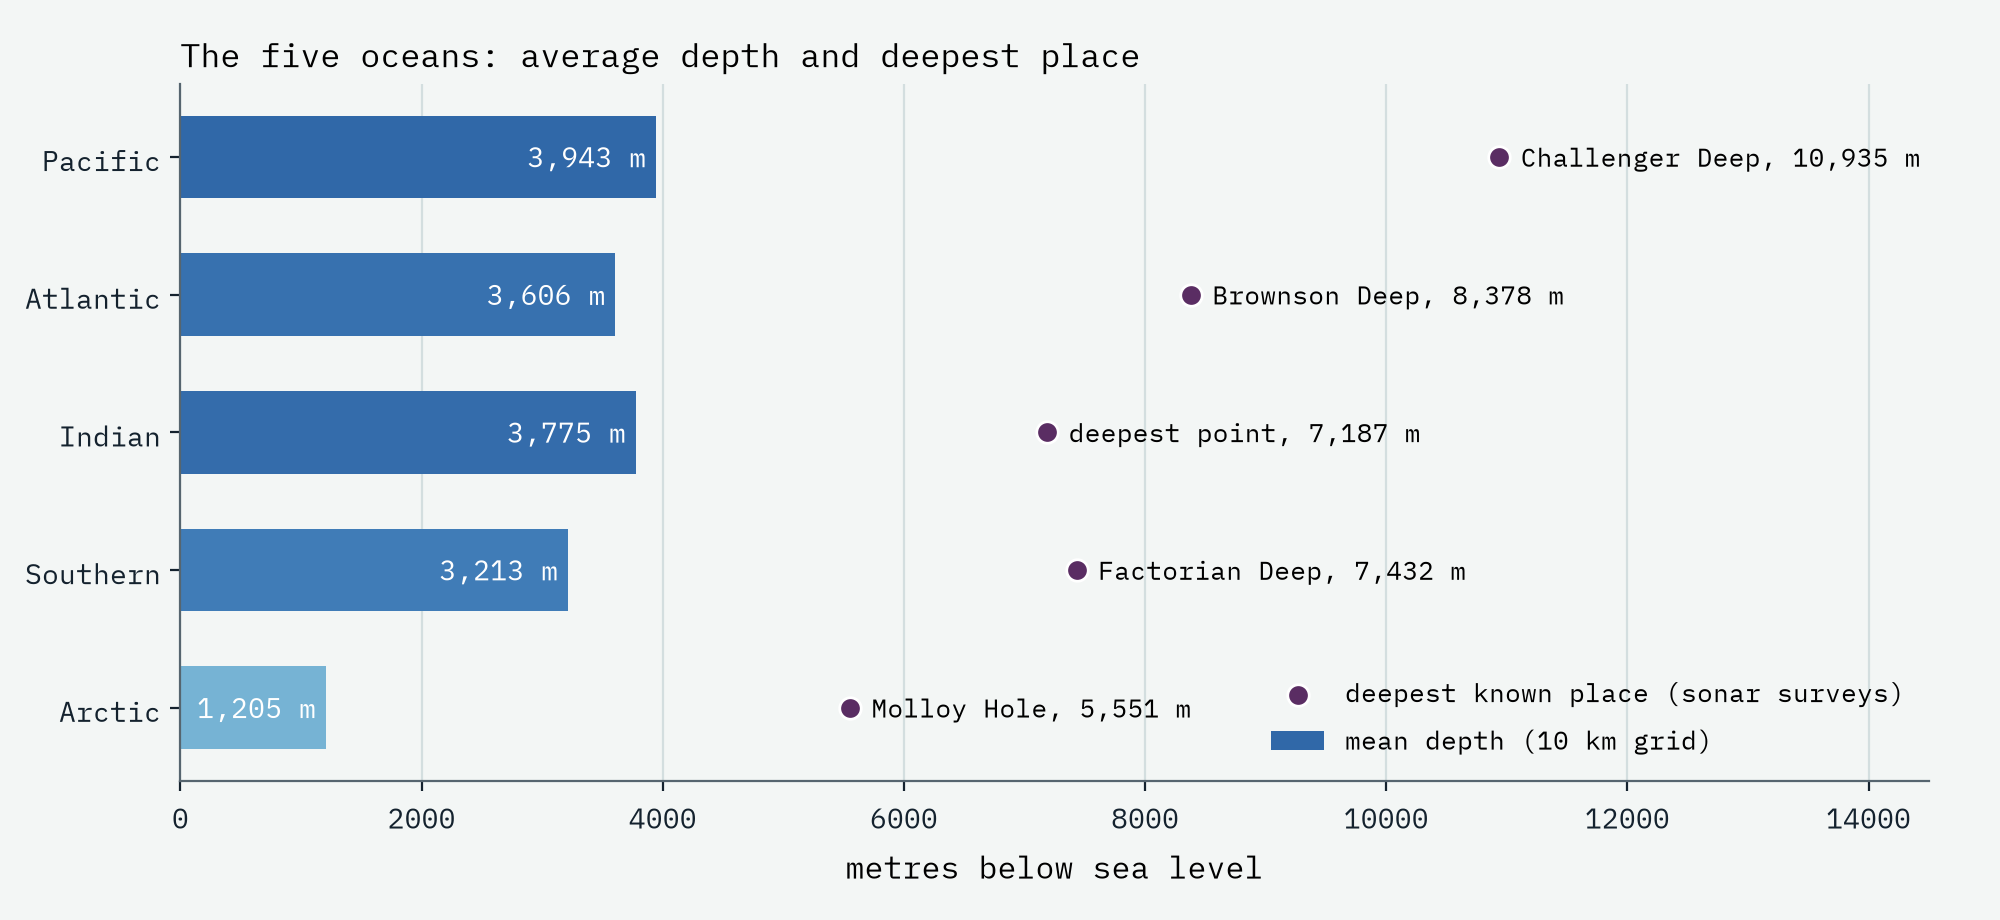
Grouping the International Hydrographic Organization’s sea areas into five oceans, the Pacific is both the biggest, with 47% of all the sea, and the deepest, averaging 3,943 m. The Indian Ocean averages 3,775 m, the Atlantic 3,606 m and the Southern Ocean 3,213 m. The Arctic is a different kind of sea, averaging just 1,205 m because two fifths of it is shallow shelf, much of it off Siberia. Closer to home, the North Sea averages a mere 76 m and the Irish Sea 44 m.
Everest in the Mariana Trench
The deepest places are trenches, long narrow gashes where one plate of ocean floor bends down beneath another. The deepest of all is the Challenger Deep, at the southern end of the Mariana Trench south-west of Guam. The best measurement, from pressure sensors on crewed submersible dives in 2021, puts it at 10,935 m, give or take 6 m. Stand Mount Everest on the bottom and its summit would still be 2,086 m under water.
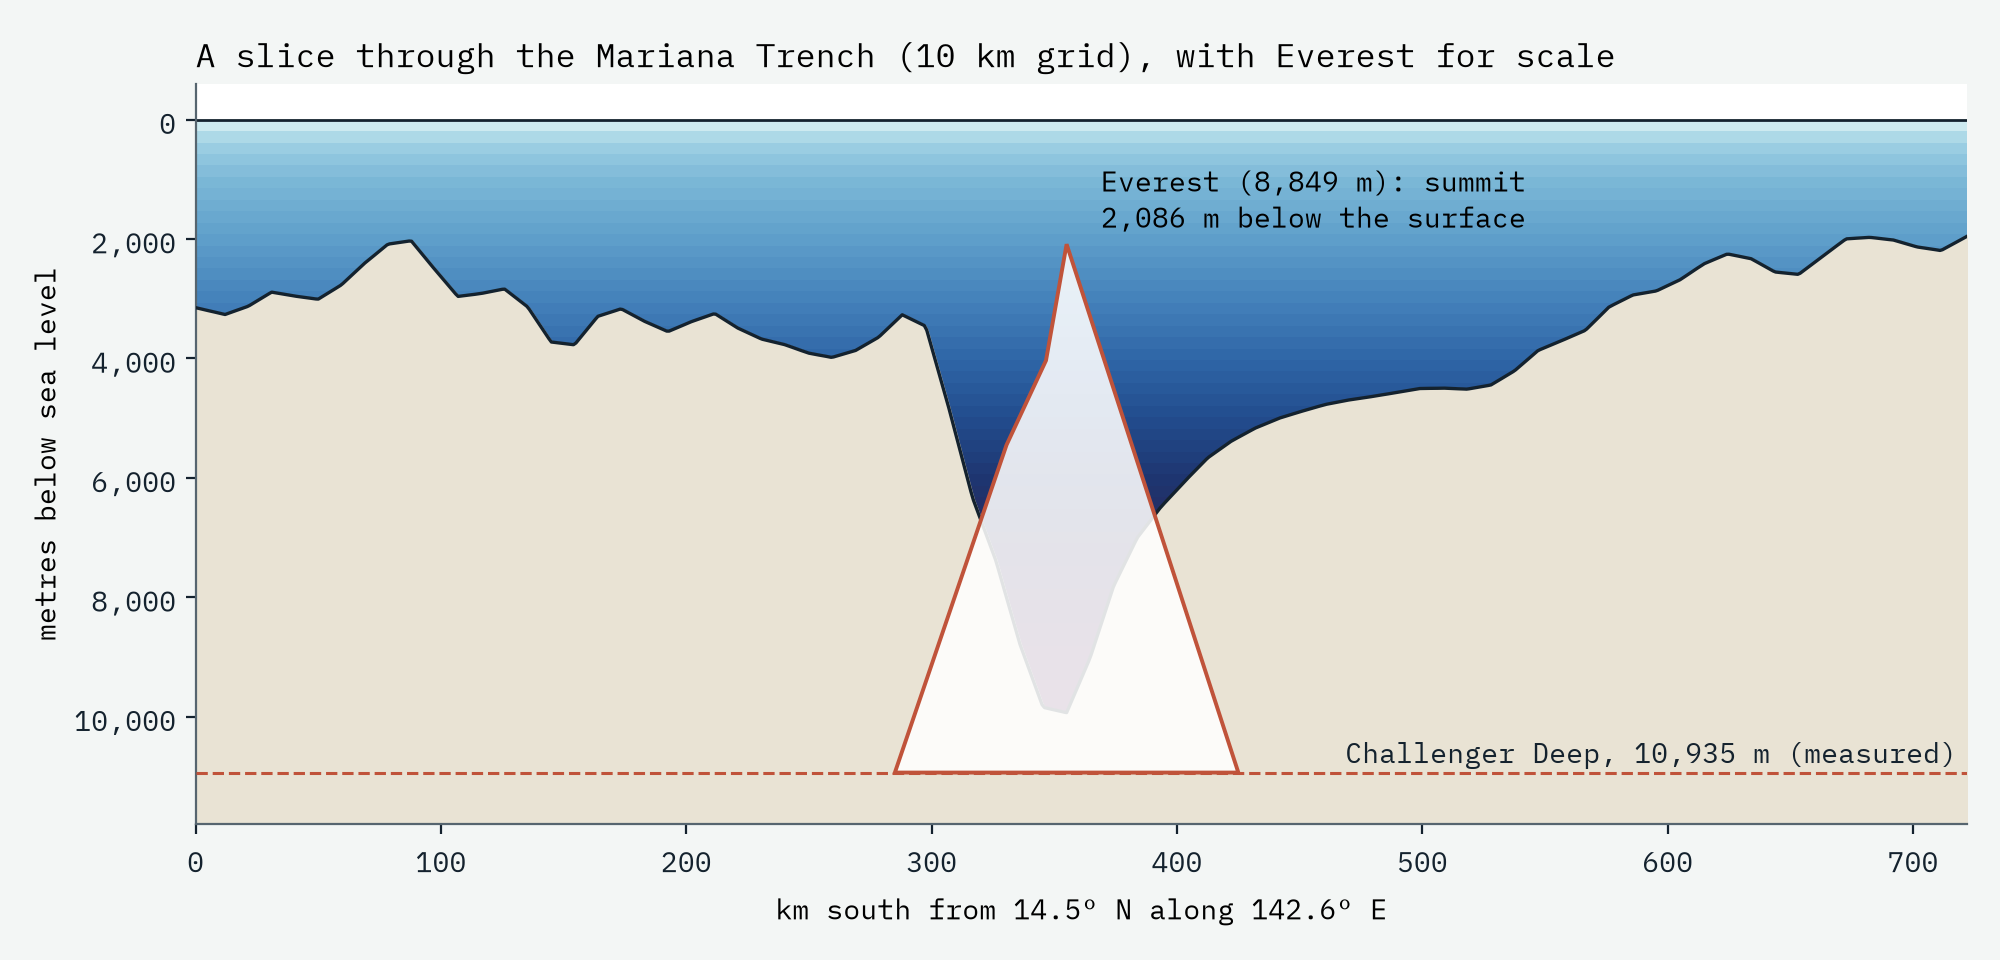
Stand Everest in the Challenger Deep and its summit would still be 2,086 m under water.
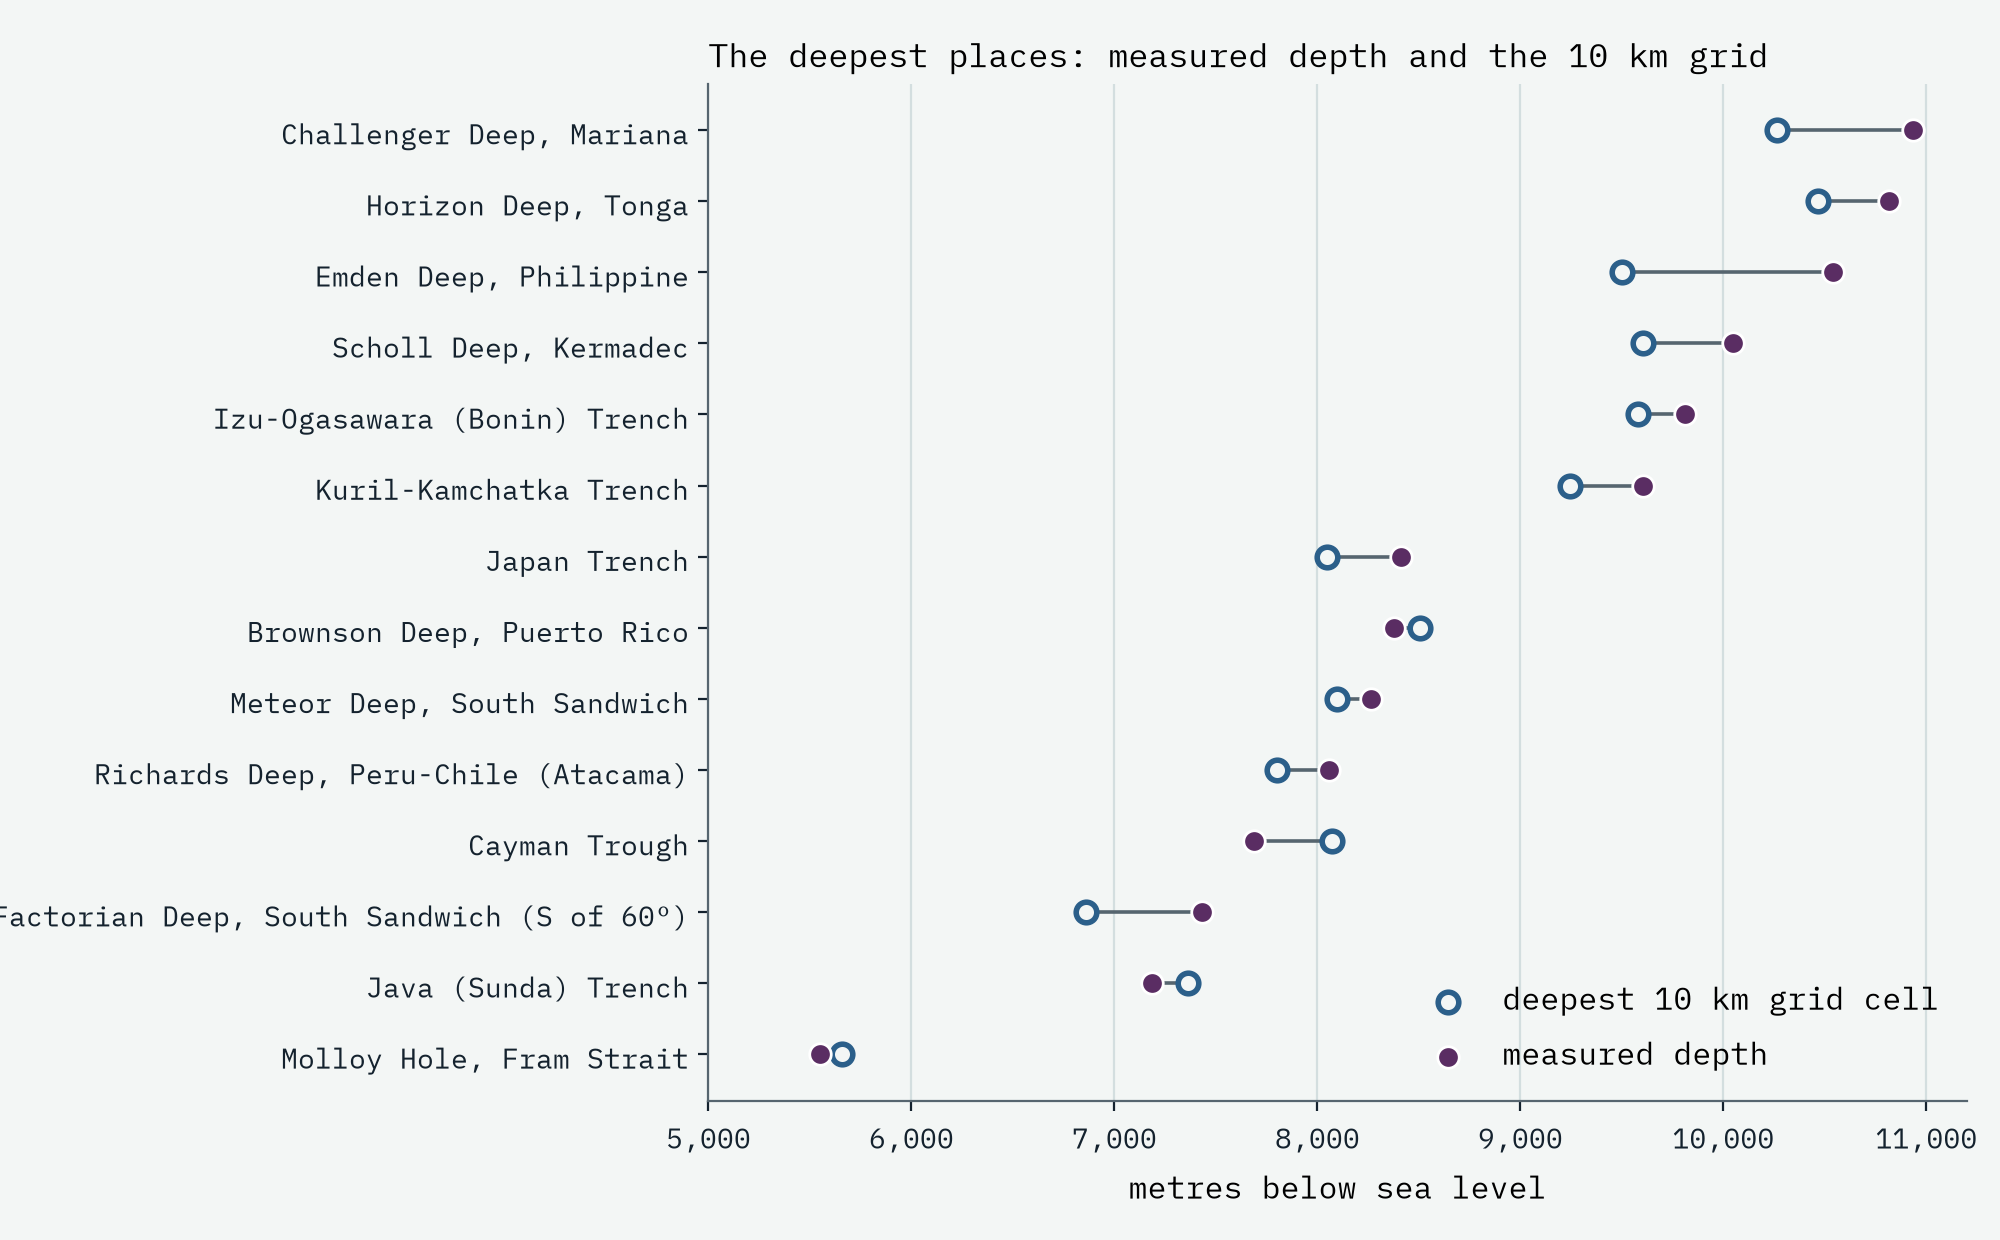
Here the coarse grid shows its limits, which I think is one of the most interesting things in the data. A 10 km cell averages over a trench floor only a few kilometres wide, so the grid’s deepest Mariana cell is 10,264 m, 671 m short of the truth. Its deepest cell anywhere is in the Tonga Trench instead (10,467 m). And in 4 of the 14 deep places I checked, including the Puerto Rico Trench, the grid is deeper than anything that has been measured there, which an average should never be: those cells carry errors from old soundings or satellite estimates. The global maps of the sea floor are smoother and less certain than they look.
Whose sea floor?
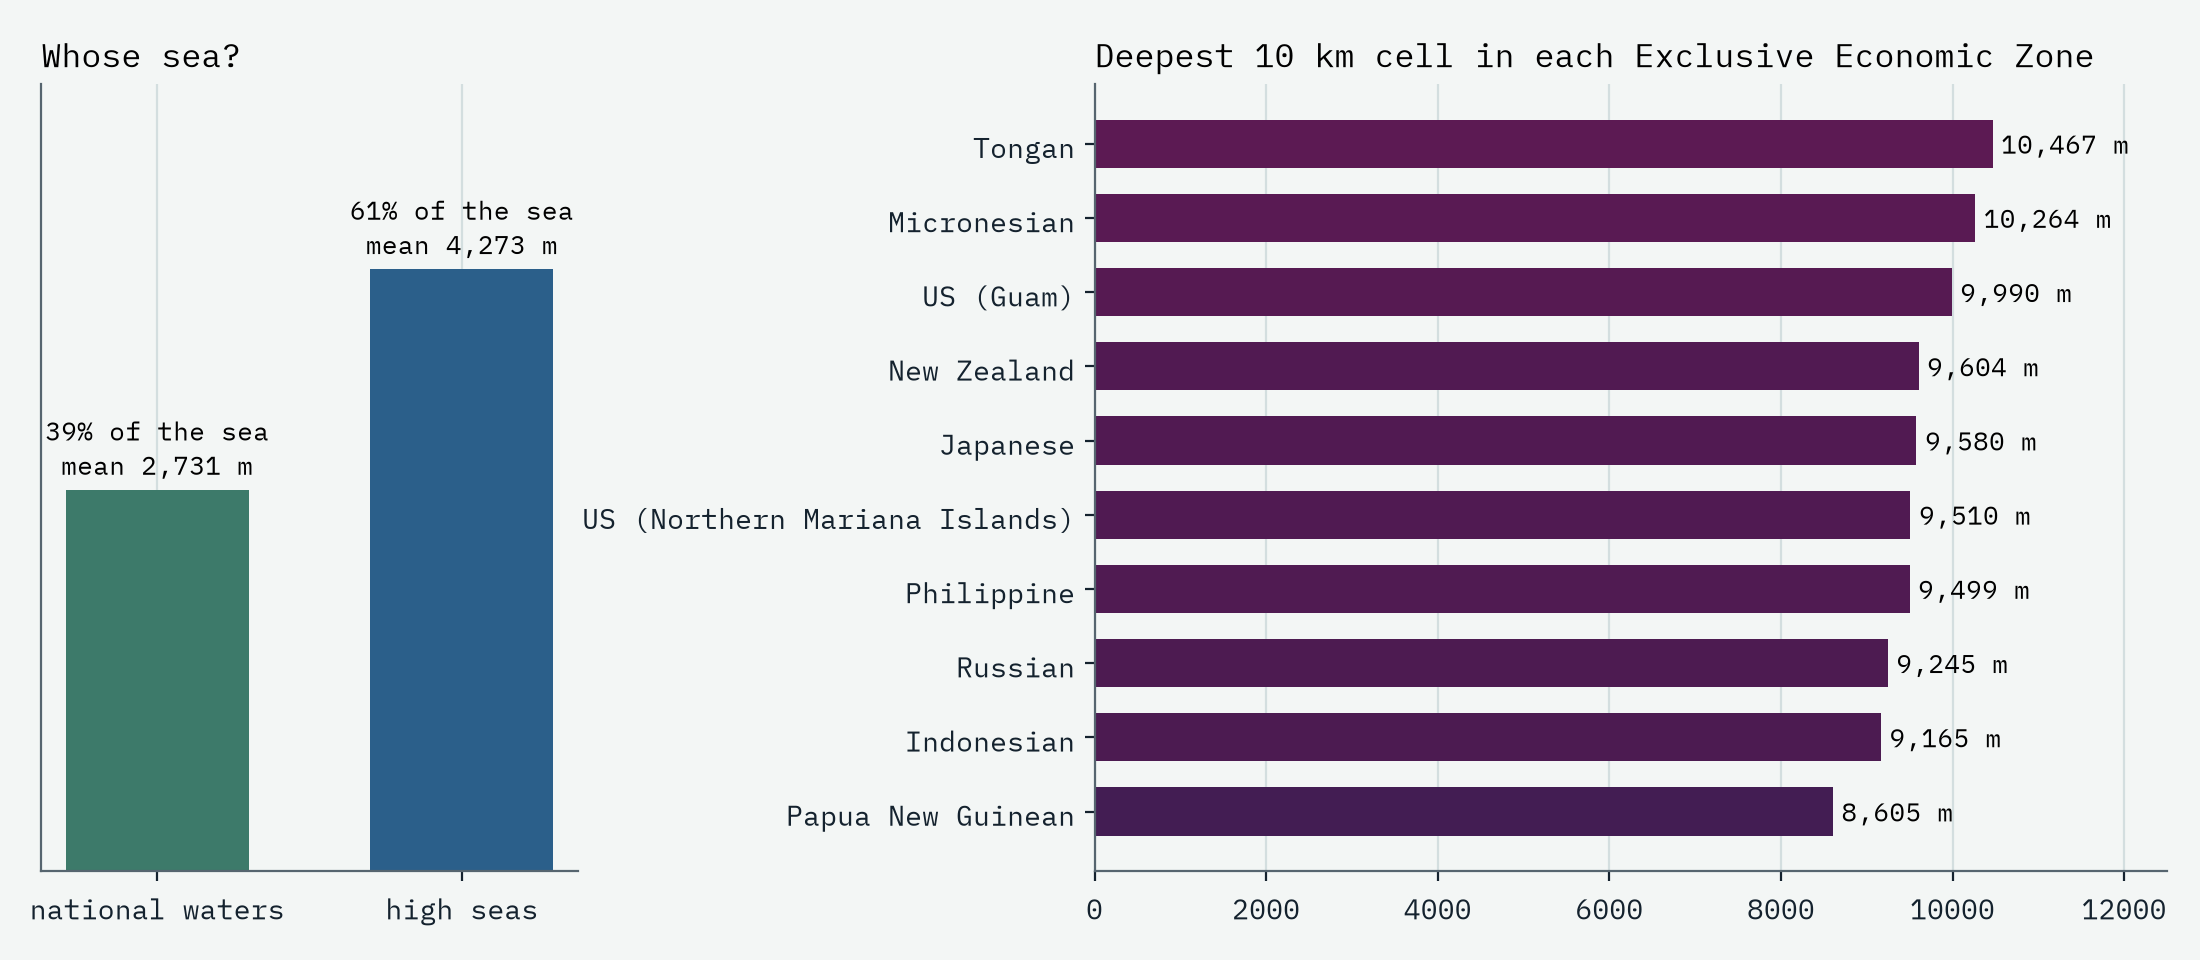
Coastal states claim waters up to 200 nautical miles out. Using the Marine Regions boundaries, those national waters cover 39% of the sea and the high seas 61%. National waters are shallower on average, because they hold the shelves, but the trenches hug island arcs, so 37% of the sea floor deeper than 6,000 m is in someone’s zone. The Challenger Deep itself lies in the waters of the Federated States of Micronesia, just south of those of the United States territory of Guam.
Mostly unmapped
All of this rests on a sea floor that is mostly estimated rather than measured. Satellites measure the height of the sea surface, which bulges by a few metres over a seamount and sags over a trench, and models turn those bumps into depths, sharp only to ten kilometres or so. Proper maps need ships with sonar sweeping the floor a strip at a time. The Seabed 2030 project reported in 2026 that 28.7% of the ocean floor is now mapped to modern standards. That leaves about 259 million km² known only roughly, more than all the land on Earth. The gazetteer of undersea names lists 2,000 named seamounts; satellite gravity suggests there are at least 9.7 times as many big ones, and far more small ones, that nobody has named or surveyed.
How I did this
The statistics use the zoom 4 level of the AWS Terrain Tiles, a 4,096 by 4,096 grid in the Web Mercator projection, with every cell weighted by its true area and by the share of it that is sea. Sea is everything outside Natural Earth’s land and lakes that joins the world ocean (so the Caspian is out and the Black Sea in), the Arctic north of 85 degrees comes from ETOPO10, and the sea under Antarctica’s floating ice shelves is missing. Oceans are the IHO sea areas grouped into five; national waters, sea names and undersea feature names come from Marine Regions; the depths of the deepest places come from published surveys. The interactive map draws the same tiles live at every zoom, with depth tints, shading, depth bands, trenches, named seamounts, national waters and a readout of any point. The numbers are smoothed to about 10 km, so they understate trenches and seamounts; the paper sets out every step and caveat.
Notes and sources
- AWS Terrain Tiles (Mapzen, Terrarium format); under the sea they use ETOPO1 (NOAA), GEBCO and SRTM15+ (Scripps Institution of Oceanography); full sources and terms. ETOPO10, derived from ETOPO1, for the Arctic north of 85 degrees.
- Marine Regions (Flanders Marine Institute, VLIZ): IHO sea areas, Exclusive Economic Zones and the gazetteer of undersea feature names. CC BY 4.0, via the CatalogueOfLife col-gazetteers package.
- Natural Earth land, lakes, countries, places, marine names and bathymetry polygons. Public domain.
- Depths of the deepest places: Greenaway and others (2021), Progress in Oceanography; Bongiovanni, Stewart and Jamieson (2022), Geoscience Data Journal; Stewart and Jamieson (2019), Earth-Science Reviews; English Wikipedia, Oceanic trench (CC BY-SA 4.0).
- Mapping progress: Seabed 2030 and GEBCO, release of the GEBCO_2026 grid (2026). Ocean volume: Charette and Smith (2010), Oceanography. Seamount census: Kim and Wessel (2011), Geophysical Journal International.
- I wrote the text, with drafting and editing assistance from Claude (Anthropic), which also helped prepare the analysis code. I reviewed and checked all text and results.

