
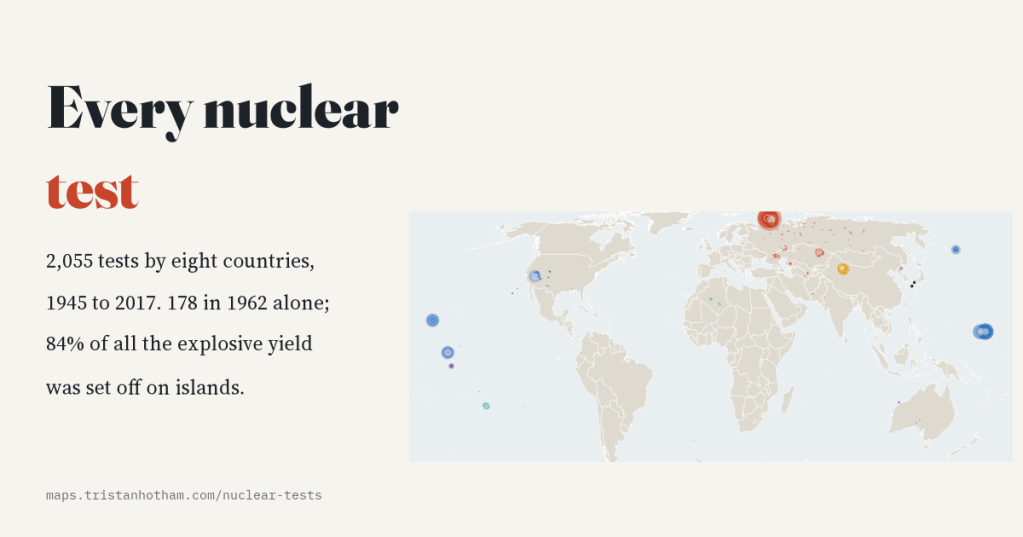
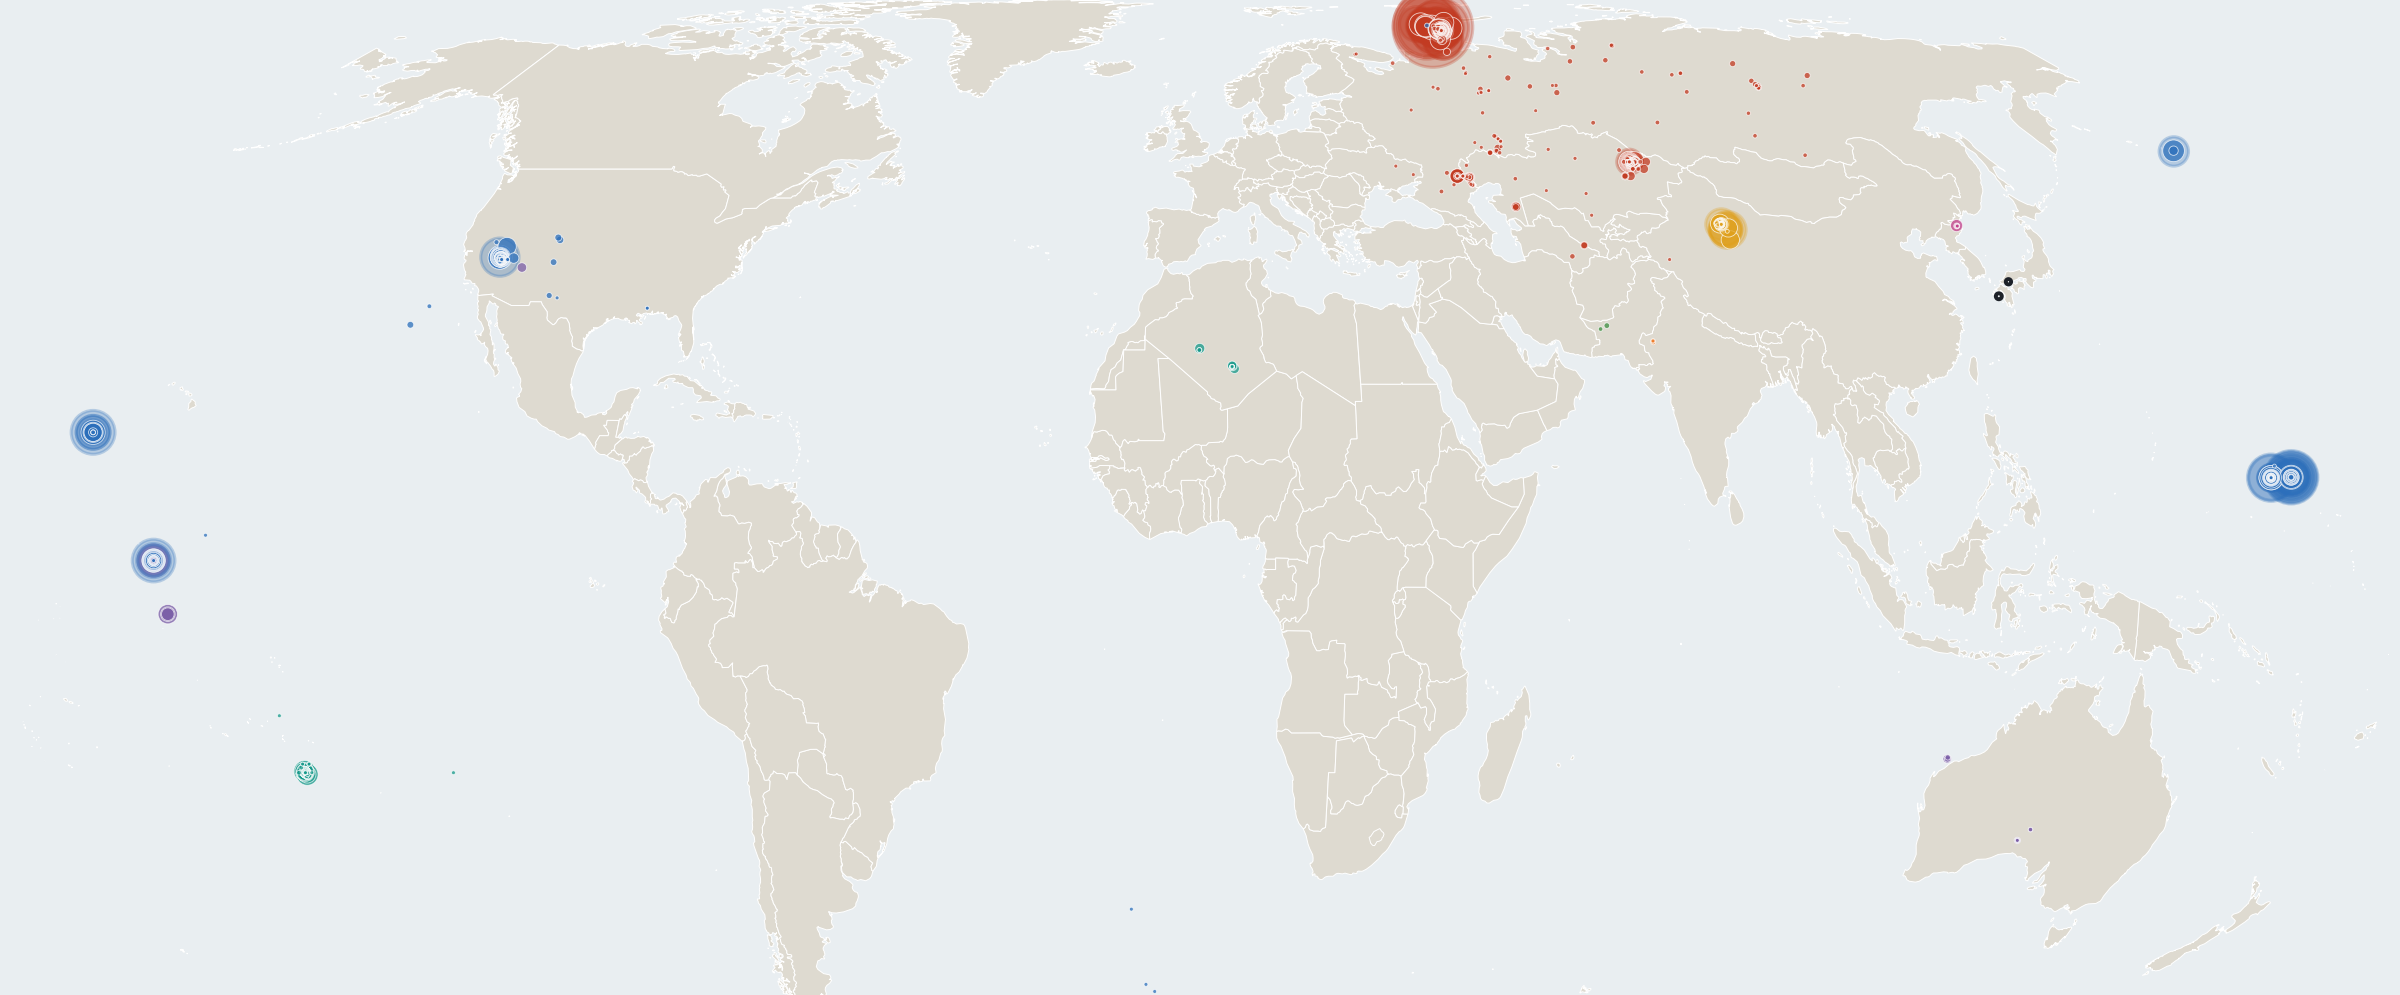
Since the Trinity test in July 1945, eight countries have set off 2,055 nuclear test explosions. I put every one of them on a map: where it was, who fired it, how big it was, and whose land or sea it was on. Most were small and underground. But most of the energy came from a few dozen enormous bombs, nearly all of them on remote islands.
Nuclear tests are strangely easy to forget. For most people they live in a handful of black and white films: a cloud rising over an atoll, a flash in the desert. But they were not rare events. In the busiest year there was one every two days.
In 2000 two Swedish researchers, Nils-Olov Bergkvist and Ragnhild Ferm, compiled a list of every known nuclear explosion from 1945 to 1998 for the Stockholm International Peace Research Institute: 2,051 of them, each with a date, a place, a method and an estimate of its size. I added North Korea’s six tests since 2006, set aside the two bombs dropped on Hiroshima and Nagasaki, which were not tests, and mapped the rest.
The race to 1962
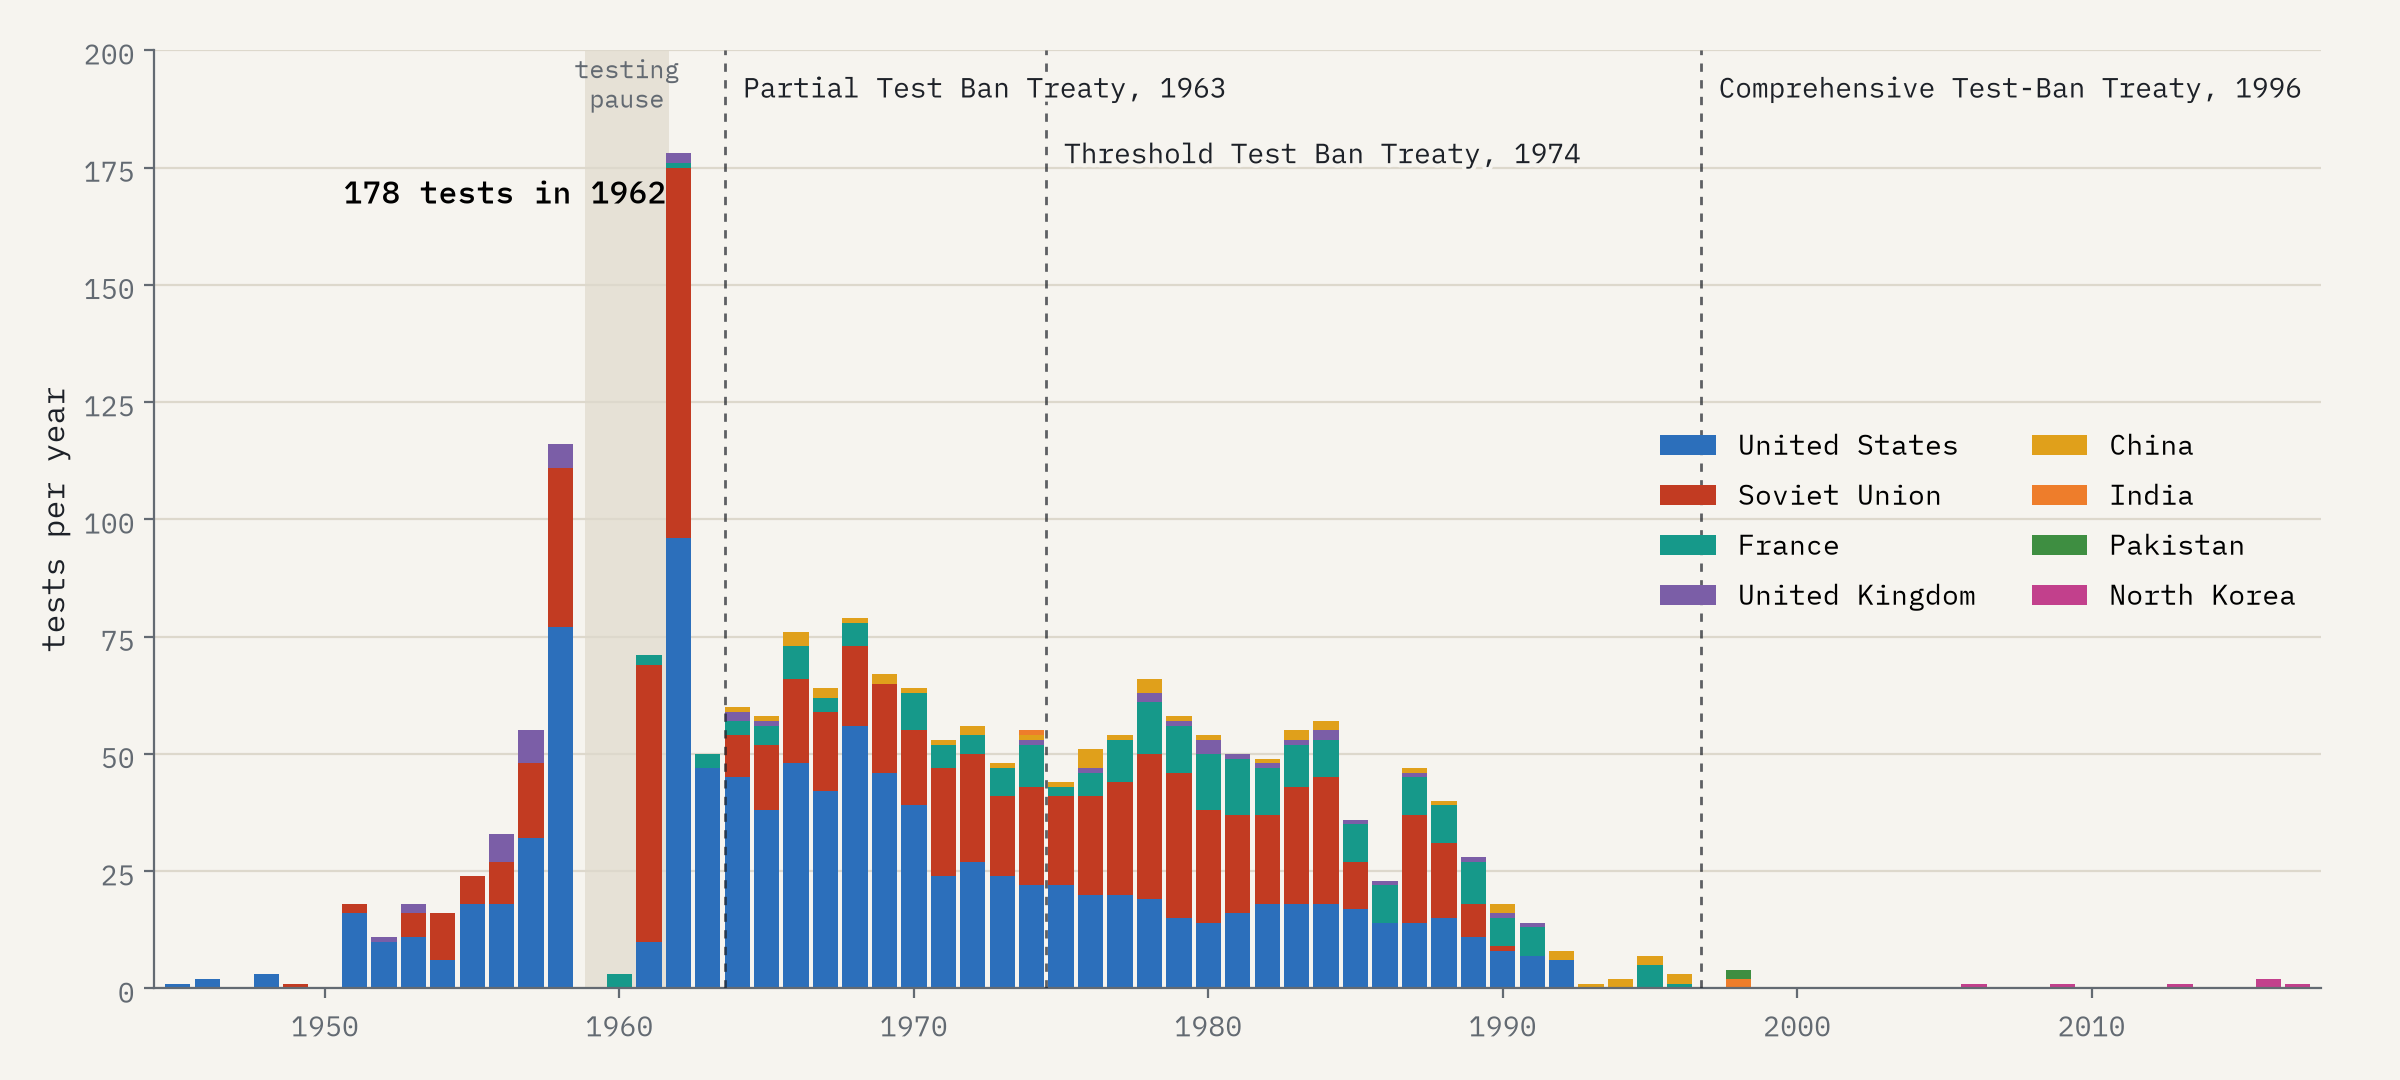
Testing built up through the 1950s as the Soviet Union and then Britain joined the United States. In 1958 there were 116 tests. Then the three paused, and for almost three years only France tested. When the Soviet Union broke the pause in September 1961, both sides raced: in 1962 there were 178 tests, 96 American and 79 Soviet. The tests of 1961 and 1962 alone released 50% of all the explosive energy of every nuclear test ever made.
Into the ground
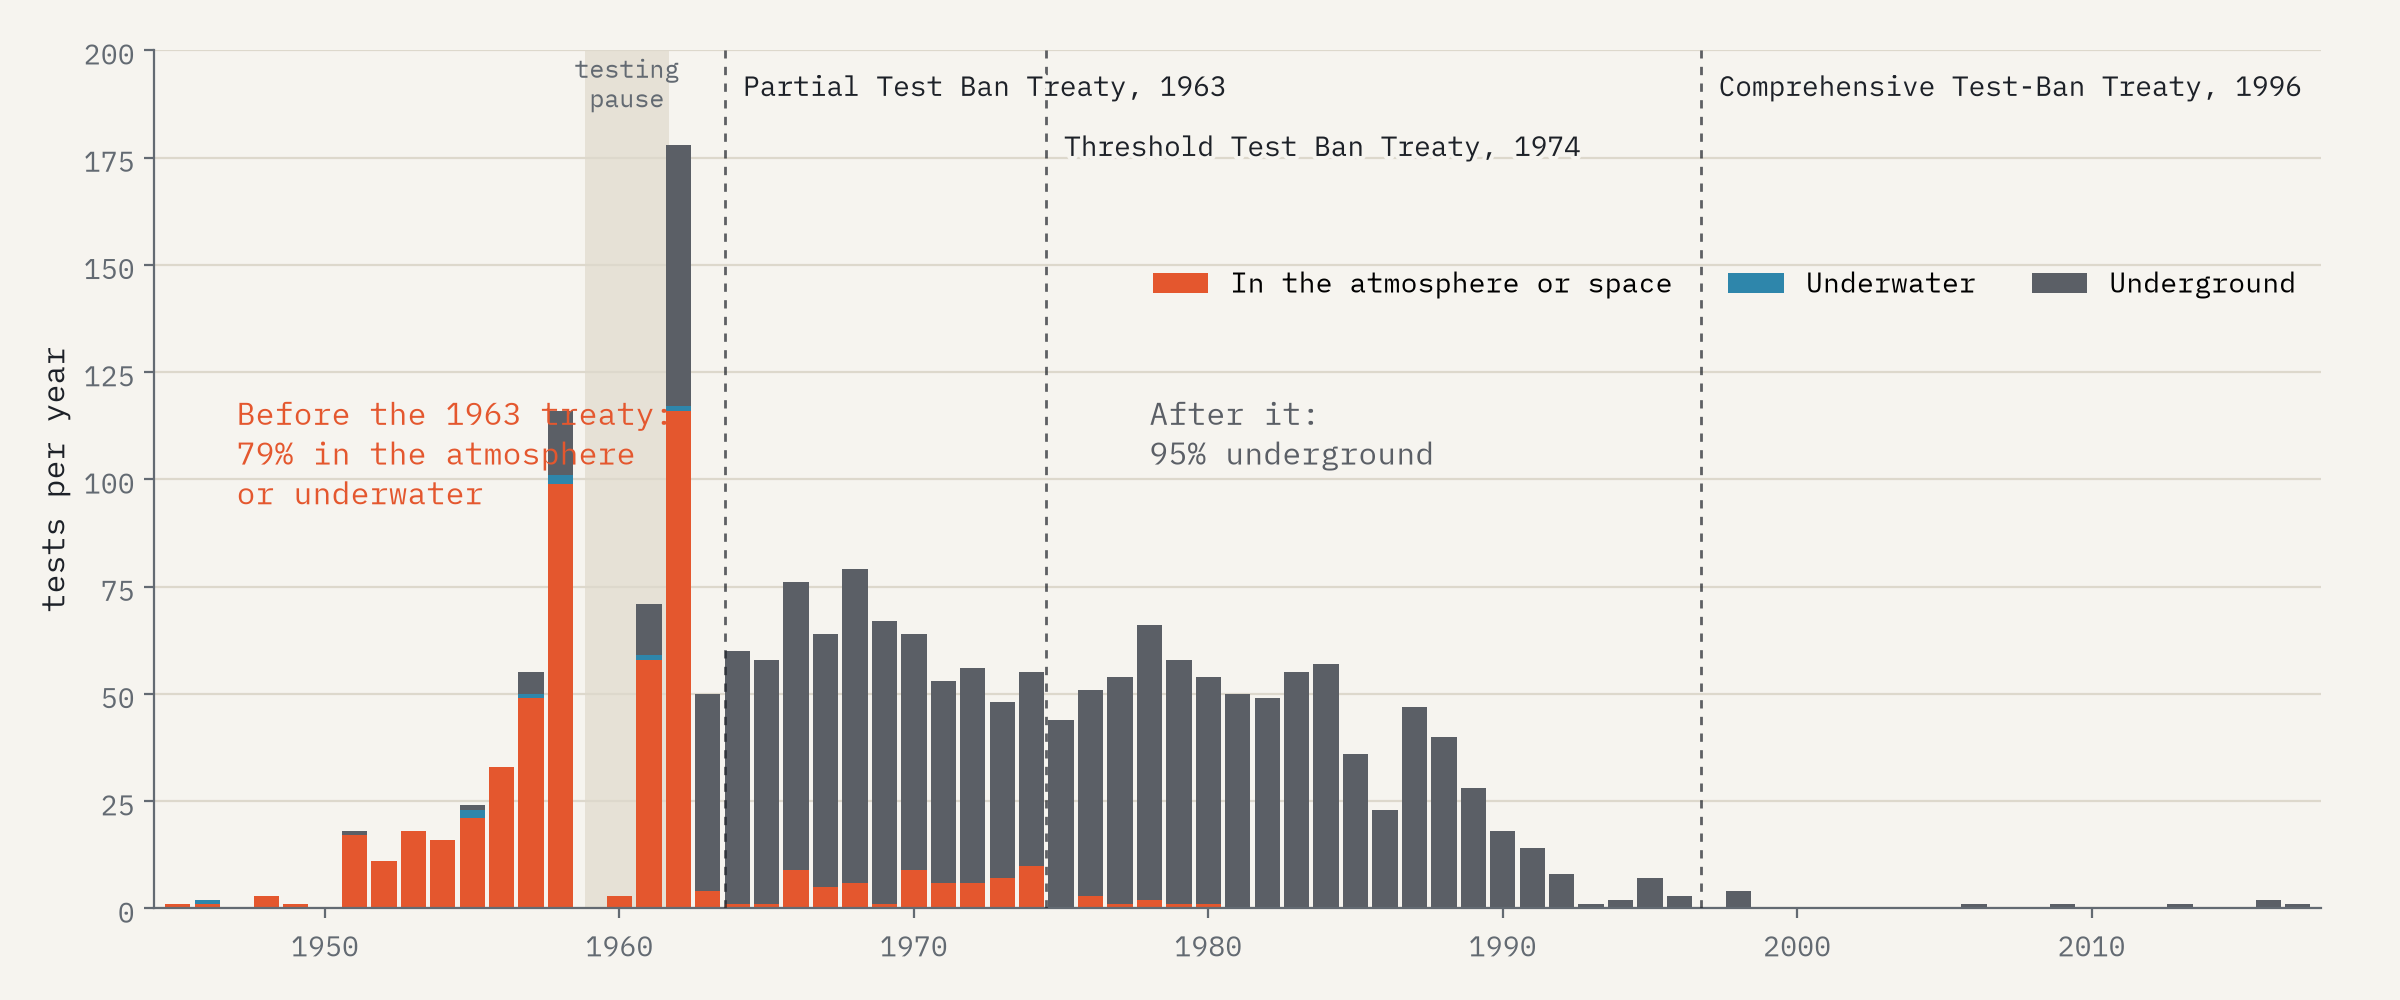
In August 1963 the United States, the Soviet Union and Britain signed the Partial Test Ban Treaty, banning tests in the atmosphere, in space and under water. It did not stop testing. It buried it. Before the treaty 79% of tests were in the open air or underwater; after it 95% were underground, and the pace hardly slowed, at about 49 tests a year until 1992. France and China, which did not sign, kept testing in the atmosphere until 1974 and 1980.
How big
Add up the yields and the 2,055 tests released about 546 megatons, the equivalent of 546 million tonnes of TNT (somewhere between 429 and 664, because many yields are only estimates). But that total is lopsided. The typical test was about 10 kilotons, smaller than the Hiroshima bomb. The 85 tests of a megaton or more make up 80% of the total.
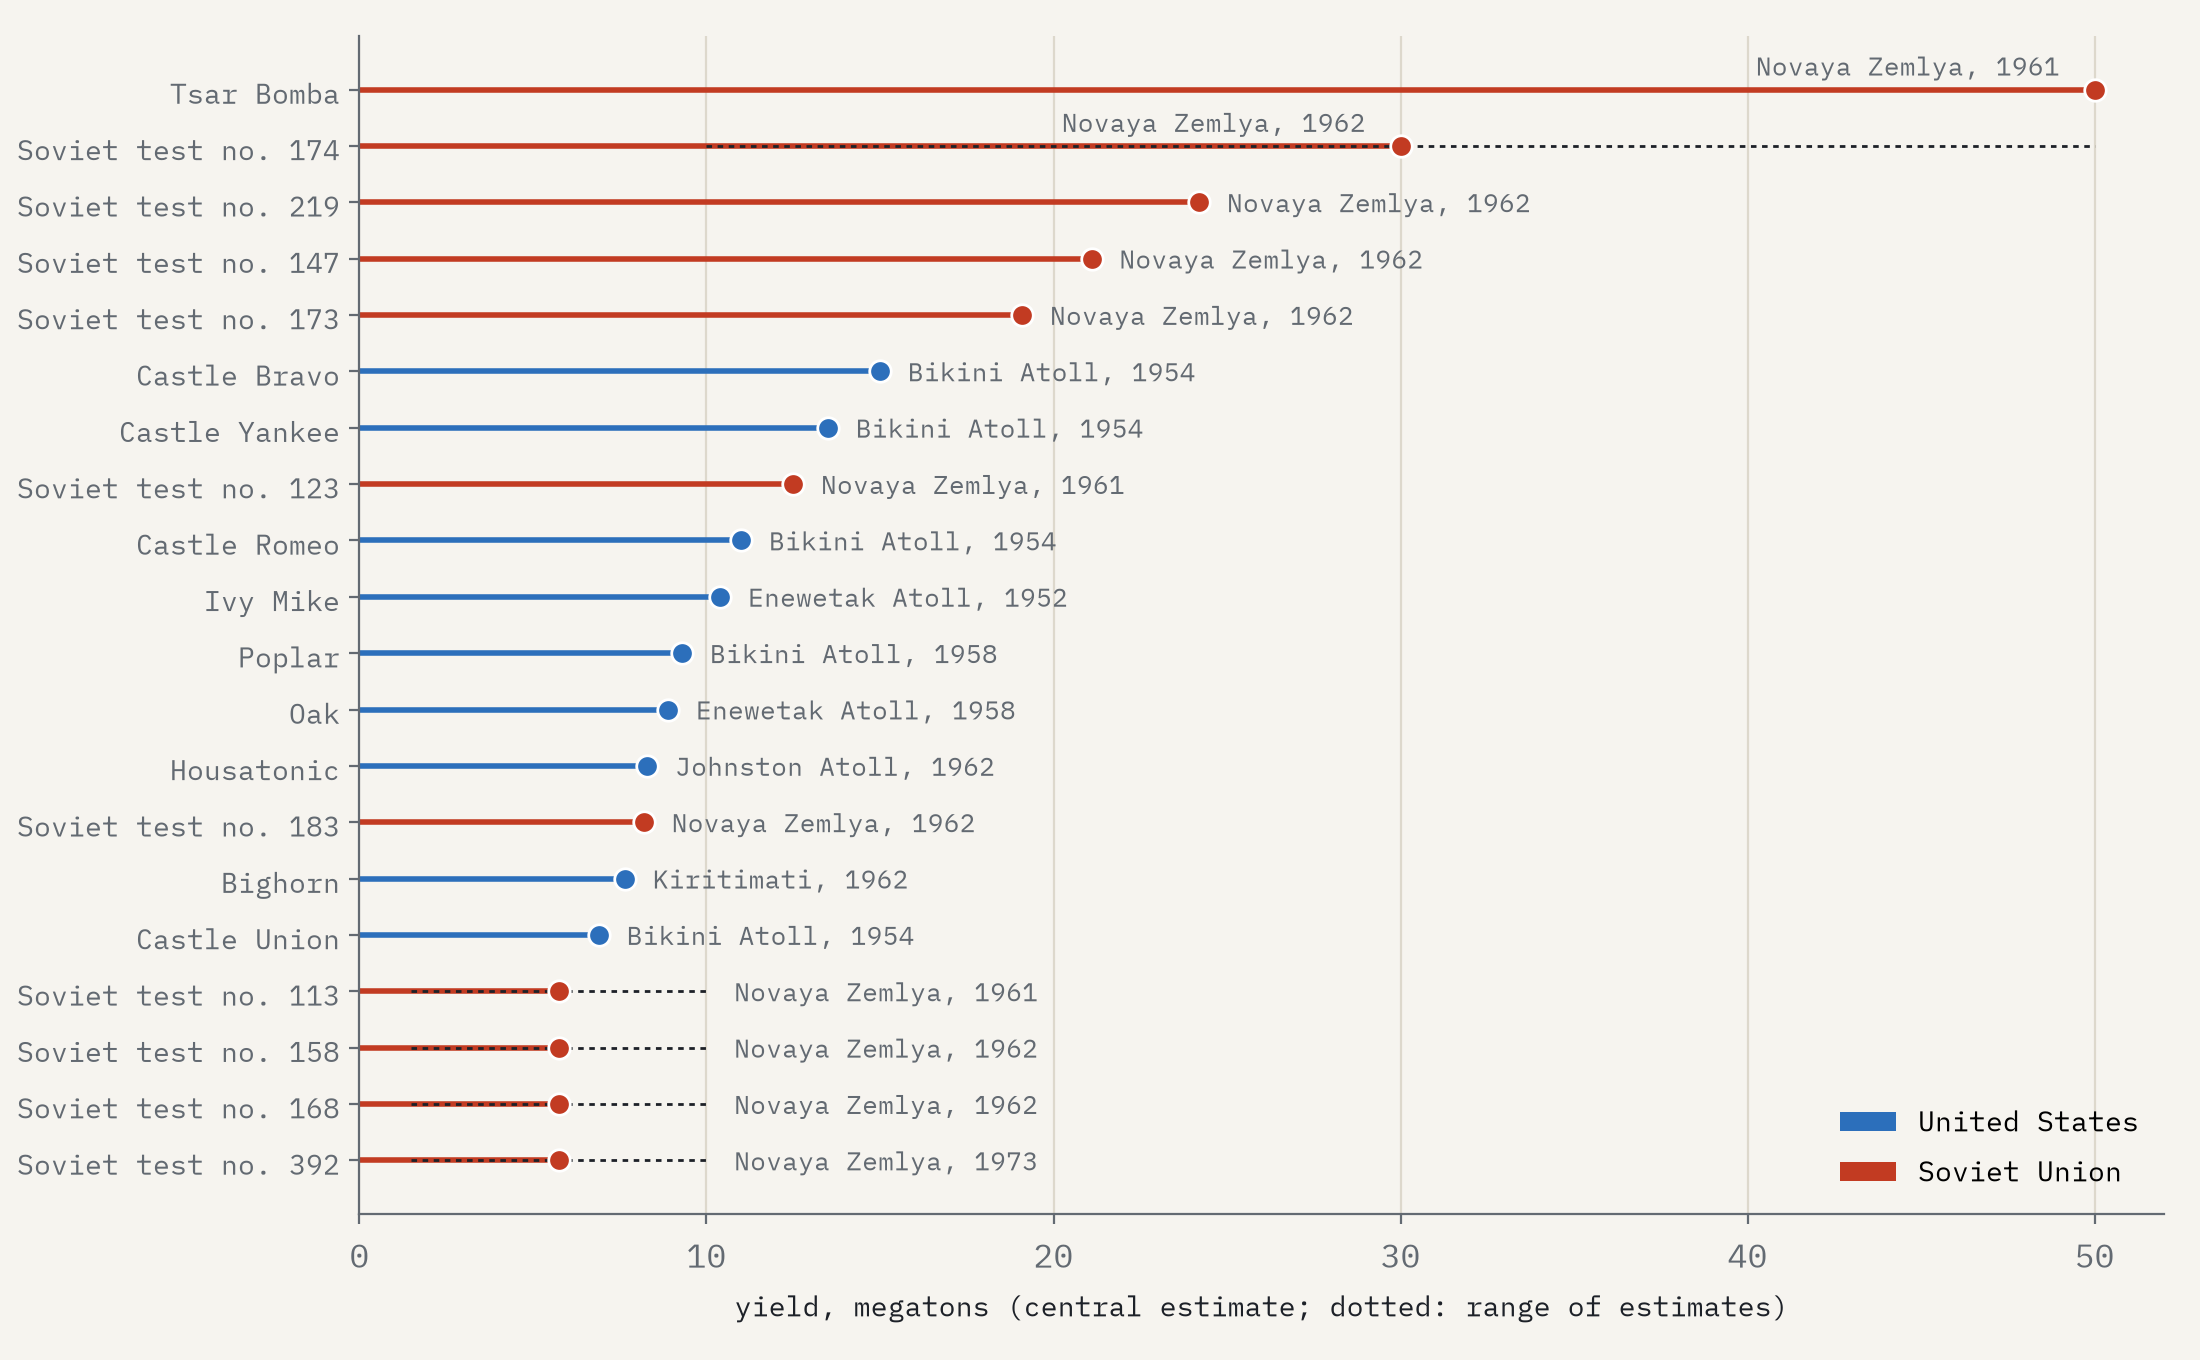
The largest of all was the Soviet test known as Tsar Bomba, dropped by parachute over Novaya Zemlya on 30 October 1961: about 50 megatons, 9% of the yield of every test put together. The largest American test, Castle Bravo at Bikini Atoll in 1954, came in at 15 megatons, far more than expected. Its fallout drifted onto the inhabited atolls of Rongelap and Rongerik, which had to be evacuated, and onto a Japanese fishing boat whose crew fell ill.
Whose land
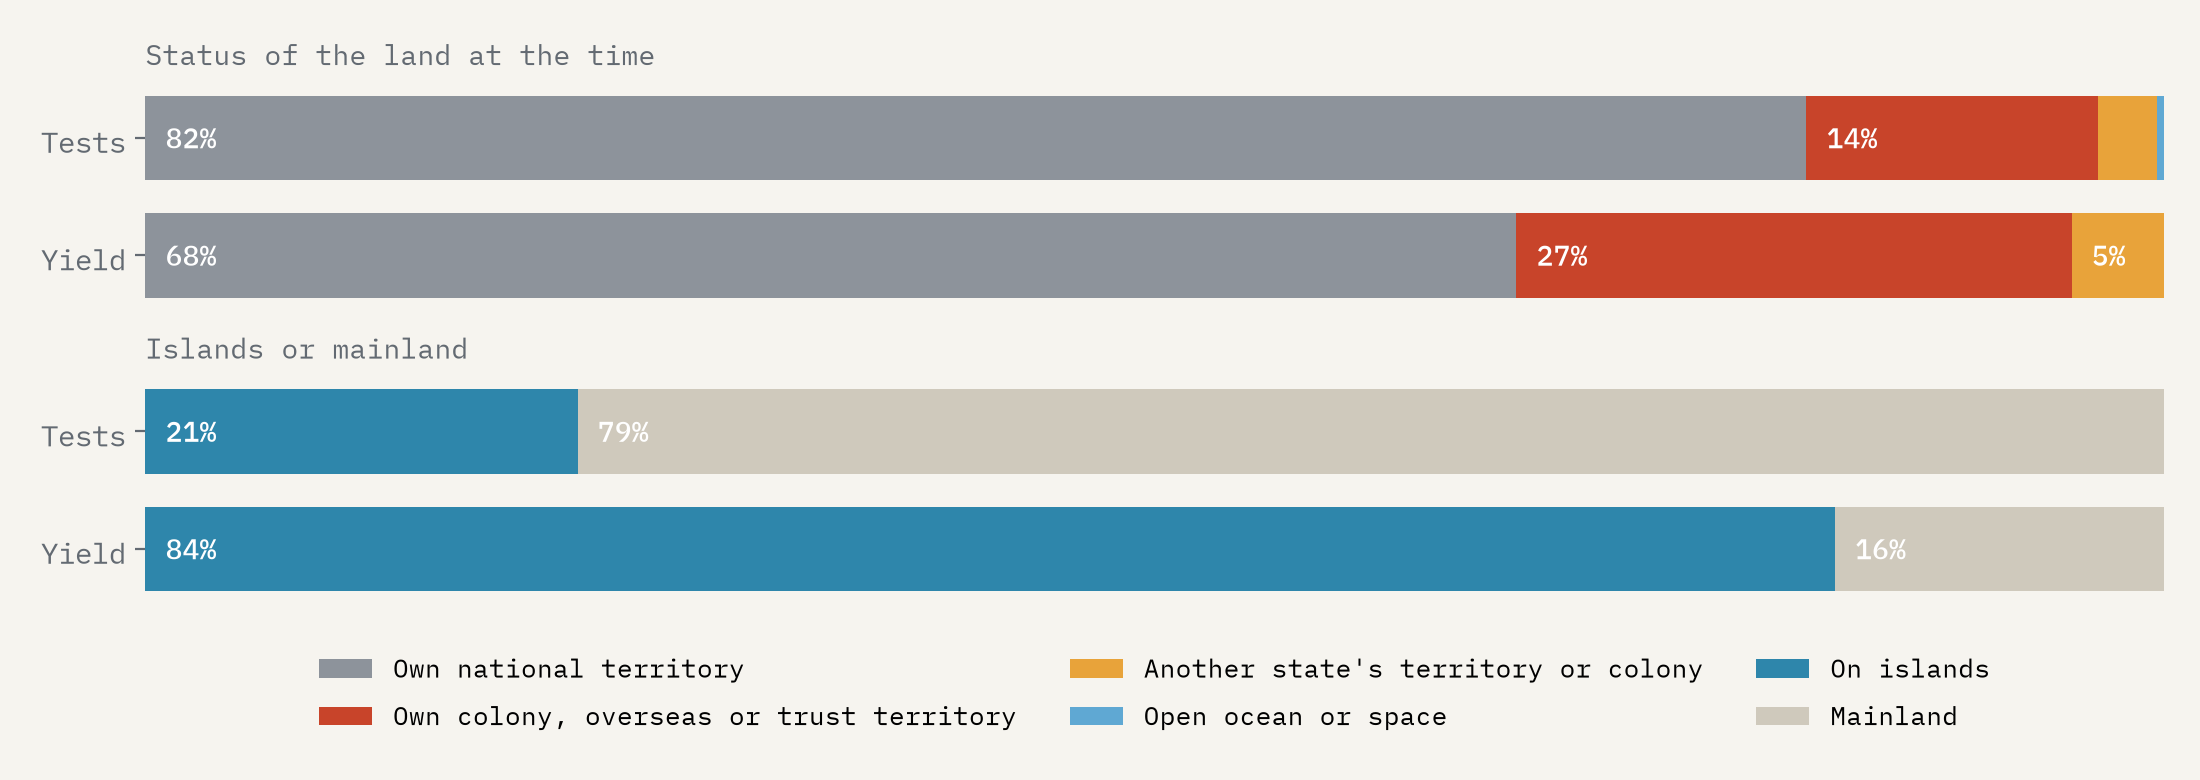
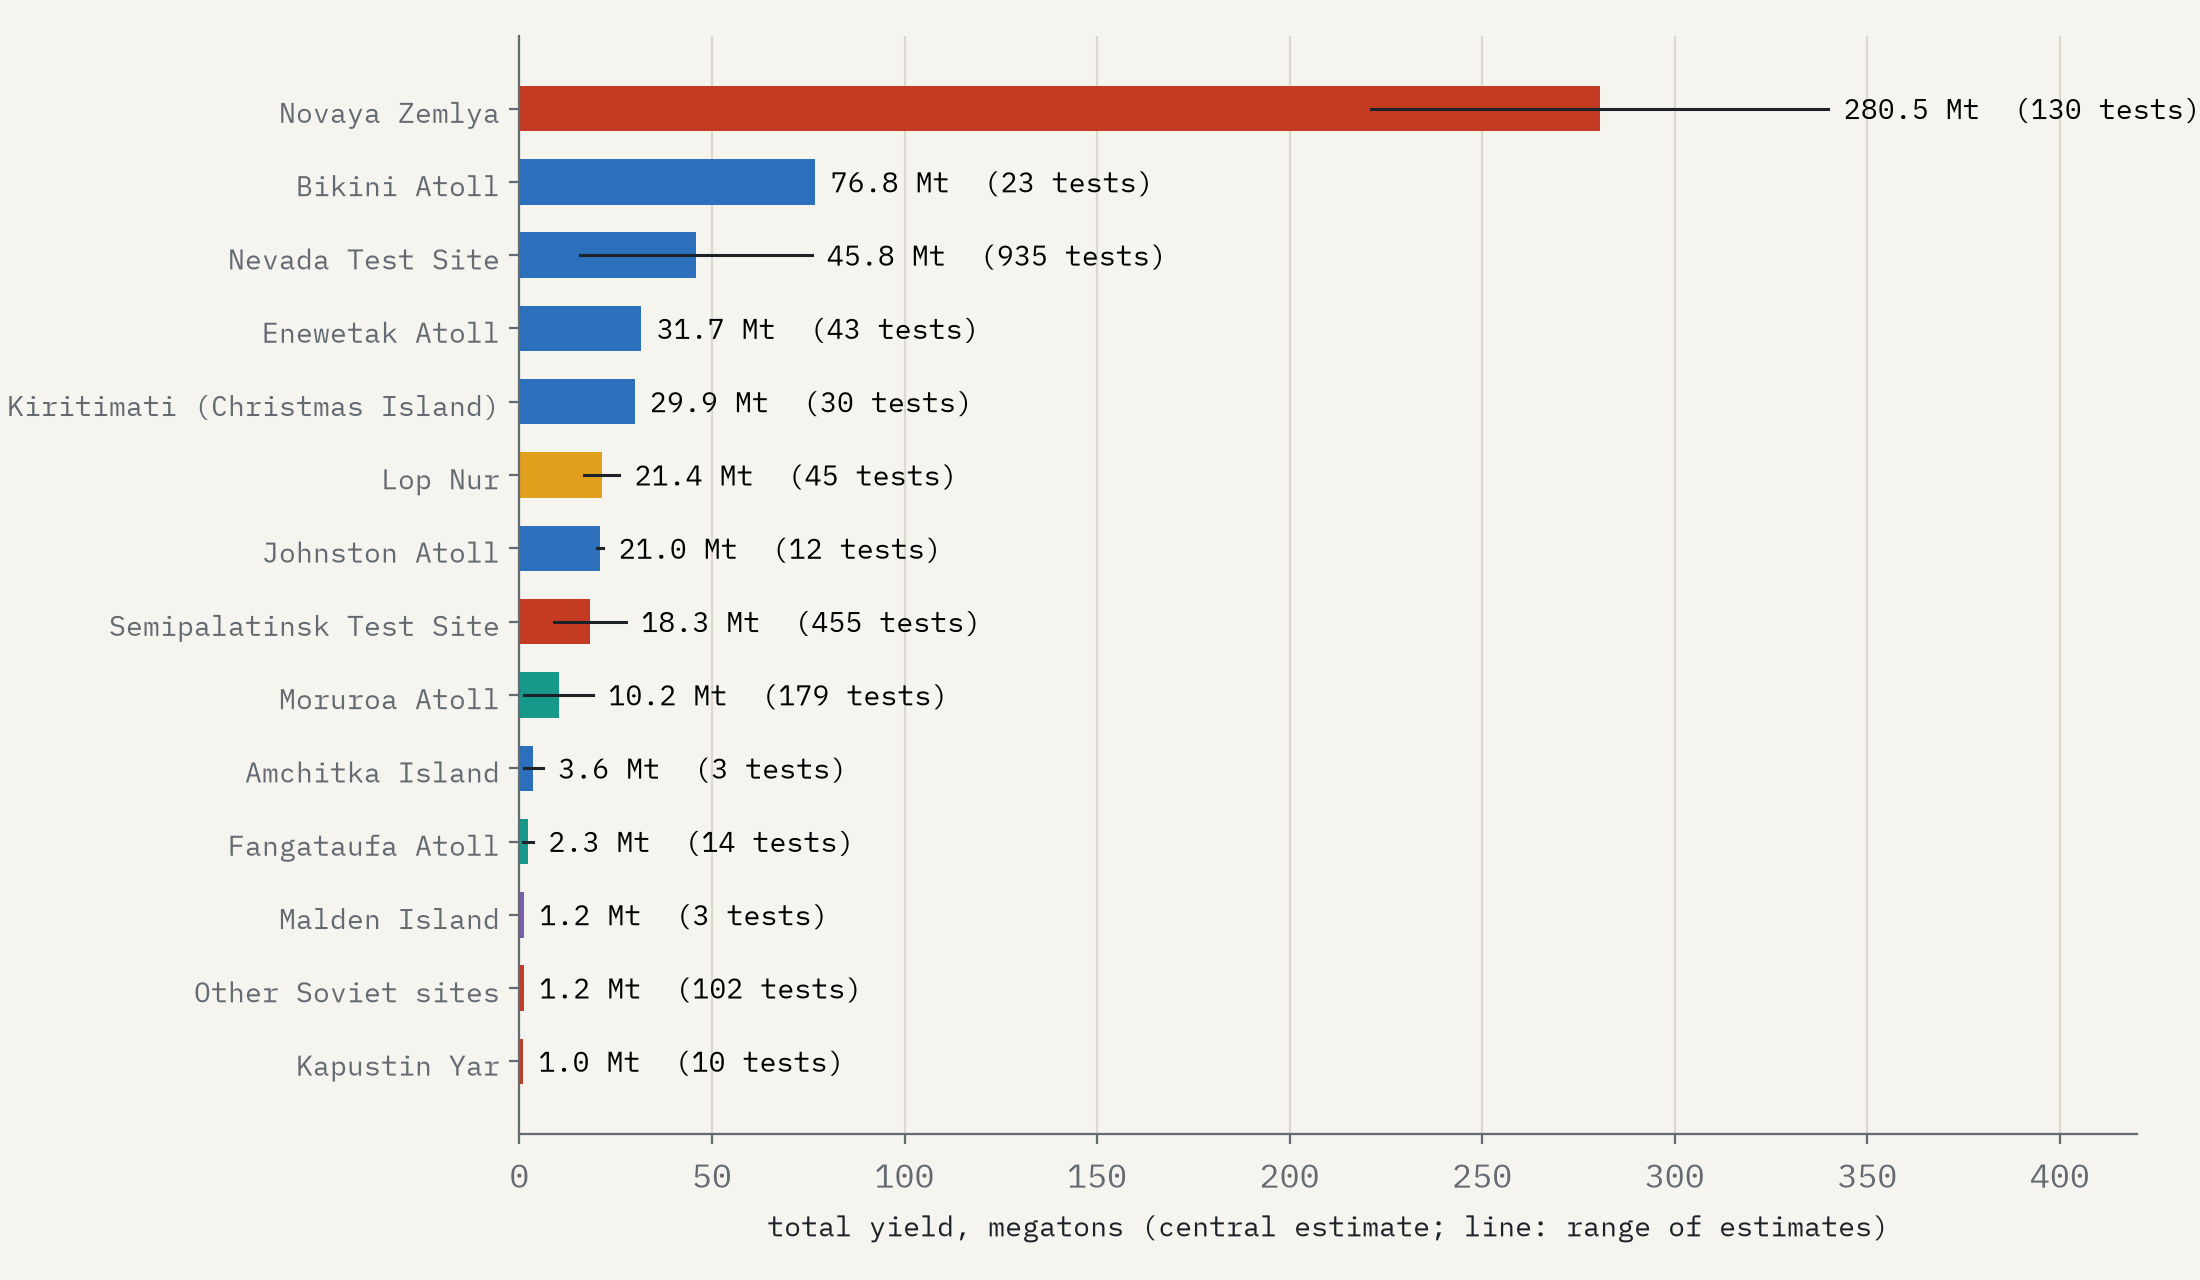
Most tests, 82% of them, were on the testing country’s own territory, mostly underground in Nevada, Kazakhstan and Xinjiang. But the big atmospheric bombs were mostly set off a long way from the governments that ordered them. Every one of France’s 210 tests and Britain’s 45 was outside the home country: in the Algerian Sahara, where 11 took place after Algeria’s independence; on the atolls of French Polynesia; on Aboriginal lands at Maralinga and Emu Field in Australia; on islands that are now part of Kiribati; and in Nevada. The United States held 66 tests at Bikini and Enewetak in the Marshall Islands, then a United Nations trust territory under its administration, whose people were moved away first. Those two atolls took 54% of all American test yield.
Islands saw 21% of nuclear tests, but 84% of all the explosive energy.
Put another way: 440 tests, 21% of the total, were on islands and atolls, from Novaya Zemlya in the Arctic to Moruroa in the South Pacific. They released 84% of all the yield. Novaya Zemlya alone took 51%.
After the test ban
The Comprehensive Nuclear-Test-Ban Treaty opened for signature in September 1996. It has still not entered into force, but the big testers had already stopped: the Soviet Union in 1990, Britain in 1991, the United States in 1992, France and China in 1996. Since then there have been 10 tests: two by India and two by Pakistan in May 1998, and six by North Korea between 2006 and 2017, the last estimated at 70 to 280 kilotons. As I write, in 2026, it has been 9 years since the last one.
A map of tests is not a map of harm. Fallout travelled far beyond the test sites, and the people who lived downwind, on the atolls and around the sites, and the soldiers and workers who were there, carried the cost in ways this data cannot show. But it does show where the bombs went off, and who decided where.
How I did this
The tests from 1945 to 1998 come from the SIPRI list of nuclear explosions by Bergkvist and Ferm (2000), as shared by data is plural and the TidyTuesday project. North Korea’s six tests, and names for some of the largest Soviet tests and the Indian and Pakistani tests, come from Wikipedia. I counted tests as the SIPRI list does, with salvoes of several devices as one test, so my total (2,055) is lower than some other counts. Yields are given as ranges, often only “less than” some figure, so I used the middle of each range and report the full range beside every total. I classed each site by the status of its land at the time. Circles on the map are sized by the cube root of yield, the way blast damage scales.
Notes and sources
- Bergkvist, N.-O. and Ferm, R. (2000) Nuclear Explosions 1945 to 1998. Stockholm: Swedish Defence Research Establishment (FOA) and SIPRI. Data via data is plural and TidyTuesday (credit Jesus Castagnetto).
- Wikipedia, List of nuclear weapons tests, List of nuclear weapons tests of North Korea, Pokhran-II and Chagai-I (CC BY-SA 4.0; material derived from them is shared under the same licence).
- UNSCEAR (2000) Sources and Effects of Ionizing Radiation, Annex C; Royal Commission into British Nuclear Tests in Australia (1985) Report; Khalturin et al. (2005) on Novaya Zemlya, Science and Global Security 13; Kuletz (1998) The Tainted Desert.
- Natural Earth outlines (public domain). Base map tiles on the interactive page © Esri.
- I wrote the text, with drafting and editing assistance from Claude (Anthropic), which also helped prepare the analysis code. I reviewed and checked all text and results.

