
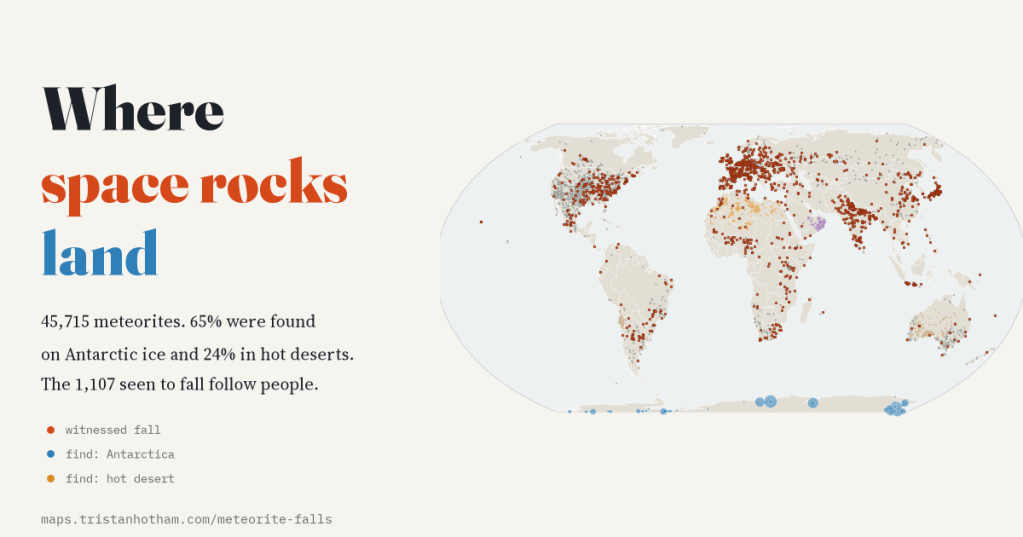
Space rocks land everywhere, more or less evenly. So why do two thirds of known meteorites come from Antarctica? I mapped 45,715 of them, from the Meteoritical Society’s catalogue as NASA publishes it, and found that the map tells you far more about people than about the sky.
Every day, somewhere on Earth, a rock from space hits the ground. Most land in the sea, in forests or on farmland, and nobody ever knows. A few are seen as fireballs and tracked down: those are “falls”. Many more are simply picked up later by someone who noticed an odd, heavy, dark stone: those are “finds”. The Meteoritical Society keeps the official list, and NASA publishes a copy with the place, year, class and weight of each one. Up to 2013 it holds 45,715 meteorites recovered on Earth.
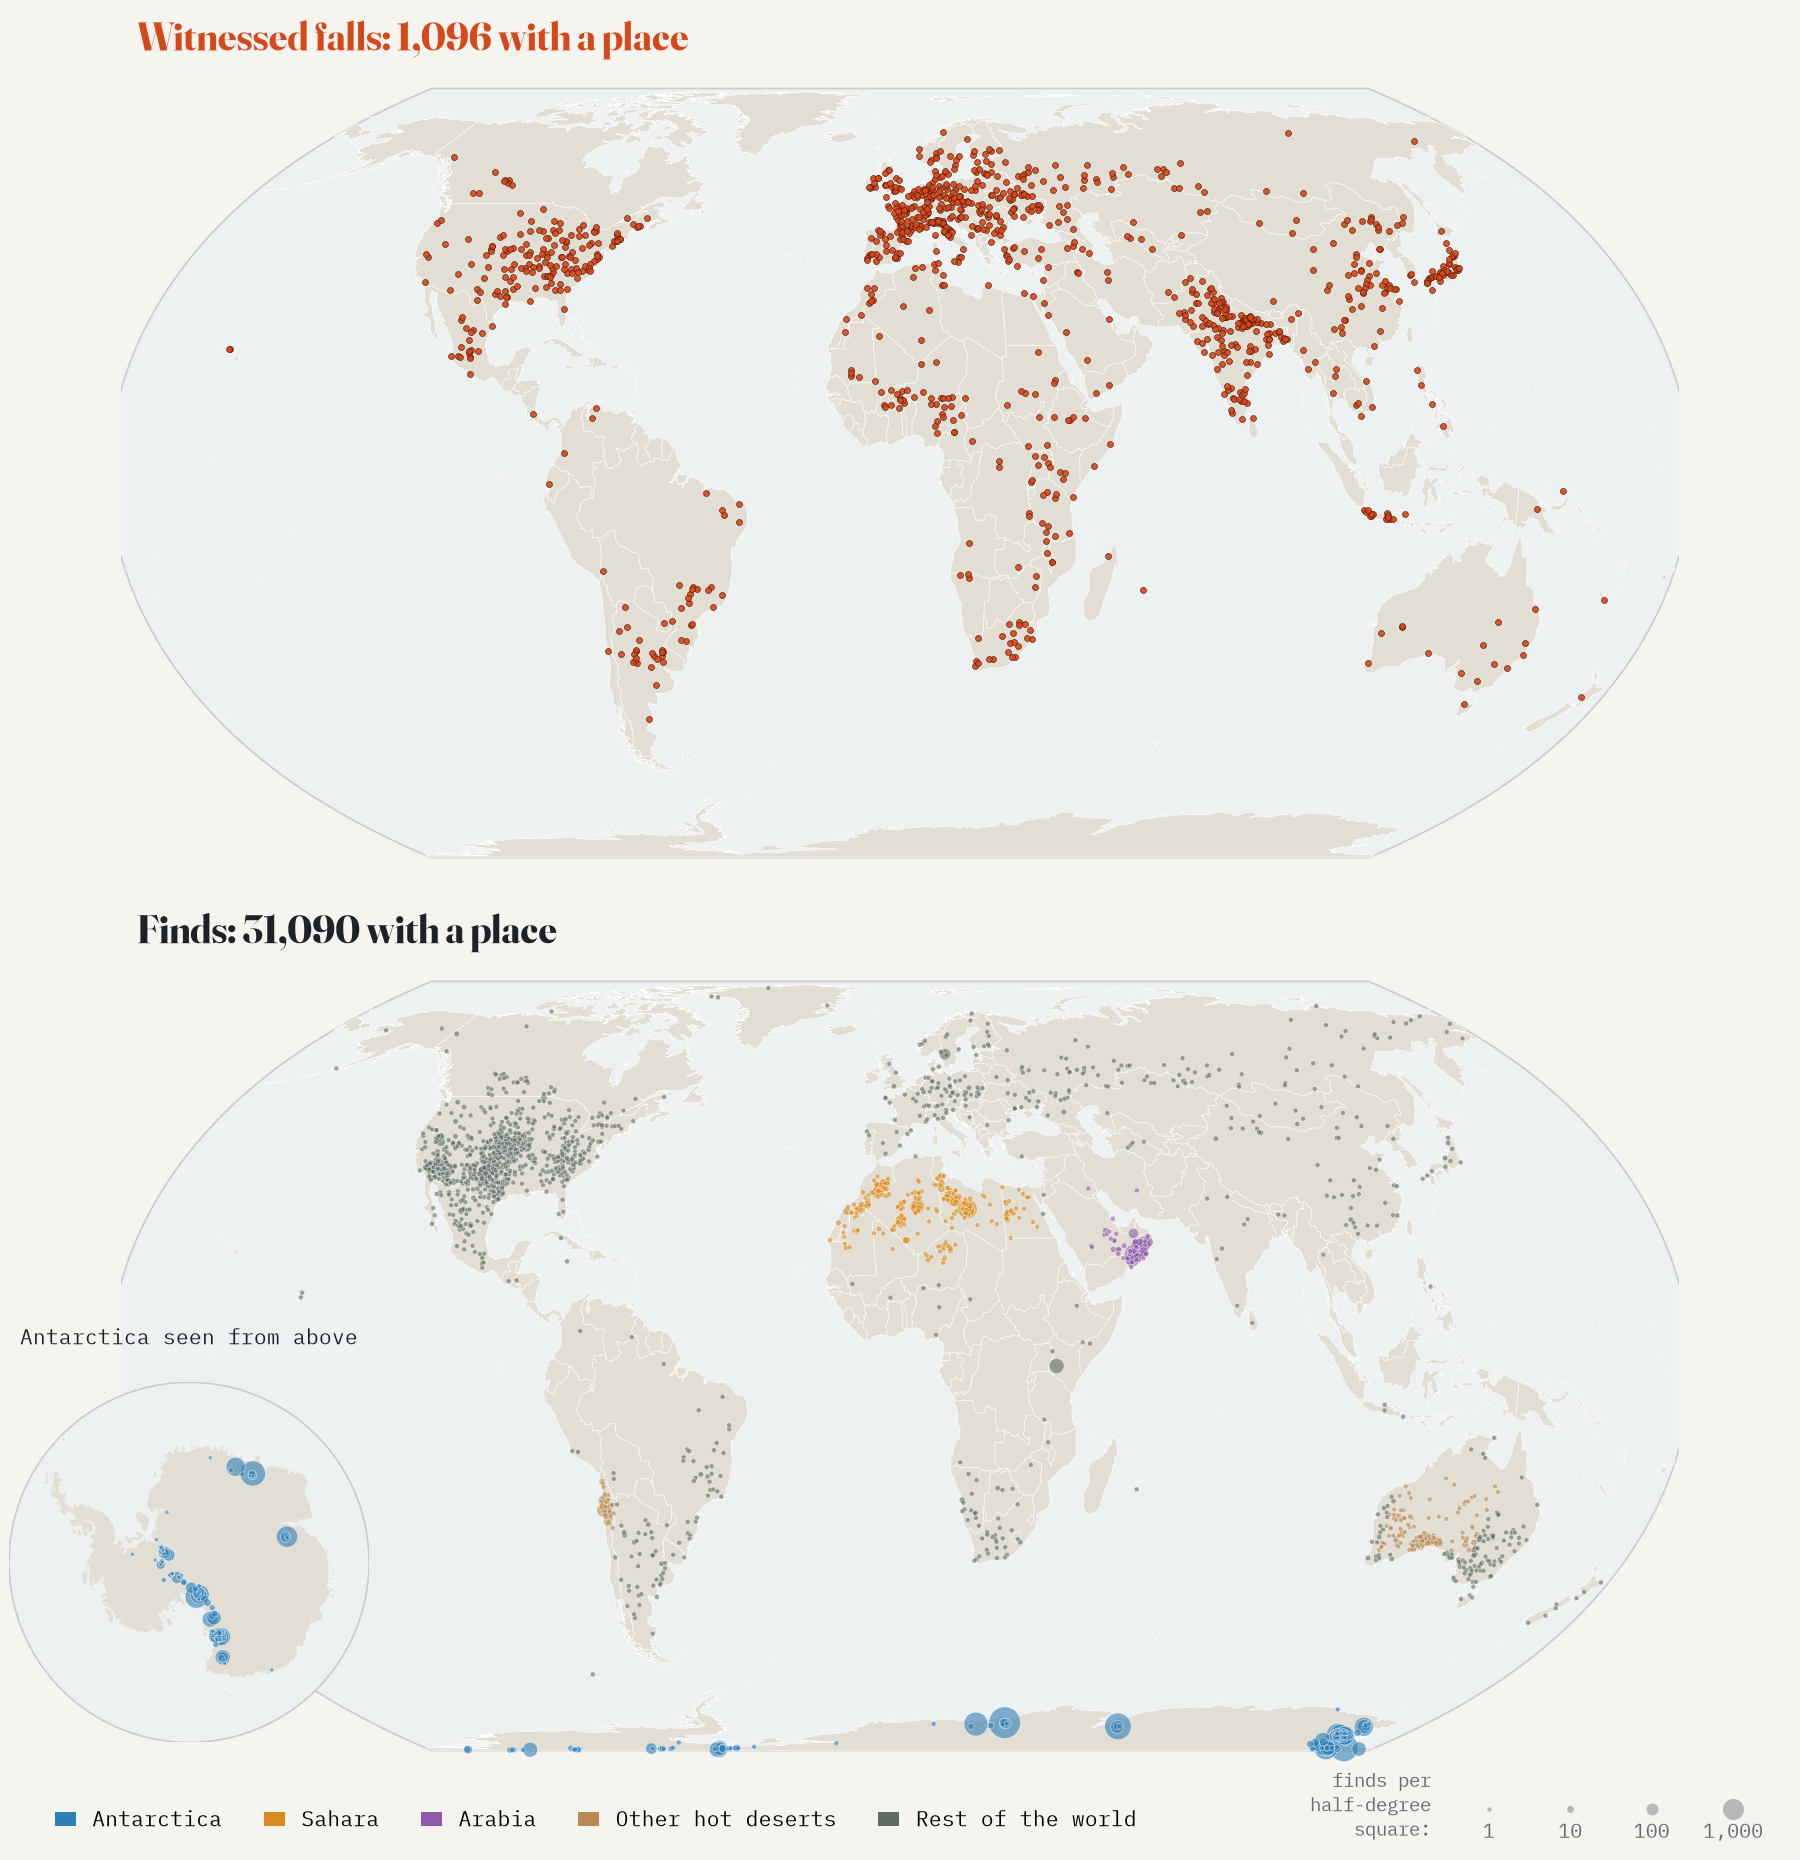
Only 1,107 of them, 2.4%, were seen to fall. Put the falls and the finds on two maps and they look like two different planets.
Ice and sand
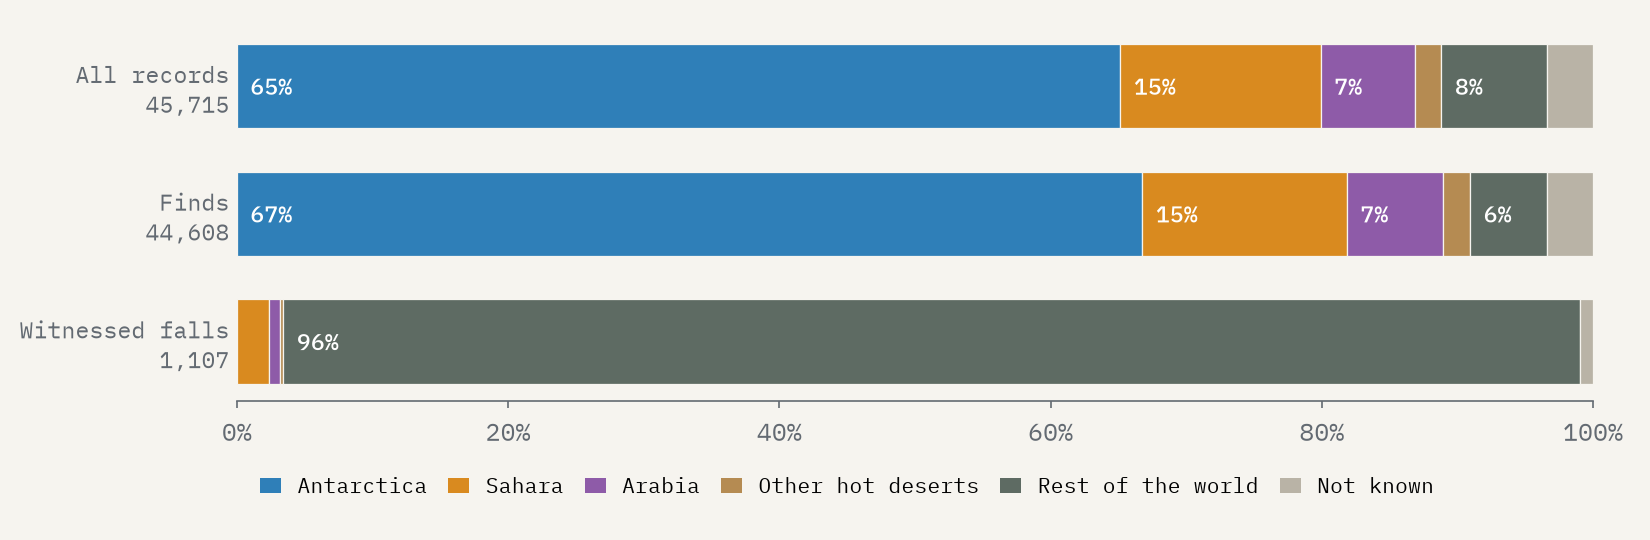
Antarctica alone accounts for 29,783 meteorites, 65% of the whole record. The Sahara adds 15% and Arabia, mostly Oman, 7%. Add the Atacama and the Australian deserts and 89% of all known meteorites come from ice or desert. The whole rest of the world, every field, forest and town, supplies 8%.
There is nothing special about the sky over Antarctica. What is special is the ground. The ice sheet flows slowly towards the mountains, carrying meteorites that fell over tens of thousands of years, and where it is blocked and the wind strips the surface away, it leaves them lying on bare blue ice. A dark stone on blue ice is about the easiest thing in the world to spot. Deserts work in a similar way: almost no rain to rot the stones, and a pale, stable surface to show them off.
That also makes Antarctic meteorites small. The median one weighs 13.4 g, the median Saharan one 235 g, and the median find from anywhere else 1,700 g. In a ploughed field you would never notice a stone the size of a grape. On ice, people collect them by the thousand.
The great meteorite rush
For most of history the record grew slowly. The first Antarctic meteorite turned up in 1912, and only 4 more followed before 1969, when a Japanese team found 9 on the ice near the Yamato Mountains and realised what the ice was doing. Searches have run every season since. Today 7,269 meteorites carry the name Yamato. From the 1980s hunters began combing the Sahara and Oman too, and the finds peaked in the 2000s, at 17,697 in a single decade.
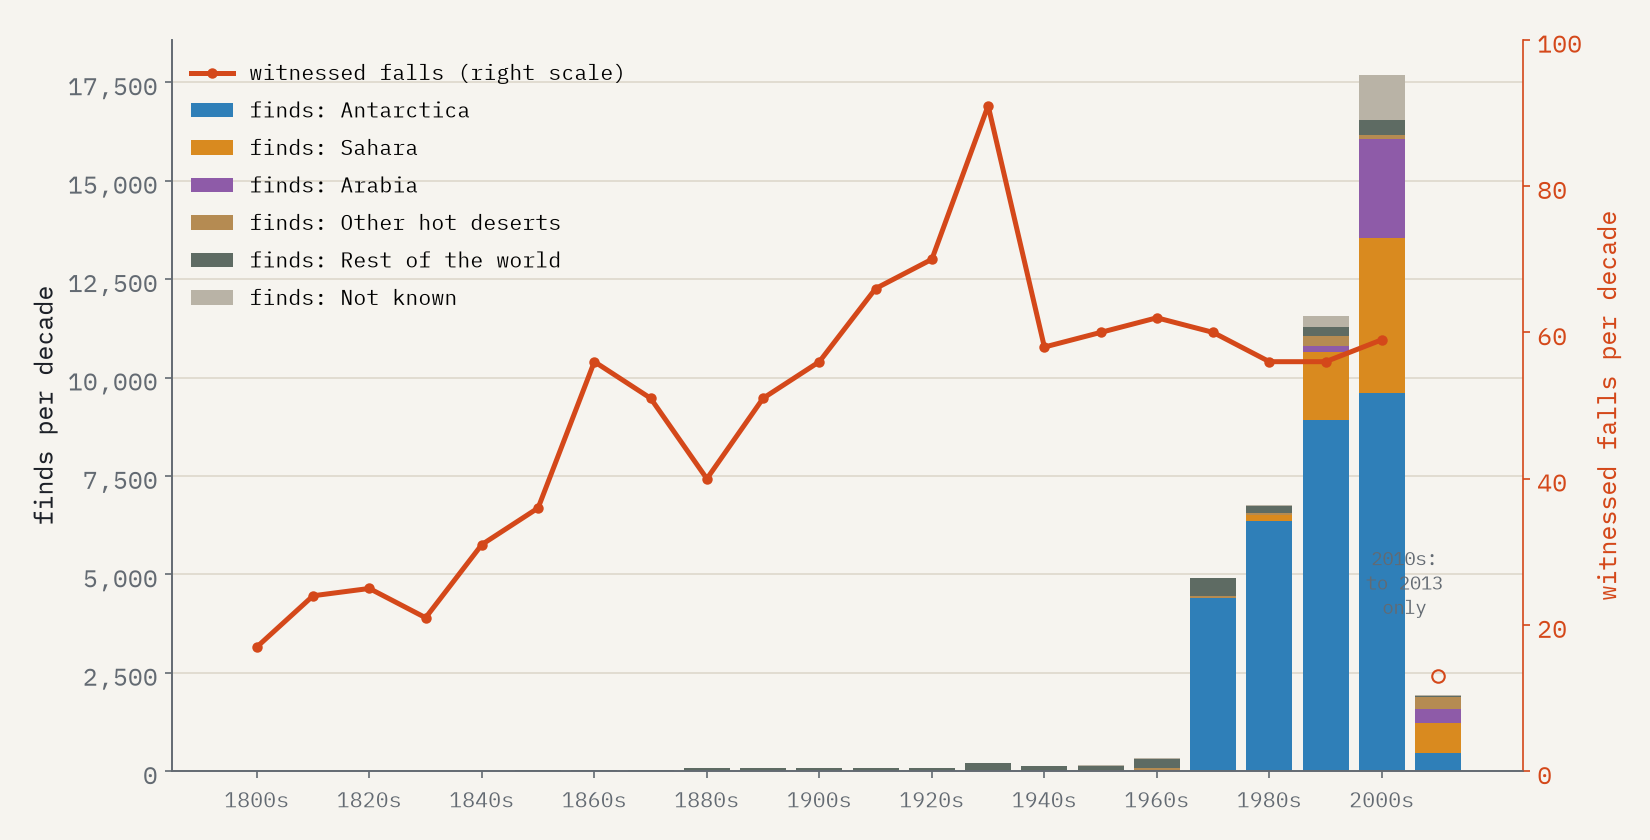
Witnessed falls tell a gentler story. They rose from 17 in the 1800s to a peak of 91 in the 1930s, as more people could read, newspapers reported fireballs and museums wanted the stones. Since 1950 they have held steady at about 59 a decade, even though the world’s population roughly doubled between the 1960s and the 2000s.
A map of meteorites is really a map of where people have looked for them.
Falls follow people
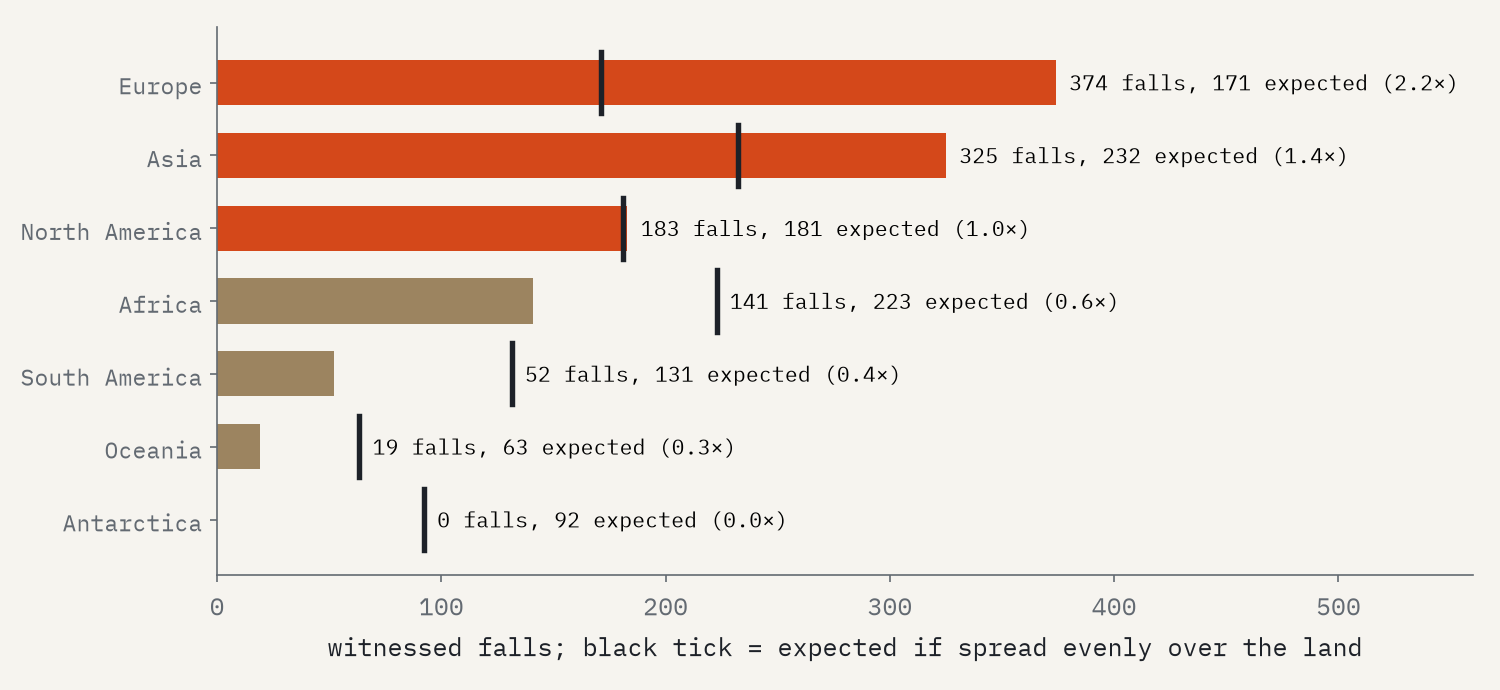
Witnessed falls should be the fair sample: nobody goes out searching for them. If every fall on land were spotted, each country would get falls in proportion to its area. Antarctica, 8% of the land, would have about 92. It has none. Europe has 2.2 times its share, Asia 1.4 and North America almost exactly its share; Africa gets 0.6, South America 0.4 and Oceania 0.3.
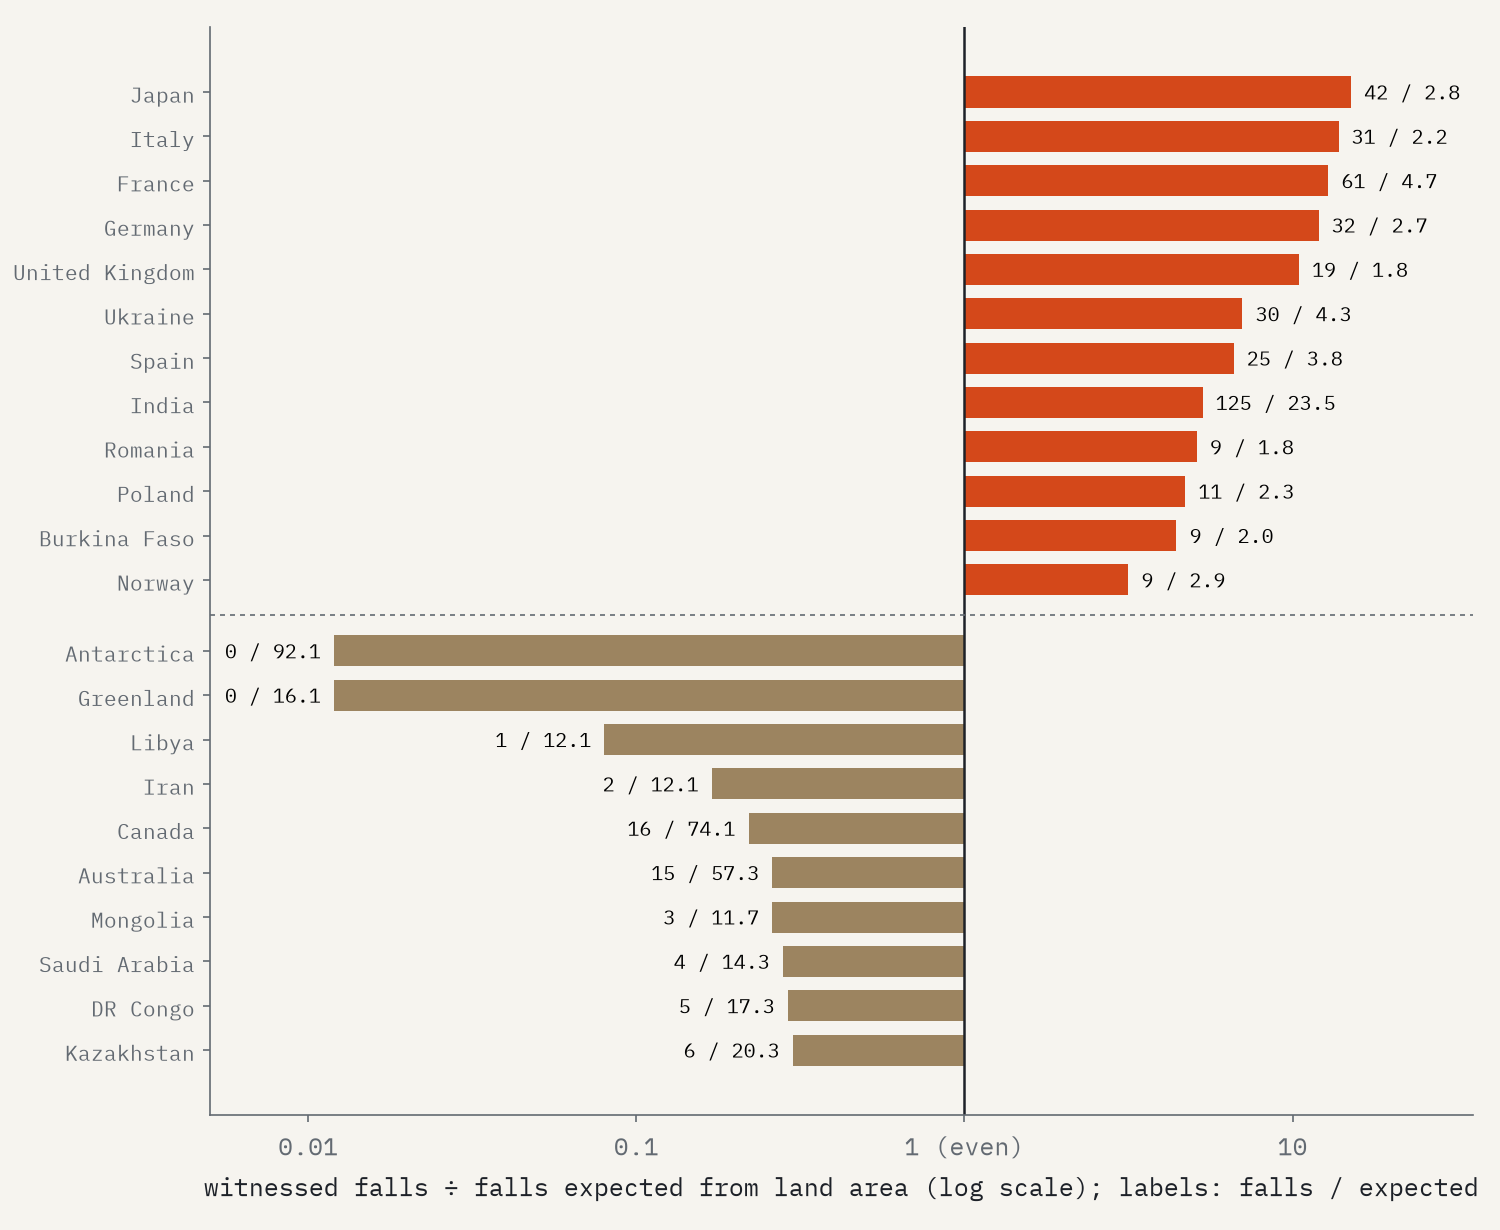
Country by country the gaps are bigger. Japan has 42 falls where its area predicts fewer than three, about 15 times its share. Italy, France and Germany are each over ten times, and the United Kingdom 10 times, with 19 falls. India, with 125, is the great exception outside Europe and North America. At the other end, Canada has 16 where 74 would be expected and Australia 15 against 57. Libya, with 1,466 desert finds, has a single witnessed fall.
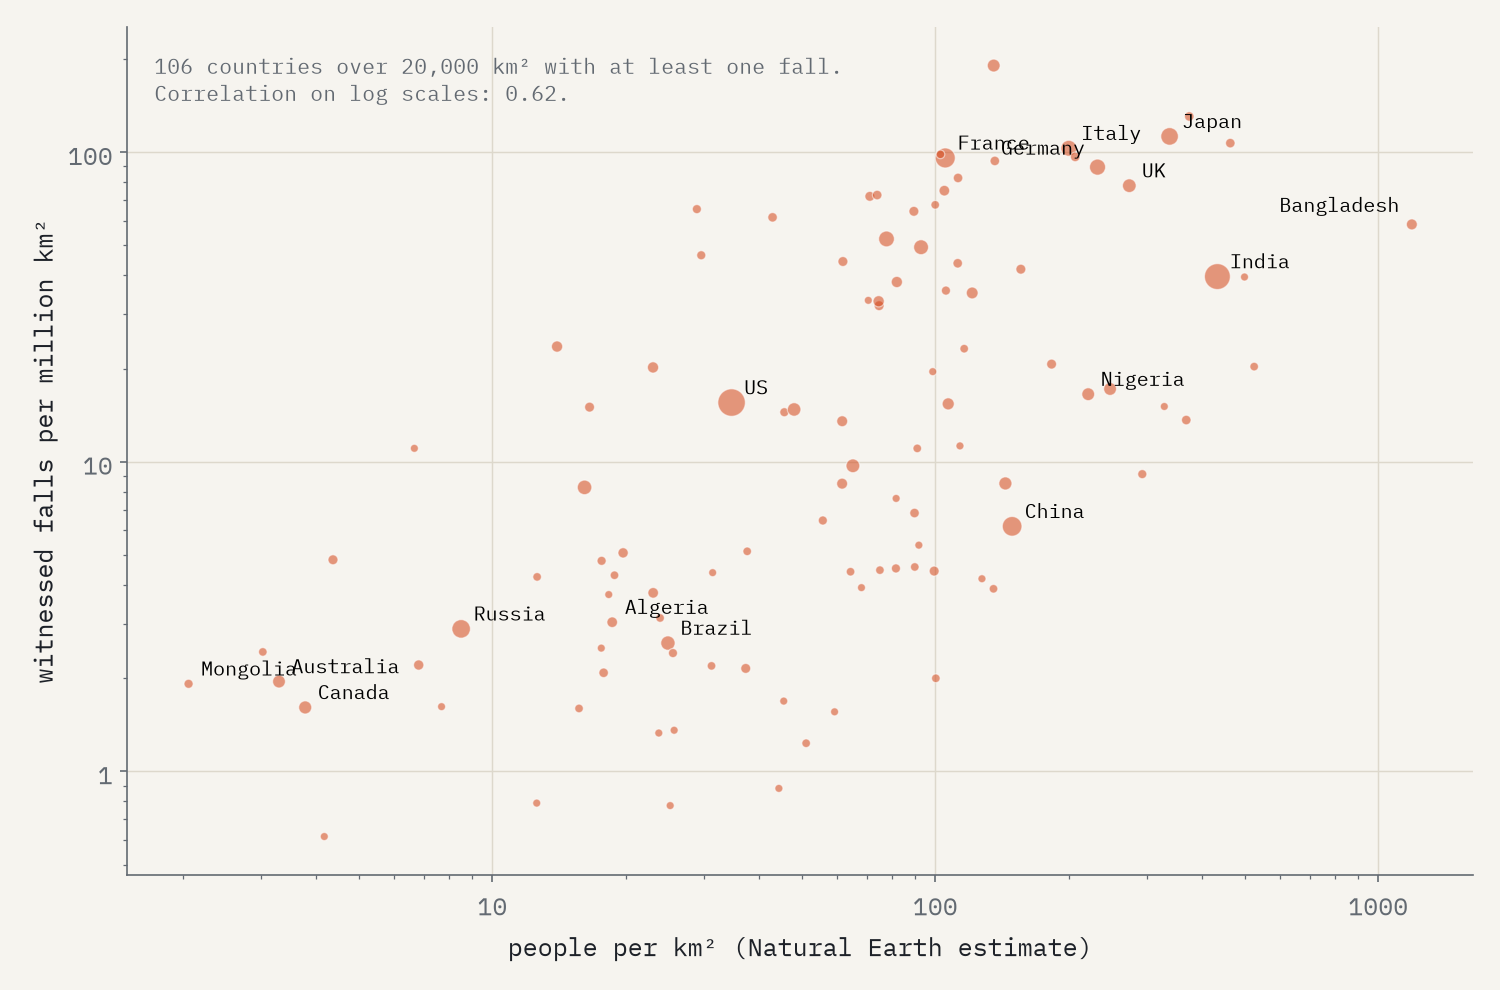
More people per square kilometre means more falls per square kilometre: the correlation on a log scale is 0.62. But it is loose, and history matters as much as headcount. Europe and Japan sit above countries just as crowded elsewhere, because they had centuries of written records, a press that reported fireballs, and collectors and museums who wanted the stones. (Population here is today’s rough estimate, not the population when each stone fell.)
The giants are iron
The heaviest meteorite on record is Hoba in Namibia, 60.0 tonnes, still lying where a farmer found it in 1920. Next come Cape York in Greenland (58.2 t) and Campo del Cielo in Argentina (50.0 t). All ten of the heaviest are iron. The heaviest witnessed fall is Sikhote-Alin in the Russian Far East, 23 tonnes of iron that came down in 1947.
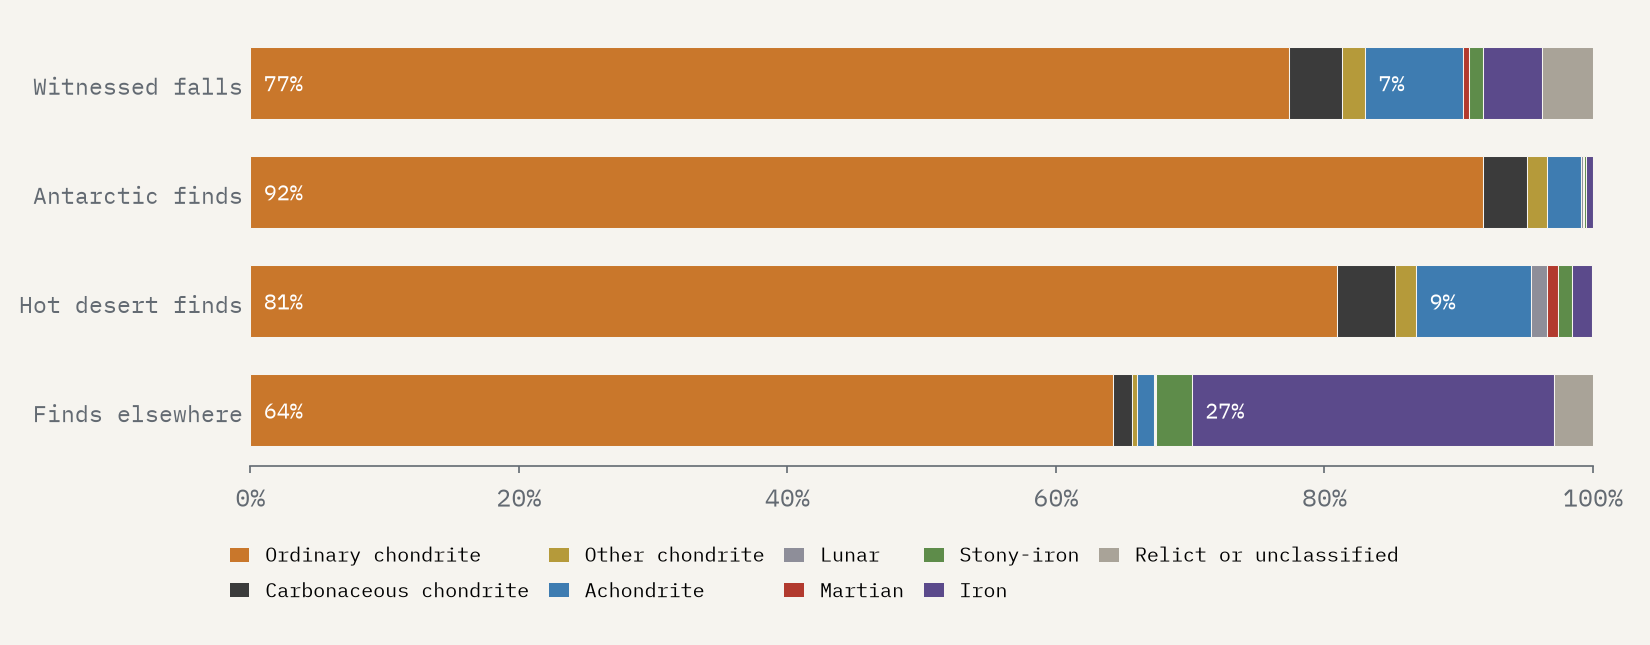
Iron is also the clearest sign of the searching effect. Irons are only 4.4% of falls, but 27% of finds outside the ice and deserts: they rust slowly, look like nothing else in a field, and set off metal detectors. On ice and sand, where any dark stone stands out, the finds look much more like the falls.
How I did this
The data are NASA’s Meteorite Landings table, compiled from the Meteoritical Society’s Meteoritical Bulletin Database, which ends in 2013. I used a copy mirrored on GitHub and checked it against a second, independent mirror: they match on every name, class, weight and coordinate. I left out one meteorite found on Mars by a rover. Records without a place (13,529, mostly desert stones sold with only a broad name like “Northwest Africa”) were assigned a region from the area in their name where possible. Antarctica is everything south of 60°S; the hot deserts are rough boxes around the Sahara, Arabia, the Atacama and the Australian deserts. To compare with an even spread I gave each country a share of the witnessed falls in proportion to its land area, Antarctica included. Many Antarctic and desert stones are fragments of the same fall, so the counts are of named meteorites, not separate falls. The paper sets out every step and caveat.
Notes and sources
- The Meteoritical Society, Meteoritical Bulletin Database, as published by NASA’s Open Data Portal (“Meteorite Landings”), via GitHub mirrors.
- Natural Earth countries, populated places and population estimates (public domain); World Bank world population (CC BY 4.0).
- On why Antarctica and deserts collect meteorites: Harvey (2003) in Chemie der Erde; Bland and colleagues (1996) in Monthly Notices of the Royal Astronomical Society.
- I wrote the text, with drafting and editing assistance from Claude (Anthropic), which also helped prepare the analysis code. I reviewed and checked all text and results.

