
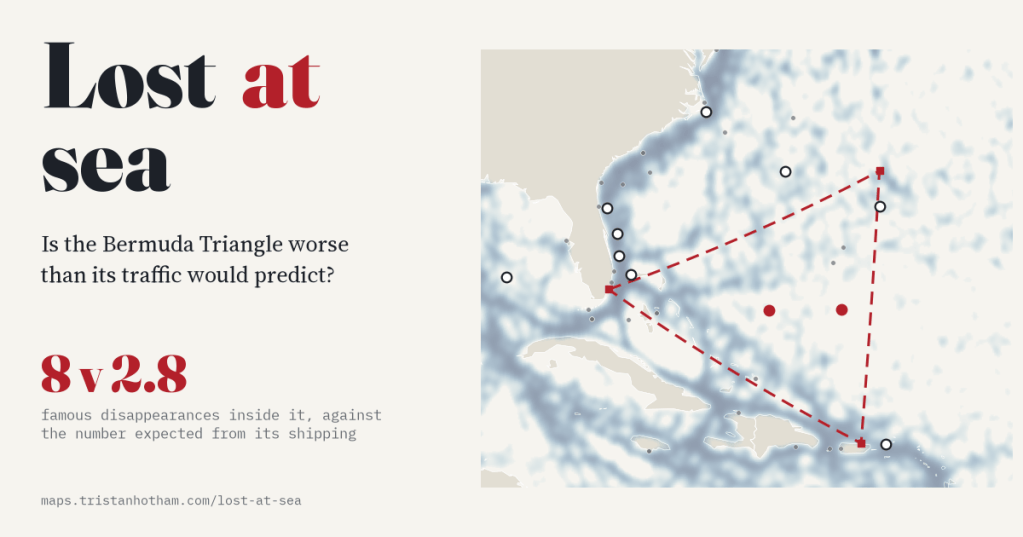
The Bermuda Triangle is supposed to swallow ships and planes more often than anywhere else. I put 472 famous disappearances on the map and tested every sea against its shipping. The Triangle does come out above its traffic, but no more than its neighbours, and most of its famous cases happened somewhere else.
Every so often someone asks me whether the Bermuda Triangle is real. The answer I always gave was the sceptic’s standard: it is a busy bit of sea, so of course things go missing there. It was only recently that I realised I had never checked. “Busy” is a number, and so is “missing”, and both can now be measured.
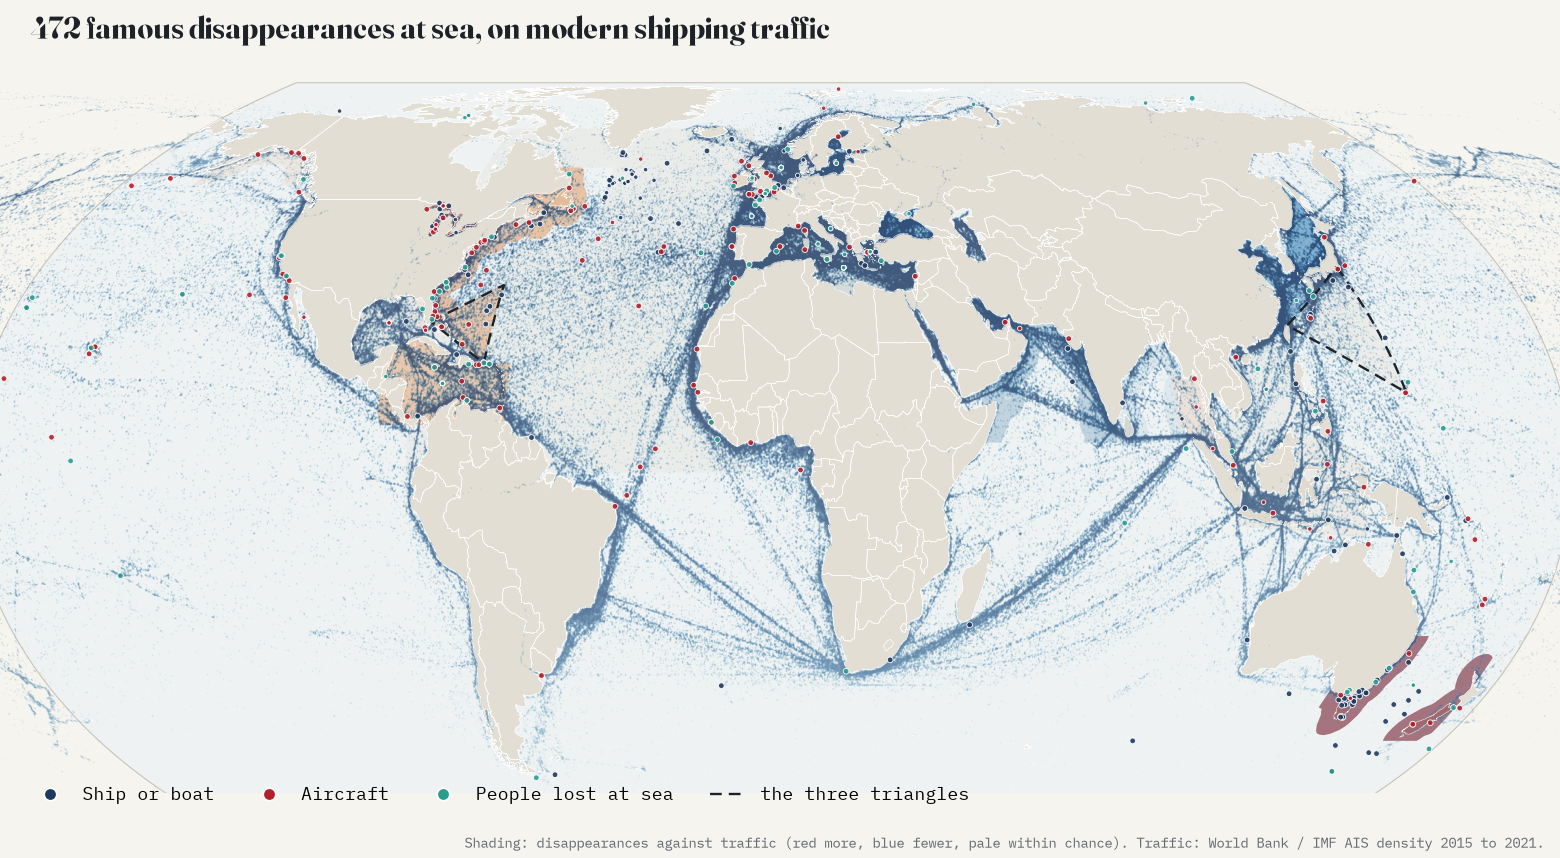
For the missing, I used Wikipedia. Its volunteers keep three lists: missing ships, missing aircraft, and people who disappeared mysteriously at sea. I parsed all three, added the incidents told in the articles on the Bermuda Triangle, the Dragon’s Triangle south of Japan and the Lake Michigan Triangle, merged the 61 rows that turned out to be the same incident, and placed each one on the map as well as its text allows. That gave 673 incidents, 472 of them at sea. For “busy”, I used the World Bank and IMF’s map of ship positions from 2015 to 2021, built from the AIS transponders that ships carry.
What “lost at sea” looks like
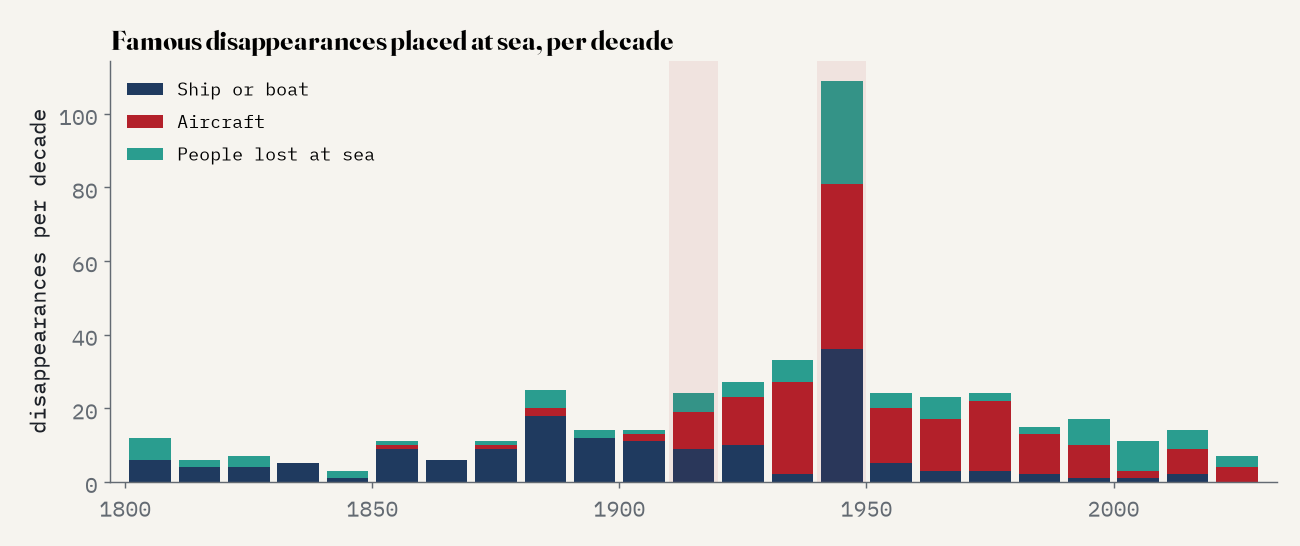
The lists are a wonderful mix: Tudor warships and Victorian steamers, Second World War submarines, pioneer aviators, balloonists, round-the-world yachtsmen and cruise passengers. The median year of a placed incident is 1940, and 69% are from before 1946, so most of them happened long before modern shipping lanes existed. Placing them was the hard part. Only 37 give a position. Most say “off” a cape or island, or name two ports (“somewhere between New York and Liverpool”), and I used the midpoint of the route. I left out 201 that say no more than “Atlantic Ocean”, or were lost over land.
The test
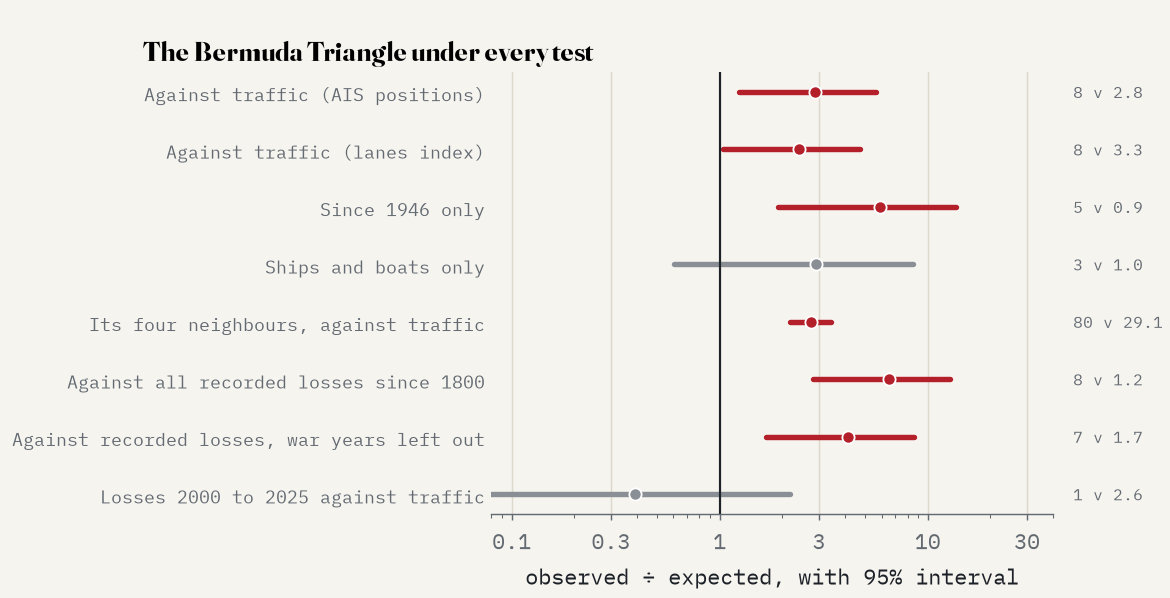
The idea is simple. If disappearances just followed traffic, a sea with 1% of the world’s shipping should hold about 1% of the disappearances. So for each of 27 seas I worked out the number expected from its share of traffic and compared it with the number there, with an interval for the role of chance. The Bermuda Triangle, drawn from Miami to Bermuda to San Juan, carries 0.59% of the world’s tracked shipping, so it should hold 2.8 of the 472 disappearances. It holds 8.
That is 2.9 times its traffic, with a 95% interval of 1.2 to 5.6. So the legend is right, then? Not quite. Look next door. The US Atlantic coast, the Caribbean, the Gulf of Mexico and the Grand Banks together hold 80 disappearances against 29.1 expected: 2.7 times their traffic, the same excess as the Triangle. Within that group the Triangle has 8.8% of the shipping, which predicts 7.7 of the group’s disappearances. It has 8. The whole American side of the Atlantic is over-represented, which is what you would expect of lists written mostly in English about American and British ships and planes. The Triangle is simply part of it.
The famous cases happened elsewhere
The bigger surprise came when I placed the incidents that Wikipedia’s Bermuda Triangle article tells. Of 14, only 2 fall inside the triangle, and both of those only because I put them at the midpoint of their route. Flight 19, the five Avengers that vanished in 1945, was lost off Florida’s east coast, just north of the line from Miami to Bermuda. The Cotopaxi’s wreck has been found off St Augustine. The Marine Sulphur Queen went down in the Gulf of Mexico, the Carroll A. Deering ran aground at Cape Hatteras, and the Star Tiger was lost far out on the way from the Azores. Larry Kusche made the same point in 1975: the Triangle has grown in the telling to cover most of the western North Atlantic.
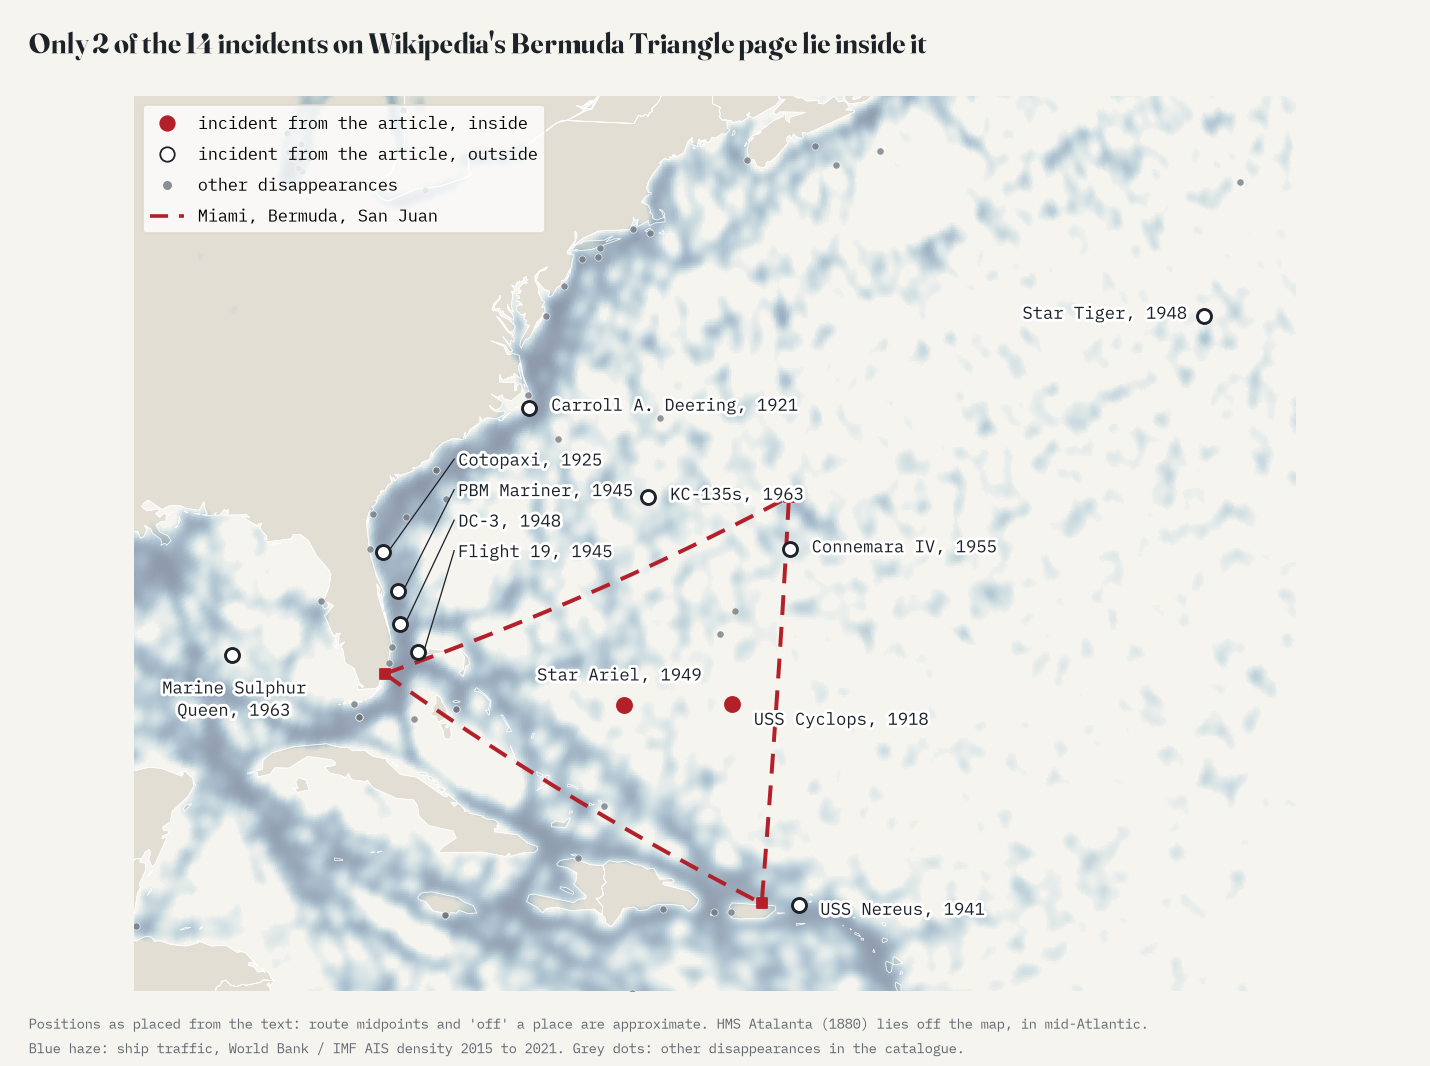
The seas that really are worse than their traffic are not mysterious: they are stormy, shallow, busy in the past, or very well written about.
So where is it really worse?
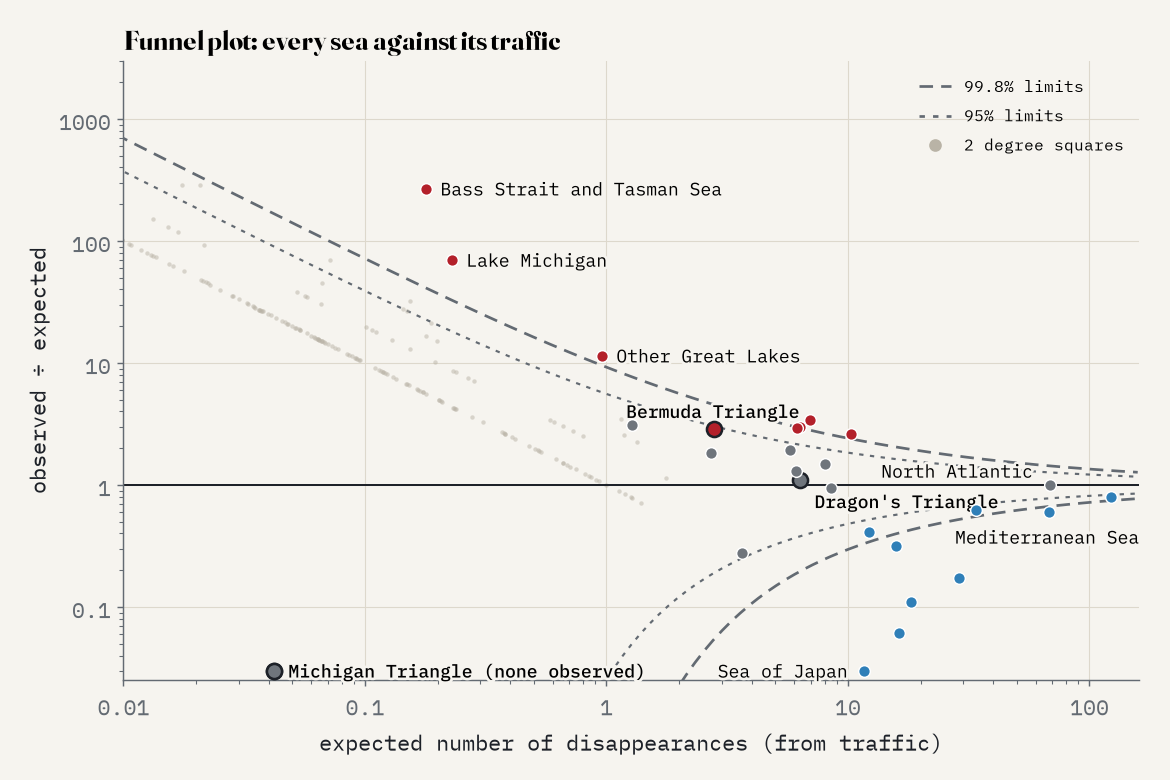
Some seas do stand far above their traffic, and none of them is a legend. Bass Strait and the Tasman Sea top the list, with 48 disappearances against 0.18 expected. Almost all are colonial schooners and packets lost in the 1800s between Sydney, Hobart, Launceston and Port Phillip, in one of the stormiest straits in the world, and they come from one lovingly compiled section of the list of missing ships. Lake Michigan follows (16 against 0.23), and the other Great Lakes: freighters lost in the November gales a century ago, when lake traffic was far busier than today. The English Channel’s excess is made of pioneer aviators, Battle of Britain pilots and Glenn Miller. The Grand Banks have fog, ice and the transatlantic flights of 1927. Weather, shoals, war, old trade routes and who wrote it down: that covers them all.
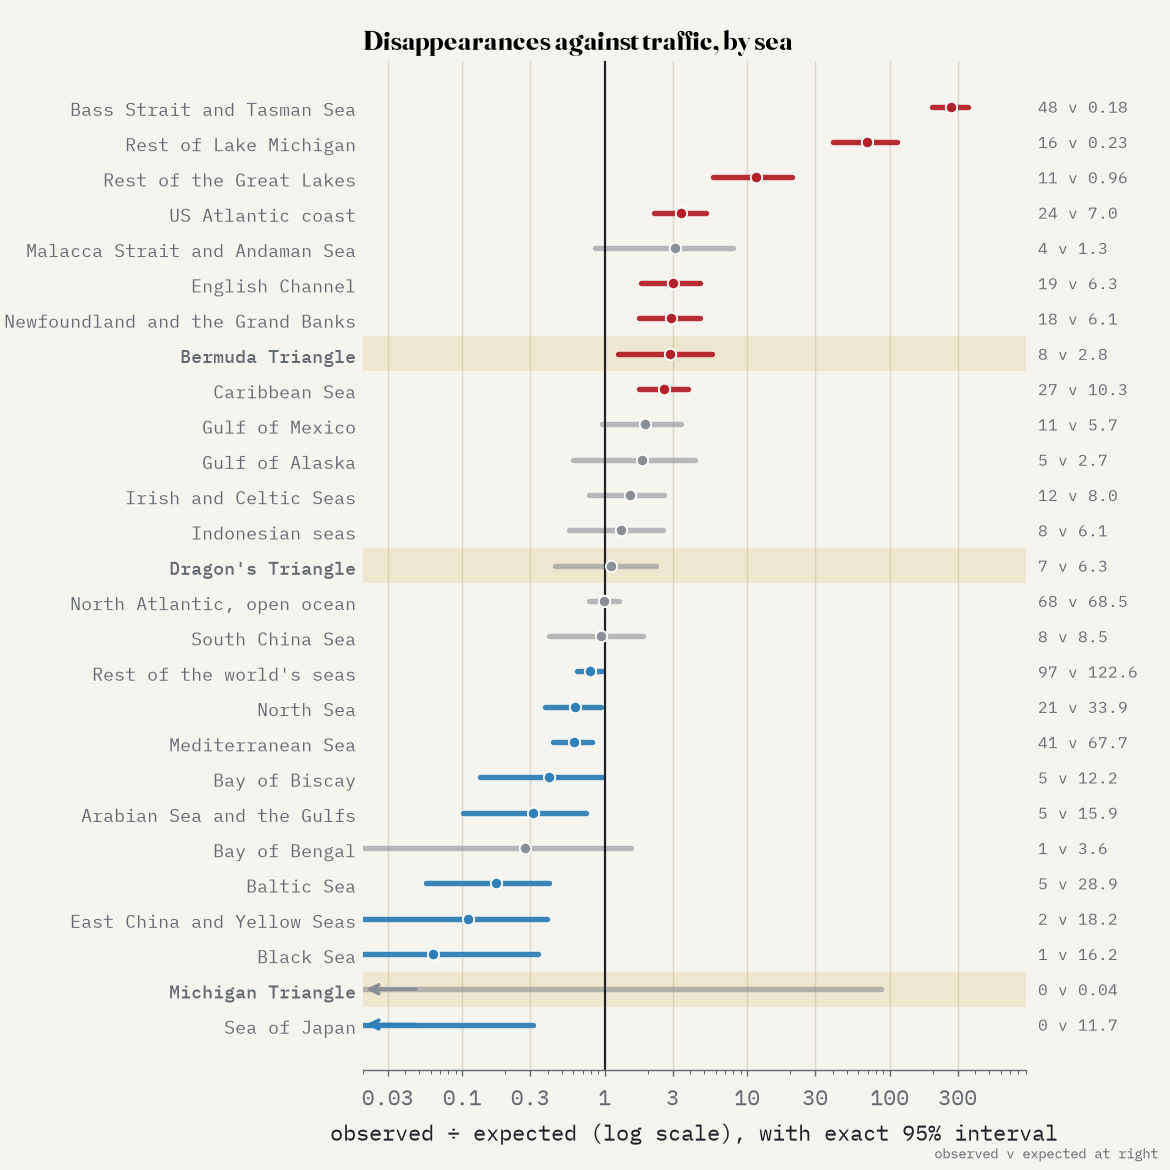
The other two triangles fare no better than Bermuda. The Dragon’s Triangle south of Tokyo holds 7 disappearances against 6.3 expected, exactly what its busy shipping predicts, and its most famous victim, the research ship Kaiyo Maru No. 5, was destroyed by the undersea volcano she had gone to study. By my placing, the Michigan Triangle contains none of the incidents in its own article, though most are within a few tens of kilometres.
How I did this
I parsed the Wikipedia tables with Python and placed each incident with a gazetteer of 359 ports, capes and islands and 58 seas that I built by hand, correcting 134 cases by hand. Traffic is the World Bank’s Global Shipping Traffic Density, summed over each sea; because AIS favours coasts with dense receivers, I repeated every test with a second traffic index, and with the 17,224 recorded wrecks that have a position as a historical yardstick. The intervals are exact Poisson intervals, and “clearly worse” means beyond the 99.8% limit of a funnel plot. The big caveats: these are famous disappearances, written about in English; many positions are rough; and modern traffic is only a proxy for where ships and planes went in the past. The interactive page has every sea, every dot and a funnel plot, and the paper has the details.
Notes and sources
- Wikipedia contributors, List of missing ships, List of missing aircraft, List of people who disappeared mysteriously at sea, Bermuda Triangle, Devil’s Sea and Lake Michigan Triangle (CC BY-SA 4.0). The catalogue derived from them is shared under the same licence with the data.
- World Bank, Global Shipping Traffic Density, produced by the IMF and World Bank from AIS data, 2015 to 2021 (Cerdeiro, Komaromi, Liu and Saeed 2020), CC BY 4.0.
- Recorded wrecks with a position: Wikipedia’s lists of shipwrecks (CC BY-SA 4.0) and Wikidata (CC0), as cleaned for my earlier study Shipwrecks of the world.
- Larry Kusche, The Bermuda Triangle Mystery: Solved (1975). Natural Earth outlines (public domain). Base map tiles on the interactive page © Esri.
- I wrote the text, with drafting and editing assistance from Claude (Anthropic), which also helped prepare the analysis code. I reviewed and checked all text and results.

