
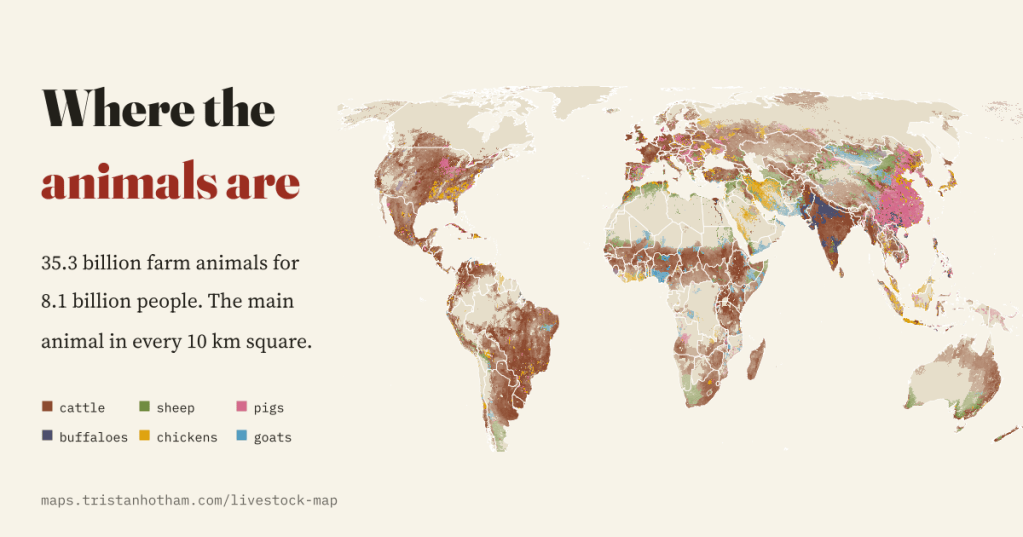
There are about 35.3 billion farm animals alive on Earth at any moment, 4.3 for every person. I mapped where they live, every 10 km, and how the herds and flocks have changed since 1961. Spoiler: it is the century of the chicken, and New Zealand is no longer the sheep country it was.
Ask someone to picture the world’s farm animals and you get a handful of postcards: sheep on a New Zealand hillside, cattle on the pampas, pigs in Denmark. I wanted the whole picture, so I put it on one map. The FAO’s Gridded Livestock of the World estimates how many cattle, buffaloes, sheep, goats, pigs, chickens, ducks and horses lived in every 10 km square in 2015, by spreading census counts across the land with a statistical model. FAOSTAT adds every country’s count of eighteen kinds of farm animal, every year from 1961 to 2024.
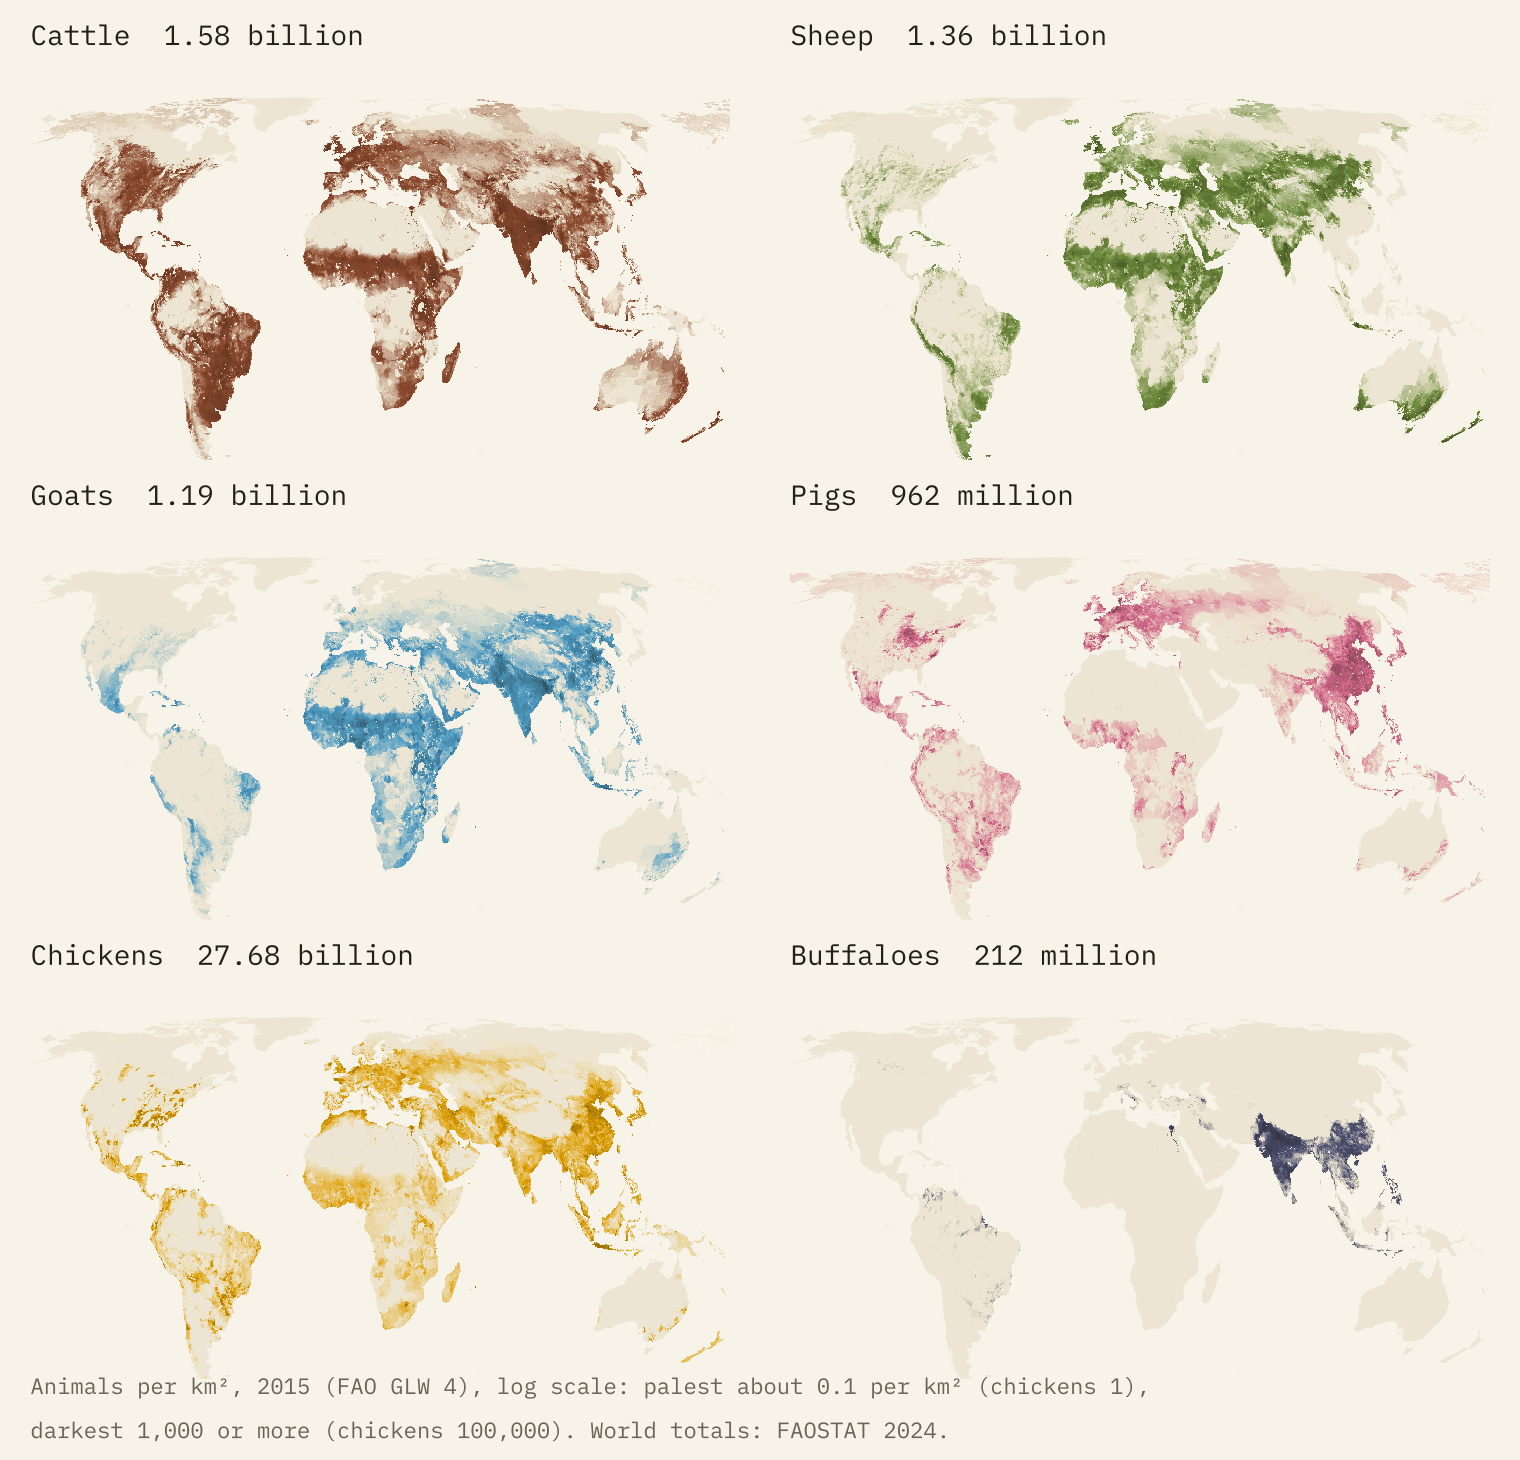
The headline numbers are startling on their own. In 2024 there were about 1.6 billion cattle, 1.4 billion sheep, 1.2 billion goats and 962 million pigs. And there were 27.7 billion chickens: 3.4 for every person on the planet.
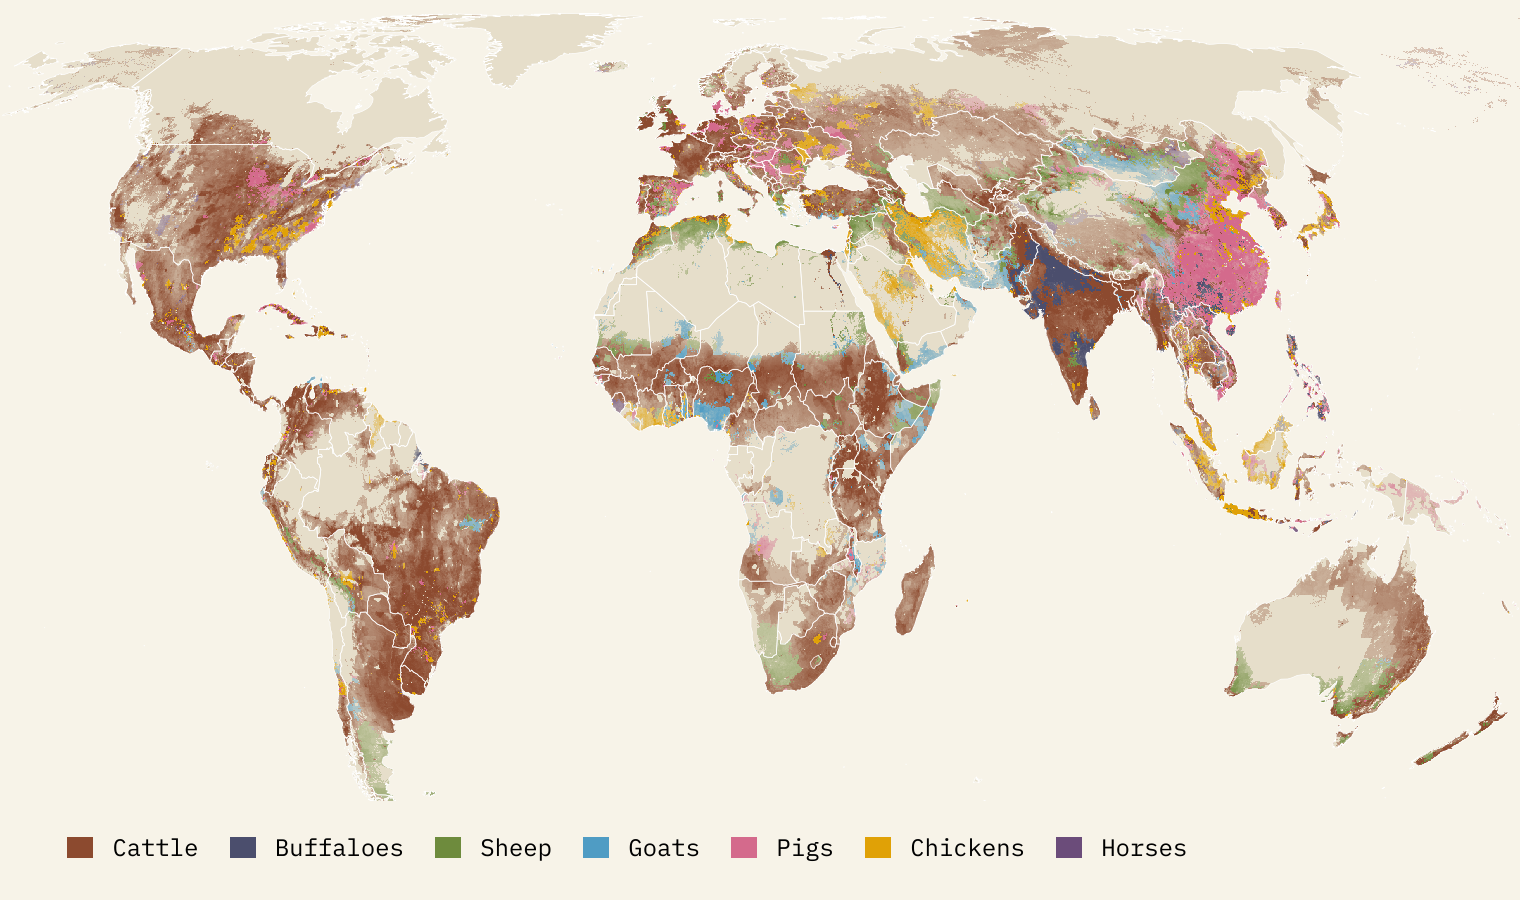
A world of cattle, with islands of pigs and sheep
To compare a cow with a chicken you need a common unit. Farm statisticians use livestock units, a rough measure of size and appetite: on FAOSTAT’s world averages a cow is about 0.64 of a unit, a sheep 0.10 and a chicken 0.01. Weighted that way, cattle are the main farm animal in 127 of 194 countries and lead on 42% of the world’s land. The exceptions are the interesting part: the great pig belt of eastern China, buffaloes along the Ganges and the Indus, sheep in Patagonia, the Karoo and Wales, goats on the edge of the Sahel.
The chicken century
Since 1961 the number of people has grown 2.7 times. Chickens have grown 7.1 times, from 3.9 billion to 27.7 billion, and ducks 6.6 times. Goats have more than tripled, mostly in Africa and Asia. Cattle grew more slowly than people, so there are fewer per head than there were: 0.31 per person in 1961, 0.19 now. Horses and mules, the old working animals, have declined.
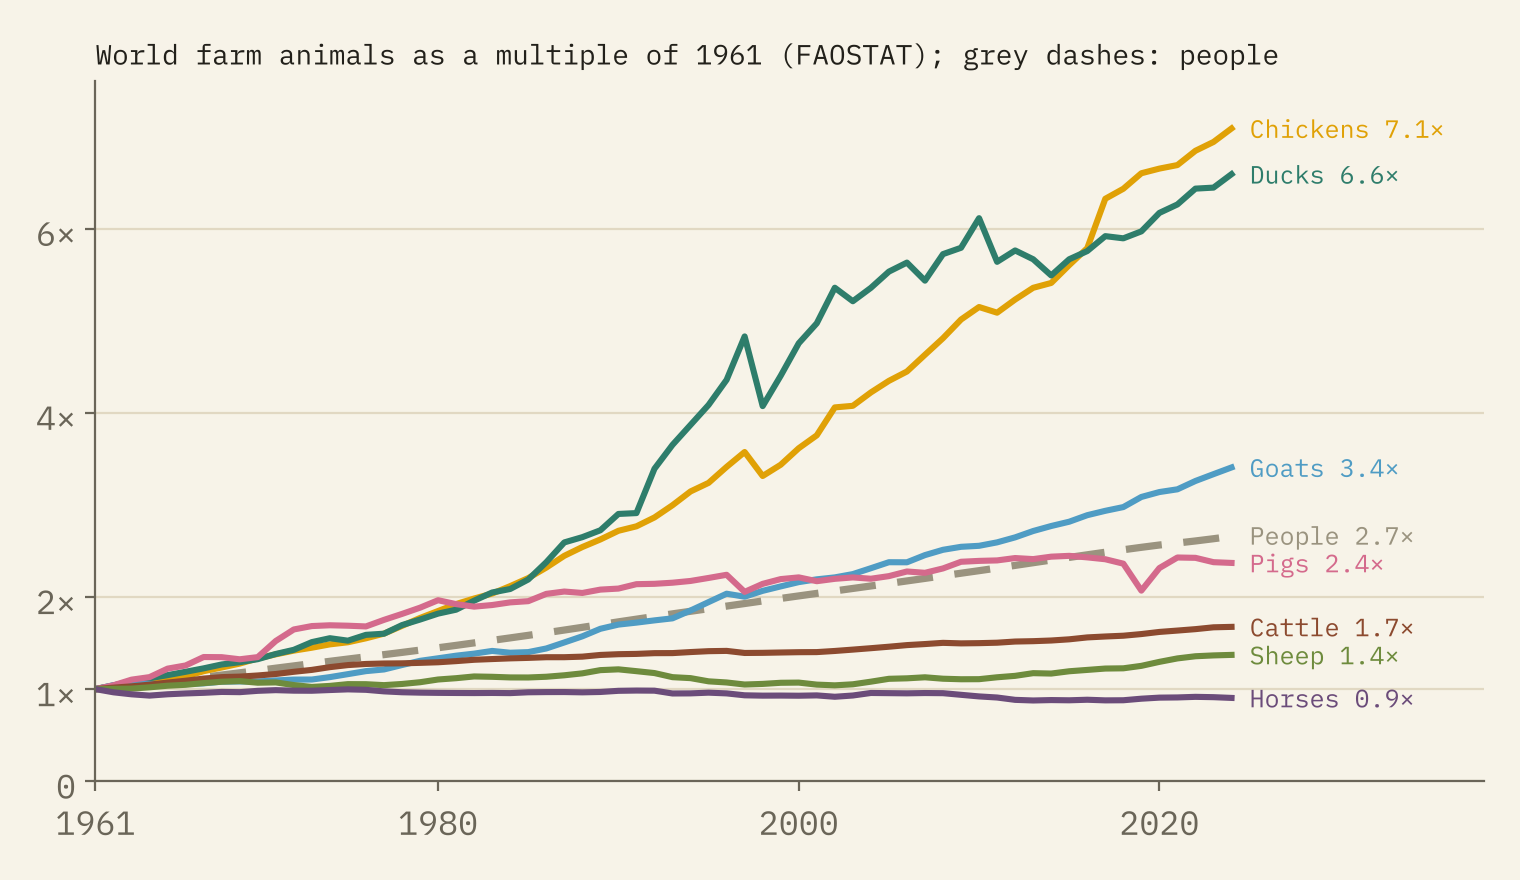
Look closely at the pig line and there is a notch in 2019. That is African swine fever in China, where the pig herd fell by 28% in a single year, about 118 million pigs. It was enough to knock 12% off the whole world’s total. China’s herd has since recovered.
Where animals outnumber people
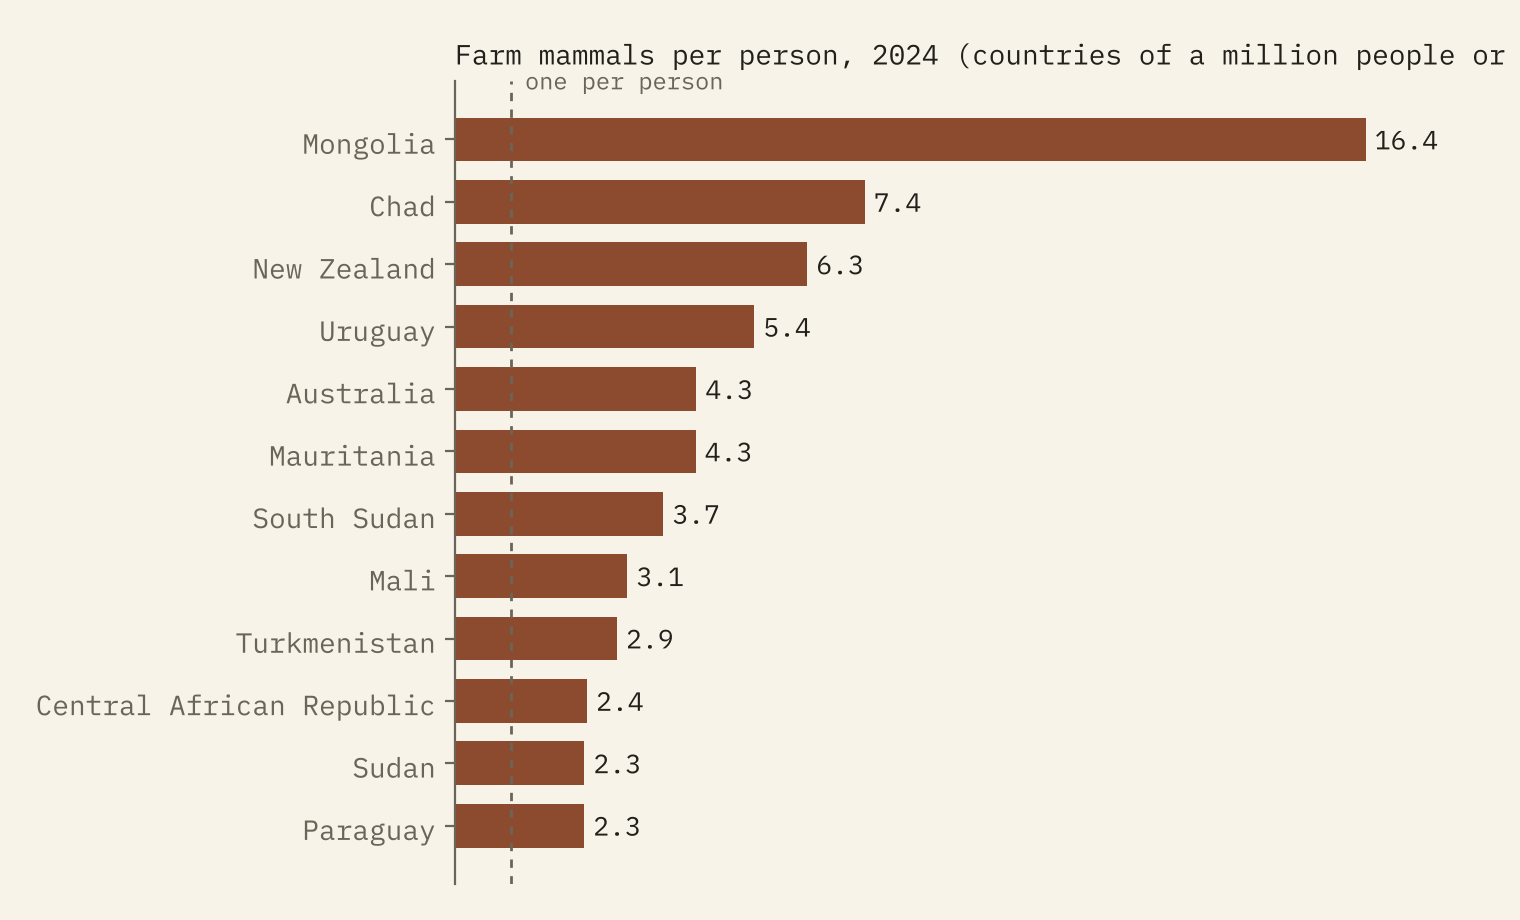
In 40 of the 159 countries with at least a million people, farm mammals outnumber humans. Mongolia is in a league of its own, with 16.4 sheep, goats, cattle, horses and camels for every person. Chad, New Zealand, Uruguay and Australia follow. Uruguay has 3.5 cattle per person, the most anywhere, and Denmark is the only sizeable country with more pigs than people.
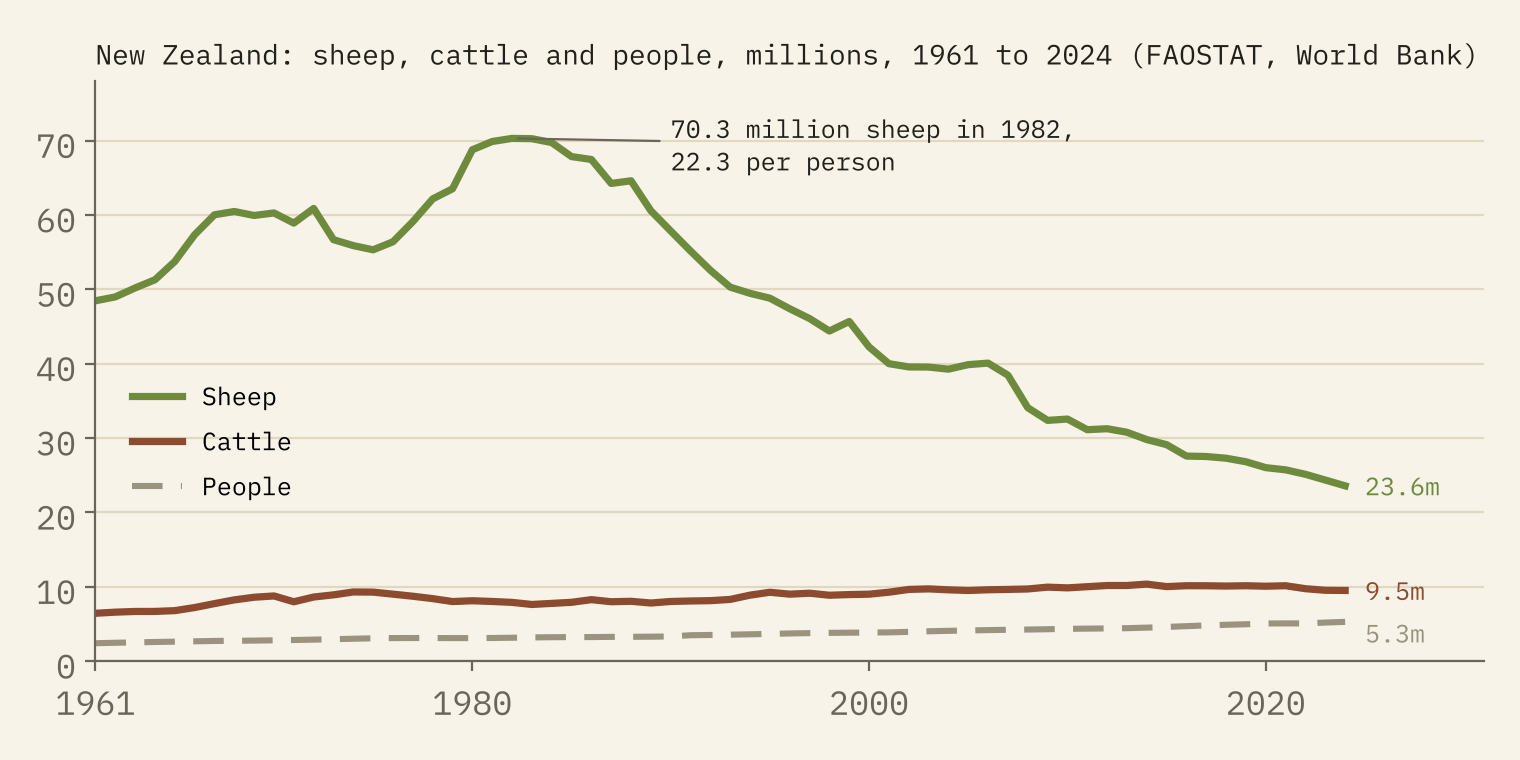
And then there is New Zealand, home of a thousand sheep jokes. Its flock peaked in 1982 at 70.3 million, 22.3 sheep for every New Zealander. Today it is 23.6 million, 4.5 per person, down 66%. Still a lot of sheep, but the joke is now forty years out of date.
Half of the world’s pigs live on 1.3% of its land. Half of its cattle need 5.9%.
One country’s pigs, another’s buffaloes
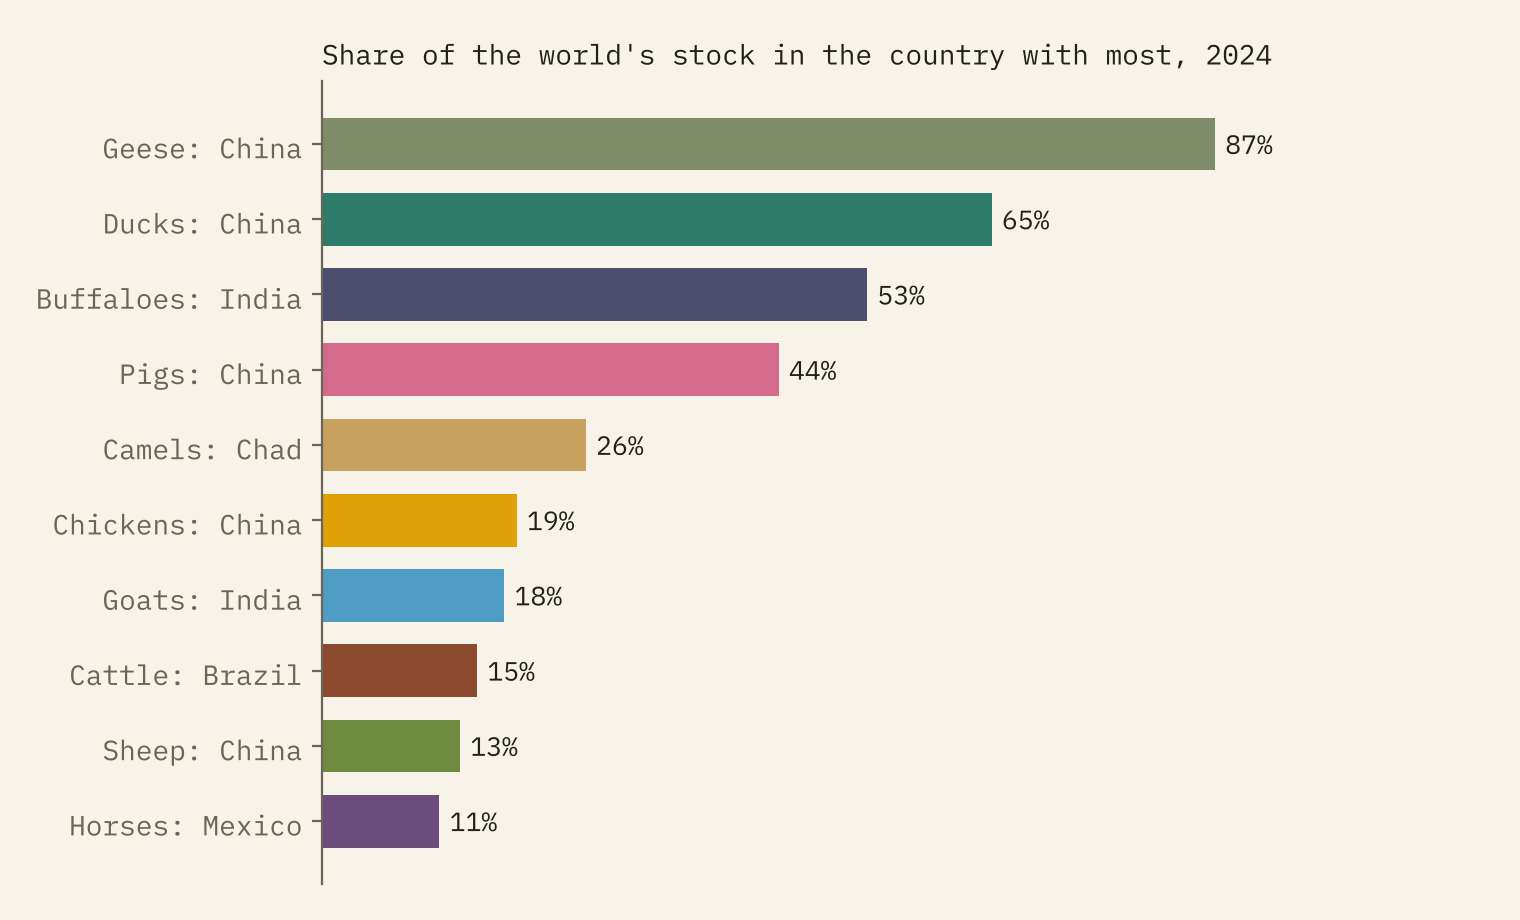
Some animals belong mostly to one country. China has 44% of the world’s pigs, 65% of its ducks and 87% of its geese. India has 53% of the buffaloes. A quarter of all camels live in Chad. Grazing animals are shared more widely: the biggest cattle herd, Brazil’s, is 15% of the world’s. On the ground the same split appears. Pigs and chickens crowd together in sheds near feed and cities; cattle and sheep spread out over grass and hill.
Britain and Ireland: sheep hills and pig plains
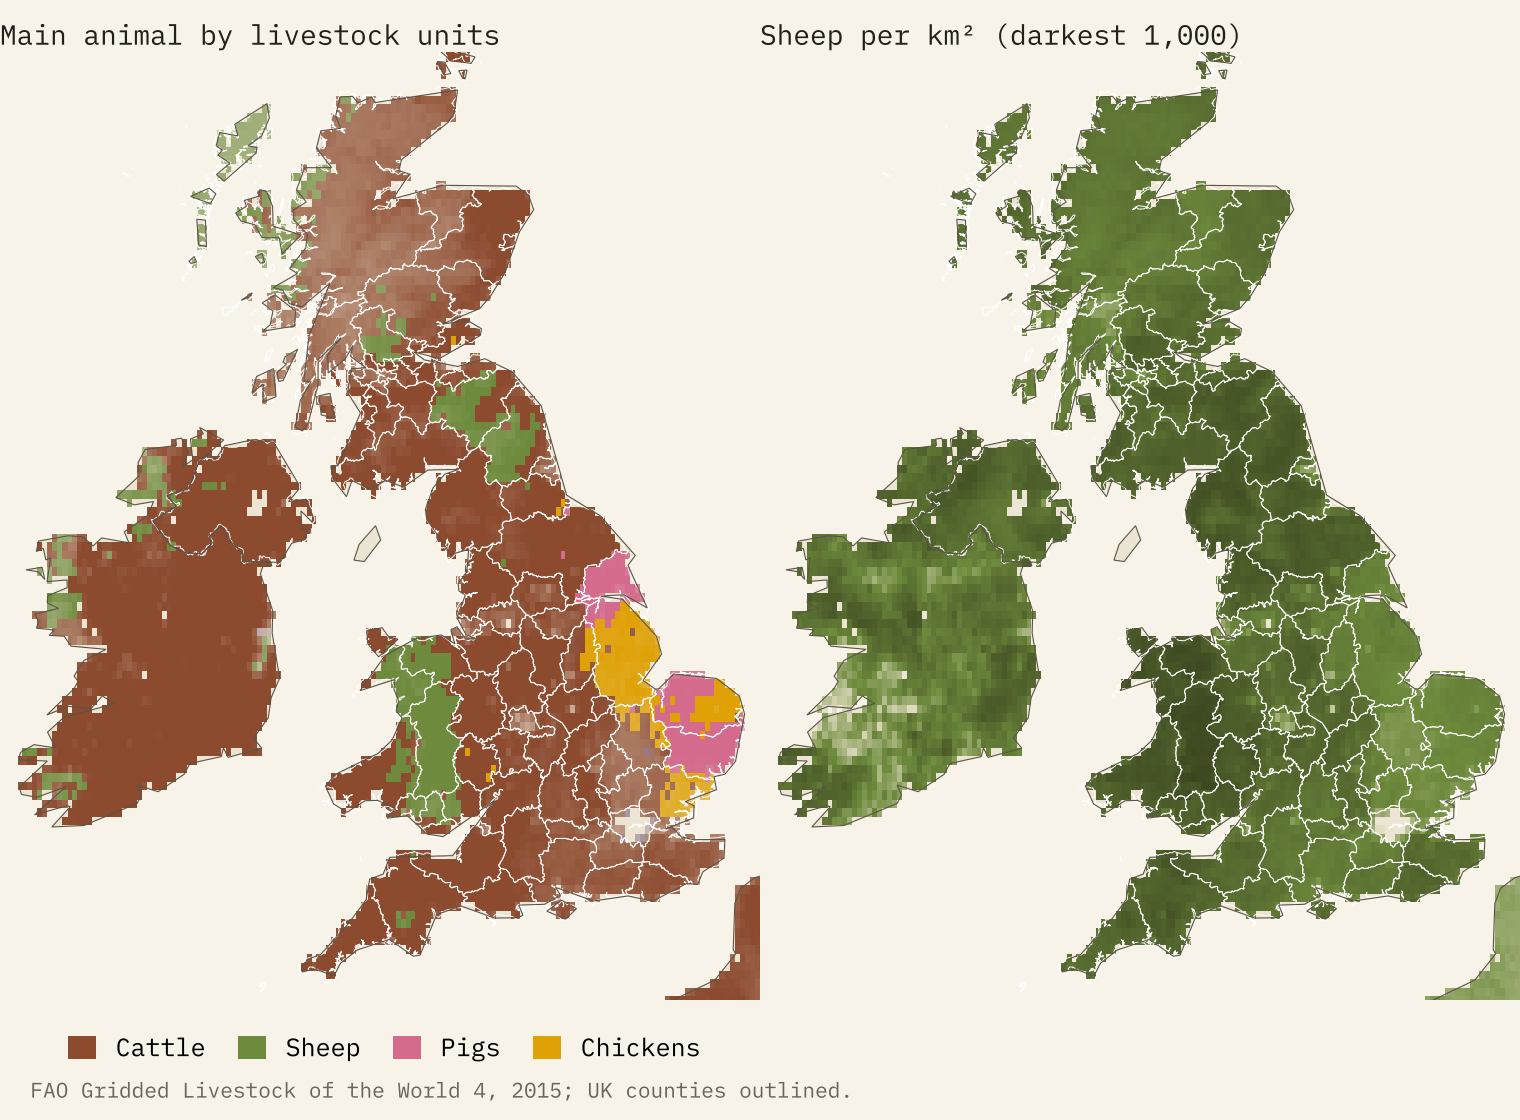
Closer to home, the United Kingdom has 31.0 million sheep, more than any other European country except Turkey, but fewer sheep than people these days (0.45 each). The map splits the country by its hills. Wales has 9% of the UK’s land and 26% of its sheep, and Powys alone has 10% of them, around 663 for every square kilometre. Cattle are densest in Northern Ireland and the dairy country of Cheshire, Cornwall and Somerset. Pigs and chickens belong to the flat east: the East Riding of Yorkshire, Norfolk and Suffolk for pigs, Lincolnshire and, out west, Herefordshire for chickens. Across the Irish Sea, Ireland has 1.2 cattle for every person.
How I did this
The 10 km map is the FAO’s Gridded Livestock of the World, version 4, for 2015: census counts from thousands of districts, shared among the squares inside each district by a random forest model of where animals are likely to be. It is a model, so the detail within each census district is an estimate, and the map is a snapshot of 2015. The country counts are FAOSTAT’s ‘stocks’, the number of animals alive at one time, from 1961 to 2024, set against World Bank population. To find each place’s main animal I used FAOSTAT’s own livestock unit factors for each country. These are animals alive at once, not animals raised in a year: a broiler chicken lives only a few weeks, so many more are raised each year. Wild animals, reindeer and fish are not included. The paper has every step and caveat.
Notes and sources
- Gilbert, M. et al. (2018) Global distribution data for cattle, buffaloes, horses, sheep, goats, pigs, chickens and ducks in 2010, Scientific Data. Gridded Livestock of the World v4, 2015 layers, Harvard Dataverse. CC BY 4.0.
- FAOSTAT: crops and livestock products, livestock patterns and land use. FAO, CC BY 4.0.
- World Bank, total population, via datasets/population. CC BY 4.0.
- Natural Earth countries and places (public domain); UK counties from ONS boundaries (Open Government Licence).
- I wrote the text, with drafting and editing assistance from Claude (Anthropic), which also helped prepare the analysis code. I reviewed and checked all text and results.

