
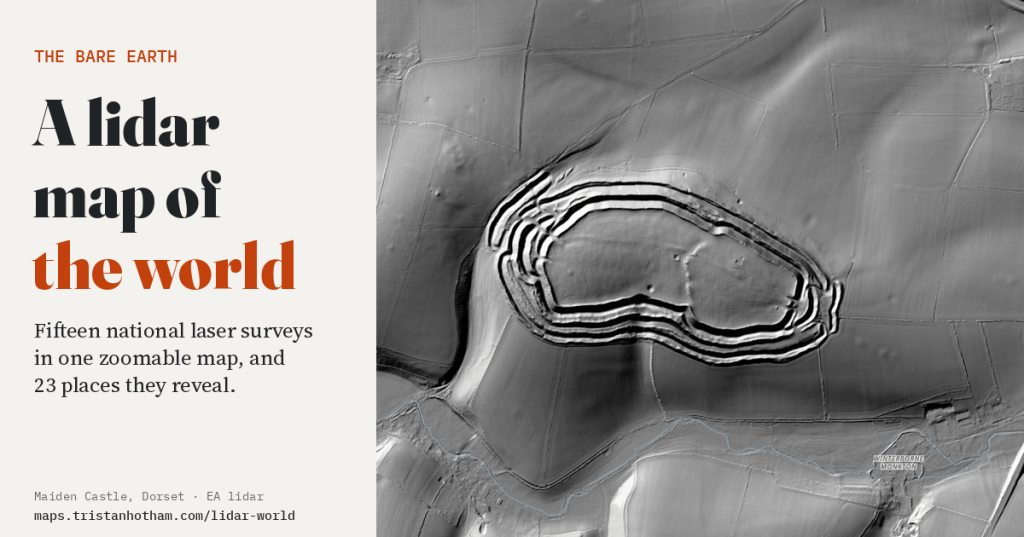
Take away every tree, field of wheat and building, light what is left from one side, and the ground turns out to be full of things. I put fifteen countries’ lidar surveys into one map of the world, so you can fly from a Neolithic flint mine in Norfolk to the shell holes of Verdun to the largest burial mound in Japan, and see each one the way the lasers do.
Lidar is a laser fired from an aircraft hundreds of thousands of times a second. Each pulse comes back from whatever it hits first, and the time it takes gives a height. Most pulses hit leaves, roofs and crops, but some slip through the gaps and reach the ground. Keep only those and you get the bare earth: the land as it would look if everything standing on it were lifted off. Shade it as if lit by a lamp at the top left of the map and every bank, ditch and hollow throws a shadow.
A lot of countries have now flown the whole of their territory, and a growing number publish the results for anyone to use. What they rarely do is publish them in one place. So I joined fifteen of them, England, Flanders, the Netherlands, France, two German states, Czechia, Austria, Switzerland, Slovenia, Luxembourg, Spain, Norway, Japan and the United States, over a shaded relief of the whole Earth. Zoom into any of them and the national survey takes over.
Rings, holes and lines
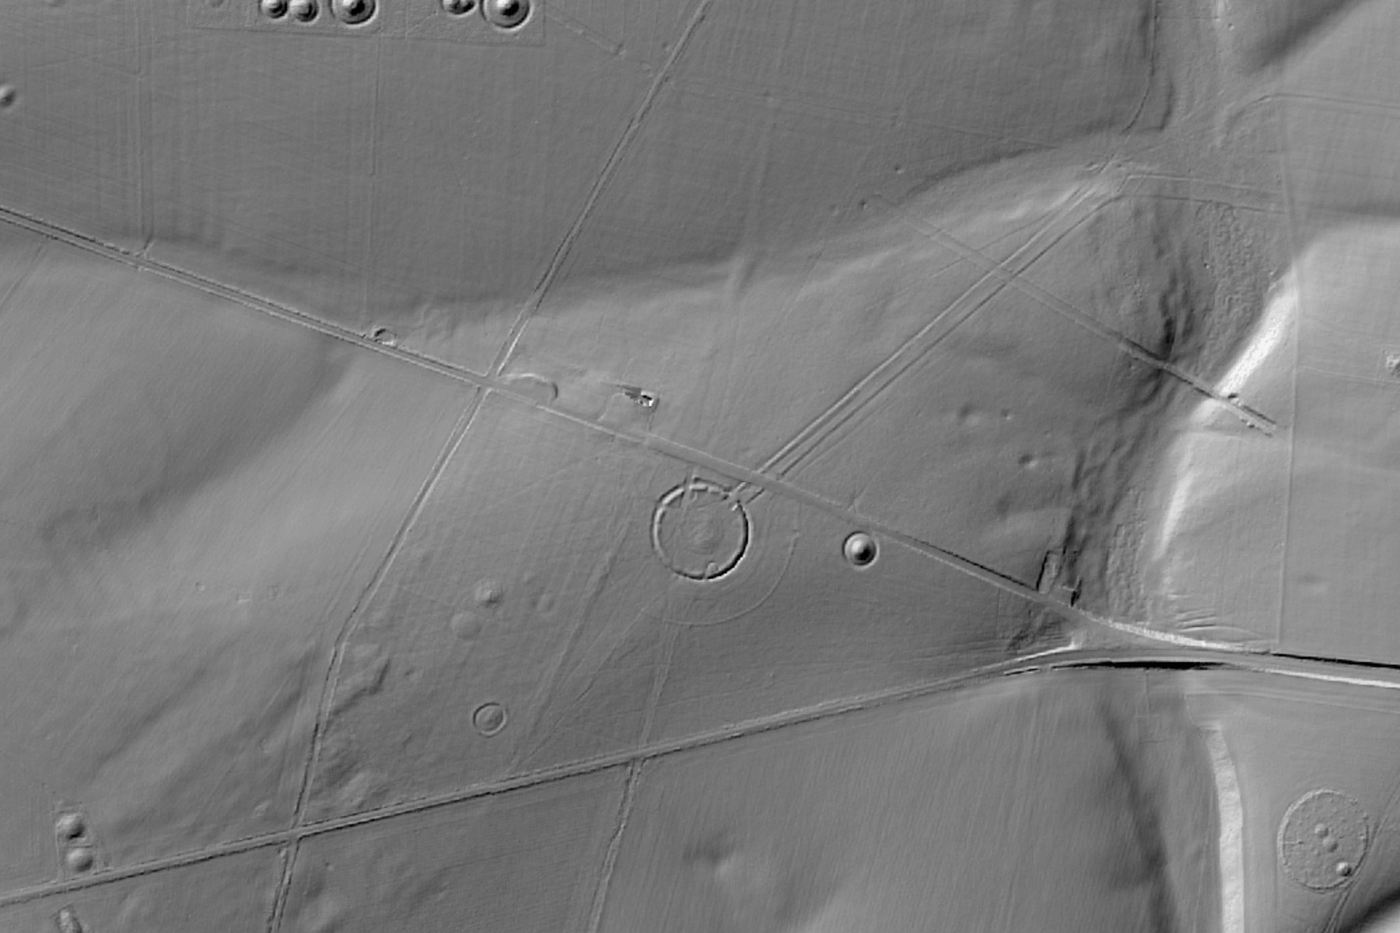
Some places look better than any photograph. Maiden Castle in Dorset, one of the largest Iron Age hillforts in Europe, is a stack of concentric ramparts with twisting gates at each end. At Stonehenge the stones are almost the least of it: round barrows crowd every ridge, and the long Cursus, older than the stones, runs across the downs to the north.
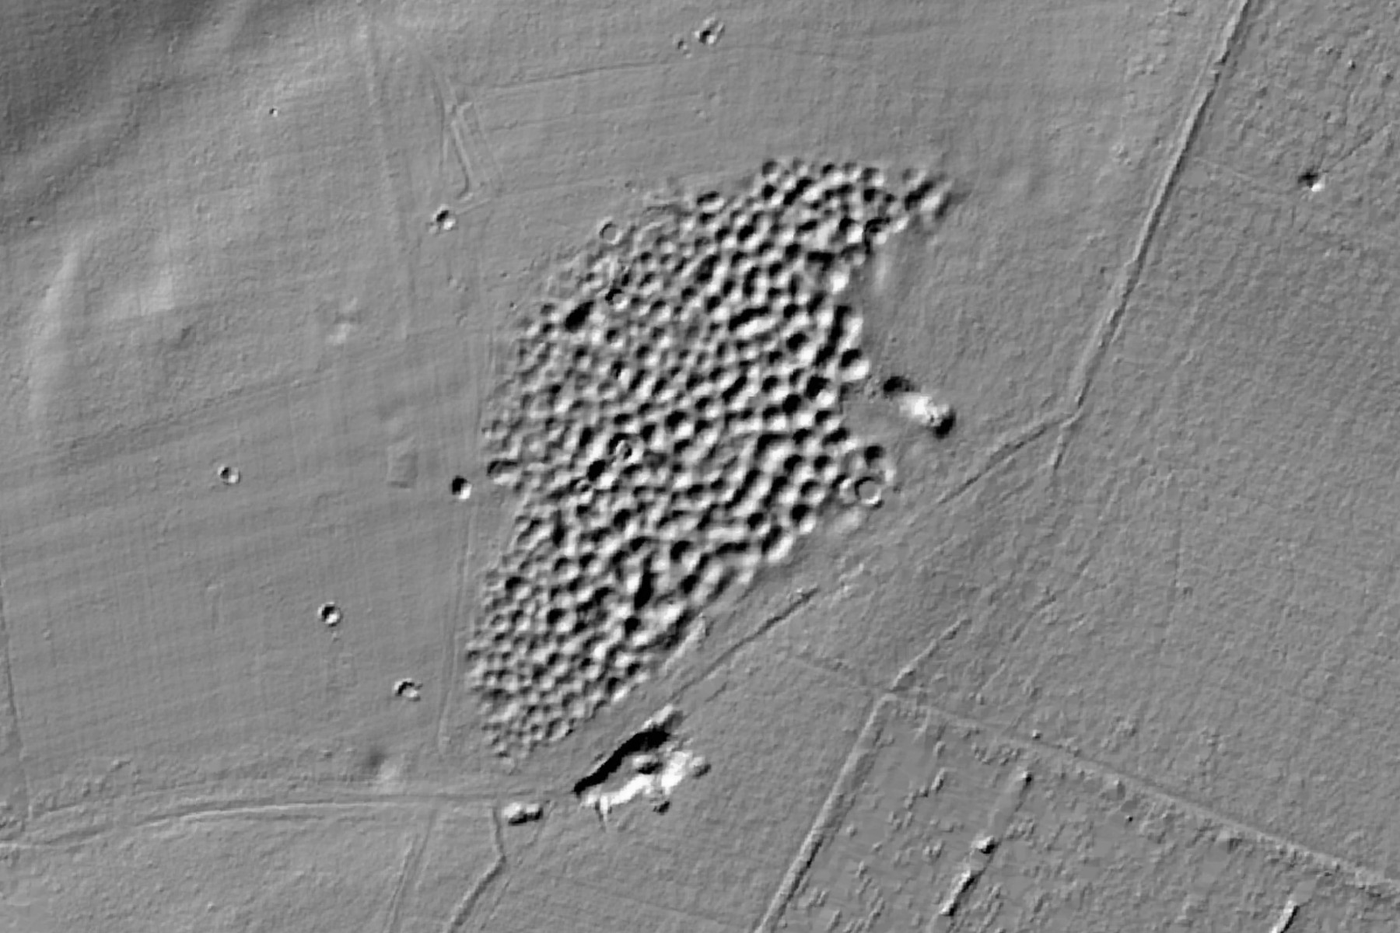
In the Norfolk heath, Grime’s Graves looks like the surface of the moon. Each hollow is the filled-in top of a Neolithic flint mine, and there are more than 400 of them, dug about 4,500 years ago to reach the best flint deep in the chalk.
The war is still in the ground
The First World War left marks that a century of farming and forestry has not erased. On 7 June 1917 British tunnellers fired 19 mines under the German lines on the Messines Ridge in Flanders; the crater at Spanbroekmolen is now a pond called the Pool of Peace, and the Flemish lidar, at a quarter of a metre, shows the ring of earth the blast threw up. At Hill 60 the ground is turned inside out. At Vimy Ridge, under the trees of the Canadian memorial park, shell holes lie lip to lip.
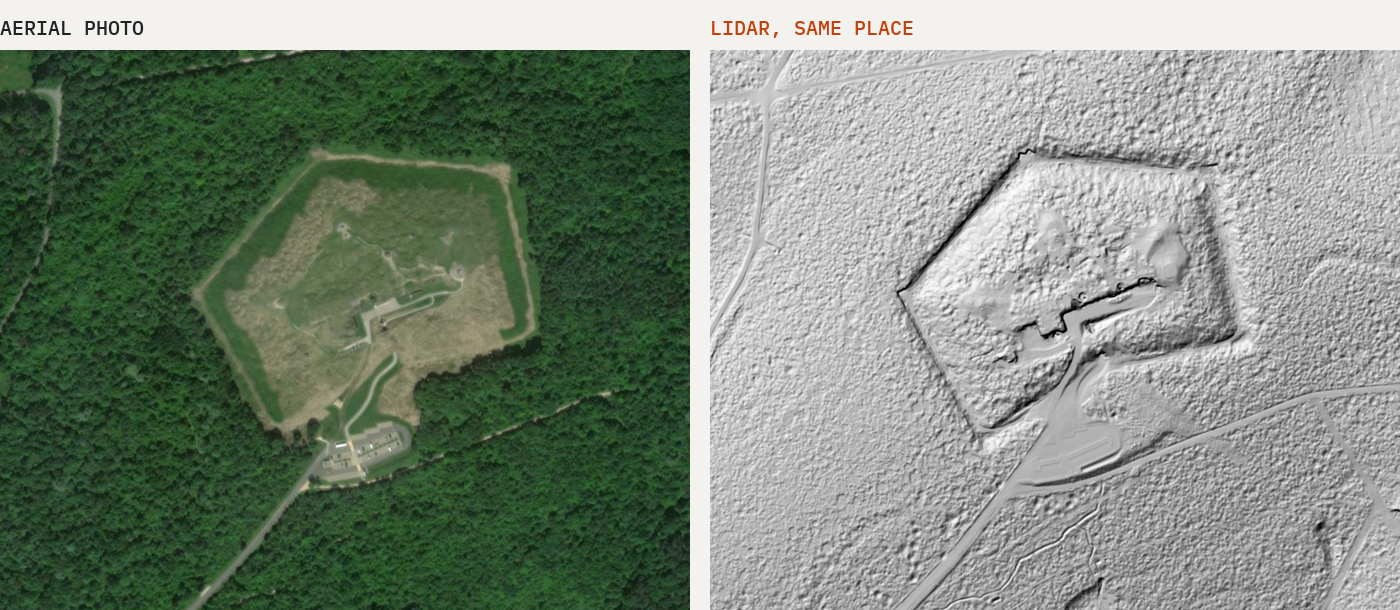
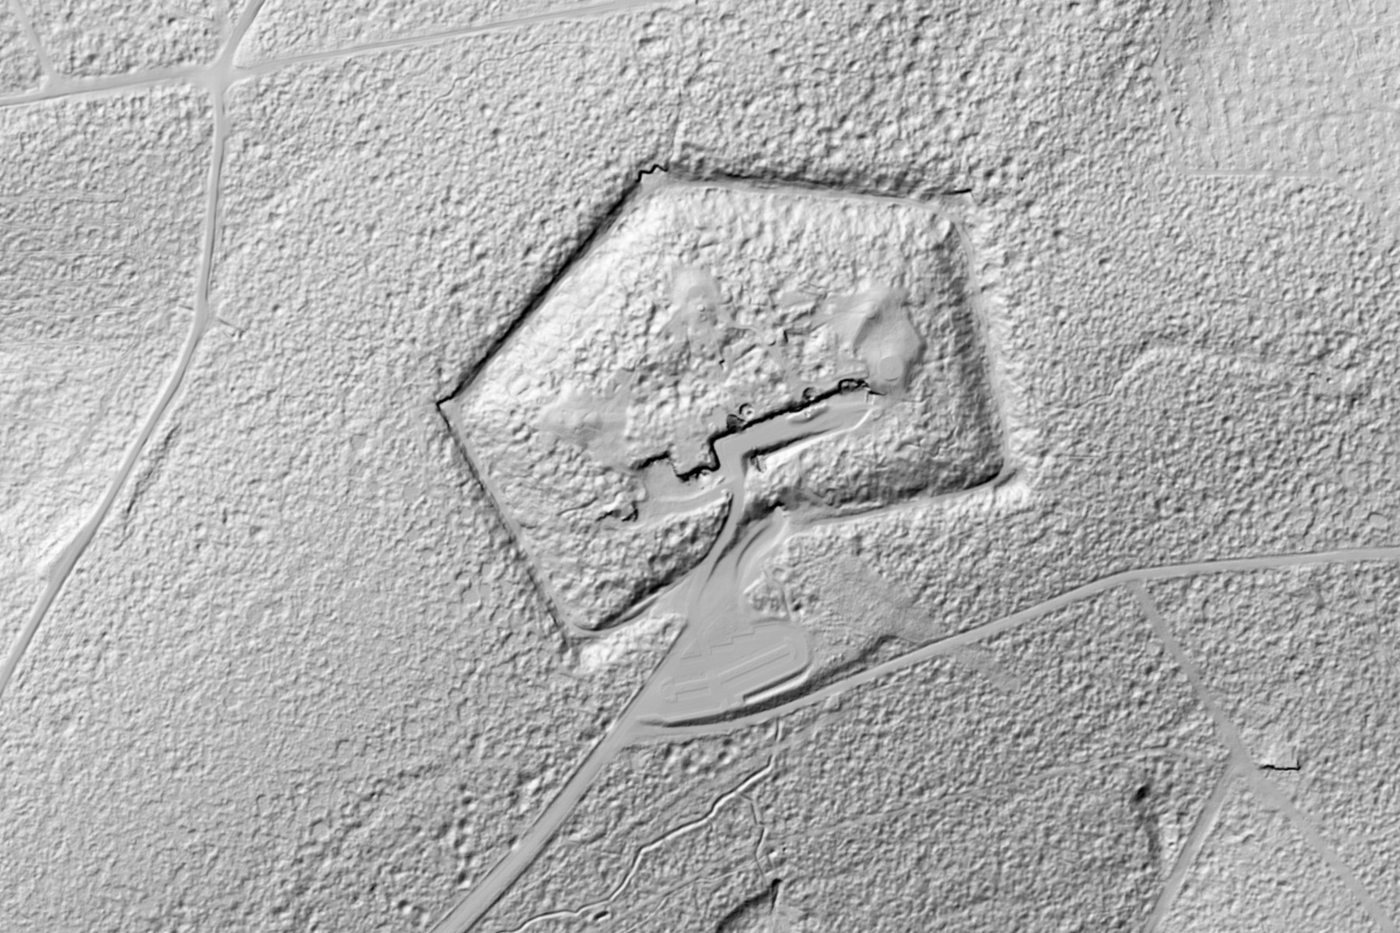
Verdun is the hardest to look at. The battle of 1916 churned the ground so badly that much of it was never farmed again and was planted with trees instead. From the air it is forest. In the French LiDAR HD survey, at half a metre, the forest floor is cratered from edge to edge.
Tombs, mines and karst
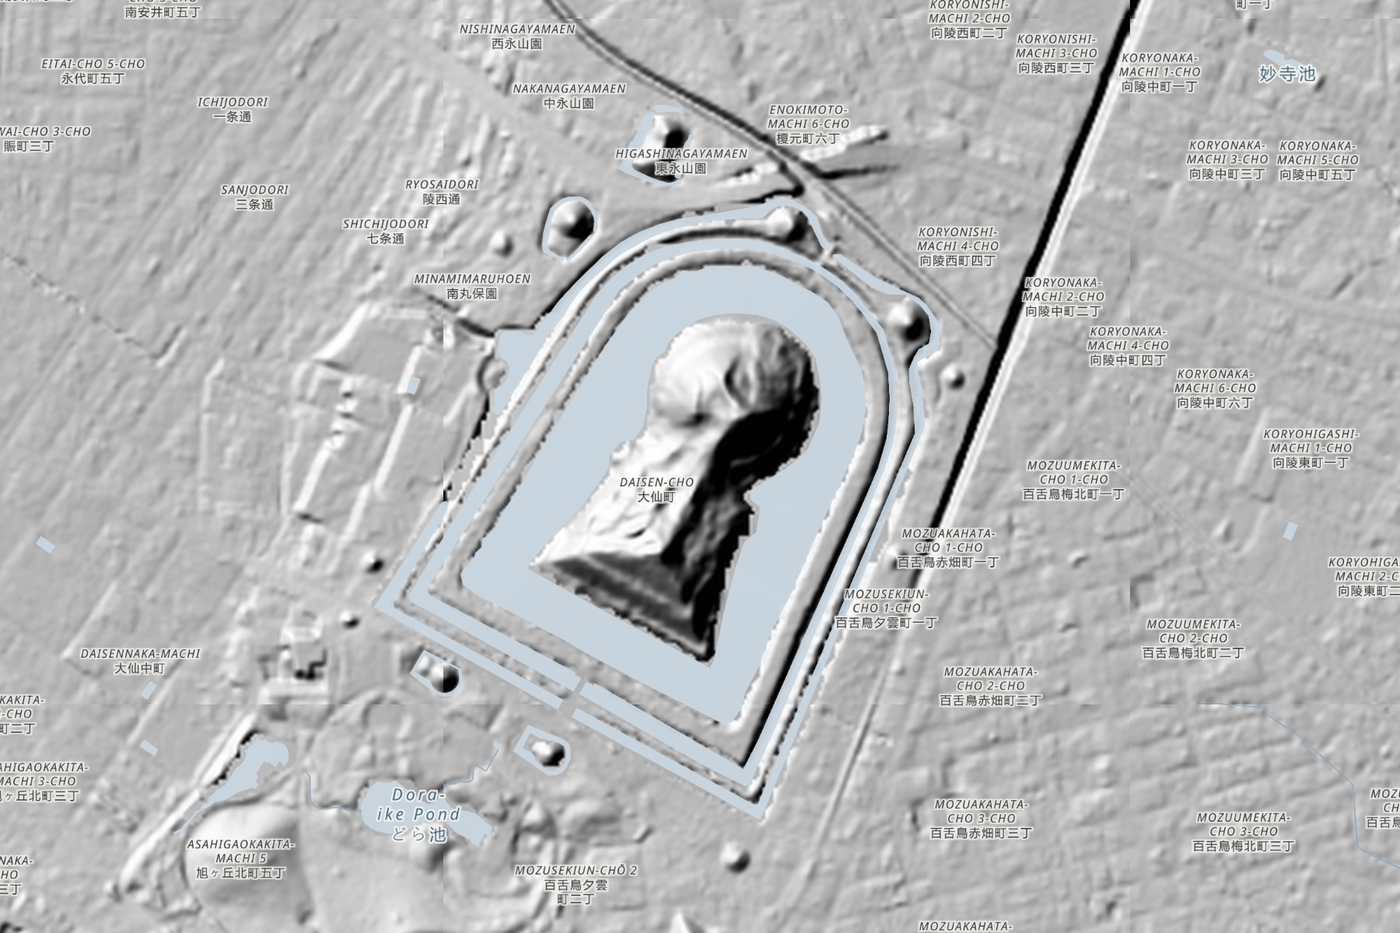
Further away the finds change but the trick is the same. Daisen Kofun in Sakai, attributed to the Emperor Nintoku, is a keyhole-shaped mound about 486 metres long, the largest in Japan, and closed to visitors; from above, its moats and its shape are unmistakable. At Cahokia in Illinois, Monks Mound, built of earth carried in baskets, is still the largest prehistoric earthwork in the Americas. At Las Médulas in Spain, Roman engineers brought down whole hillsides with water to wash out the gold.
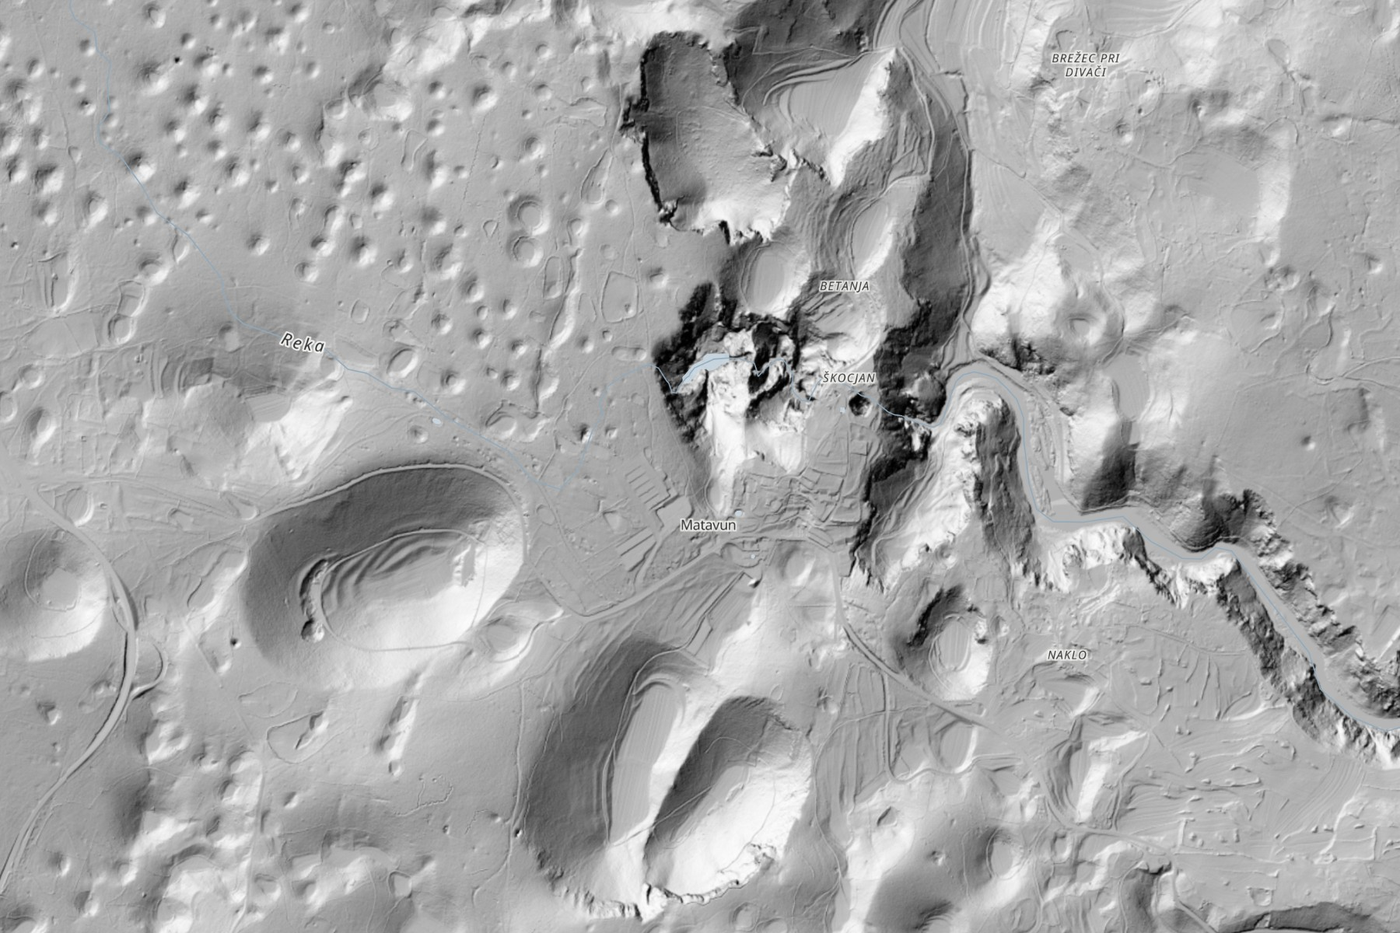
In Slovenia the land itself is the find. The Karst plateau gave the world the word karst: rain dissolves the limestone from beneath, and the surface is pocked with sinkholes, including the great collapse dolines above the Škocjan Caves.
Where the ground moved
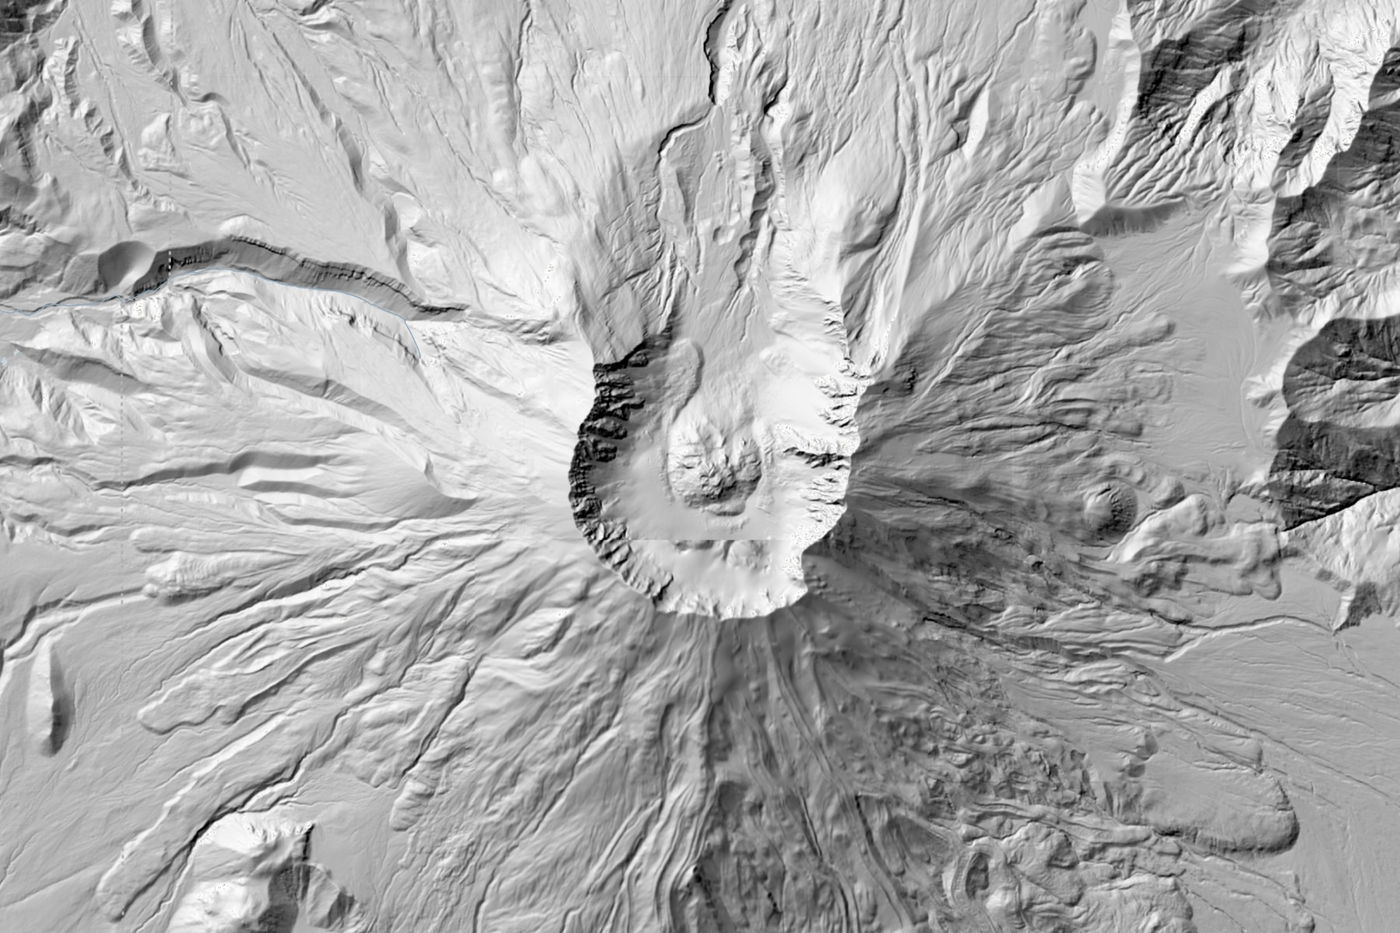
Three of the places are landslides. The Rossberg slid into the valley at Goldau in Switzerland in 1806, killing 457 people. In 2014 a hillside at Oso in Washington State collapsed and killed 43; lidar flown before the slide had already shown older landslides there. And at Mount St Helens, the collapse of the north face in 1980 was the largest landslide on record; lidar shows the horseshoe crater and the new dome inside it more clearly than any photograph.
The gaps
The map is only as complete as what agencies publish in a form a web page can load. Scotland, Wales, Ireland, Denmark, Sweden, Finland and New Zealand all have national lidar that anyone can download, but either publish no shaded version, publish it only to users with a key, or serve it in a way other websites are not allowed to use. There, the map falls back to the world relief, which is far coarser. If you run one of those services and fancy adding a shaded layer with open access, I would love to add it.
How it was made
Nothing is copied or stored. As you pan and zoom, the page asks each agency’s own open map service for its shaded relief, using the standard web map formats public bodies publish, and draws it with MapLibre over Esri’s World Hillshade. Each national layer is clipped to an outline of its country from Natural Earth. I checked every service’s licence, and checked every gallery place on the map and against its Wikipedia article. Turn on the aerial photo layer and drag its strength up and down to see how much the lasers find that the camera misses.
Open the map at maps.tristanhotham.com/lidar-world. The paper is on Zenodo and the code on GitHub.

