
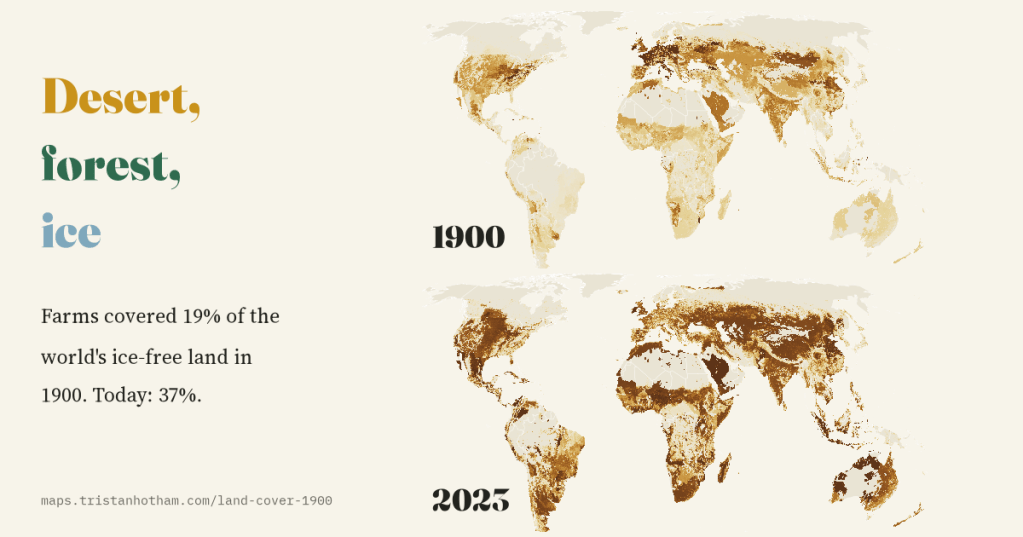
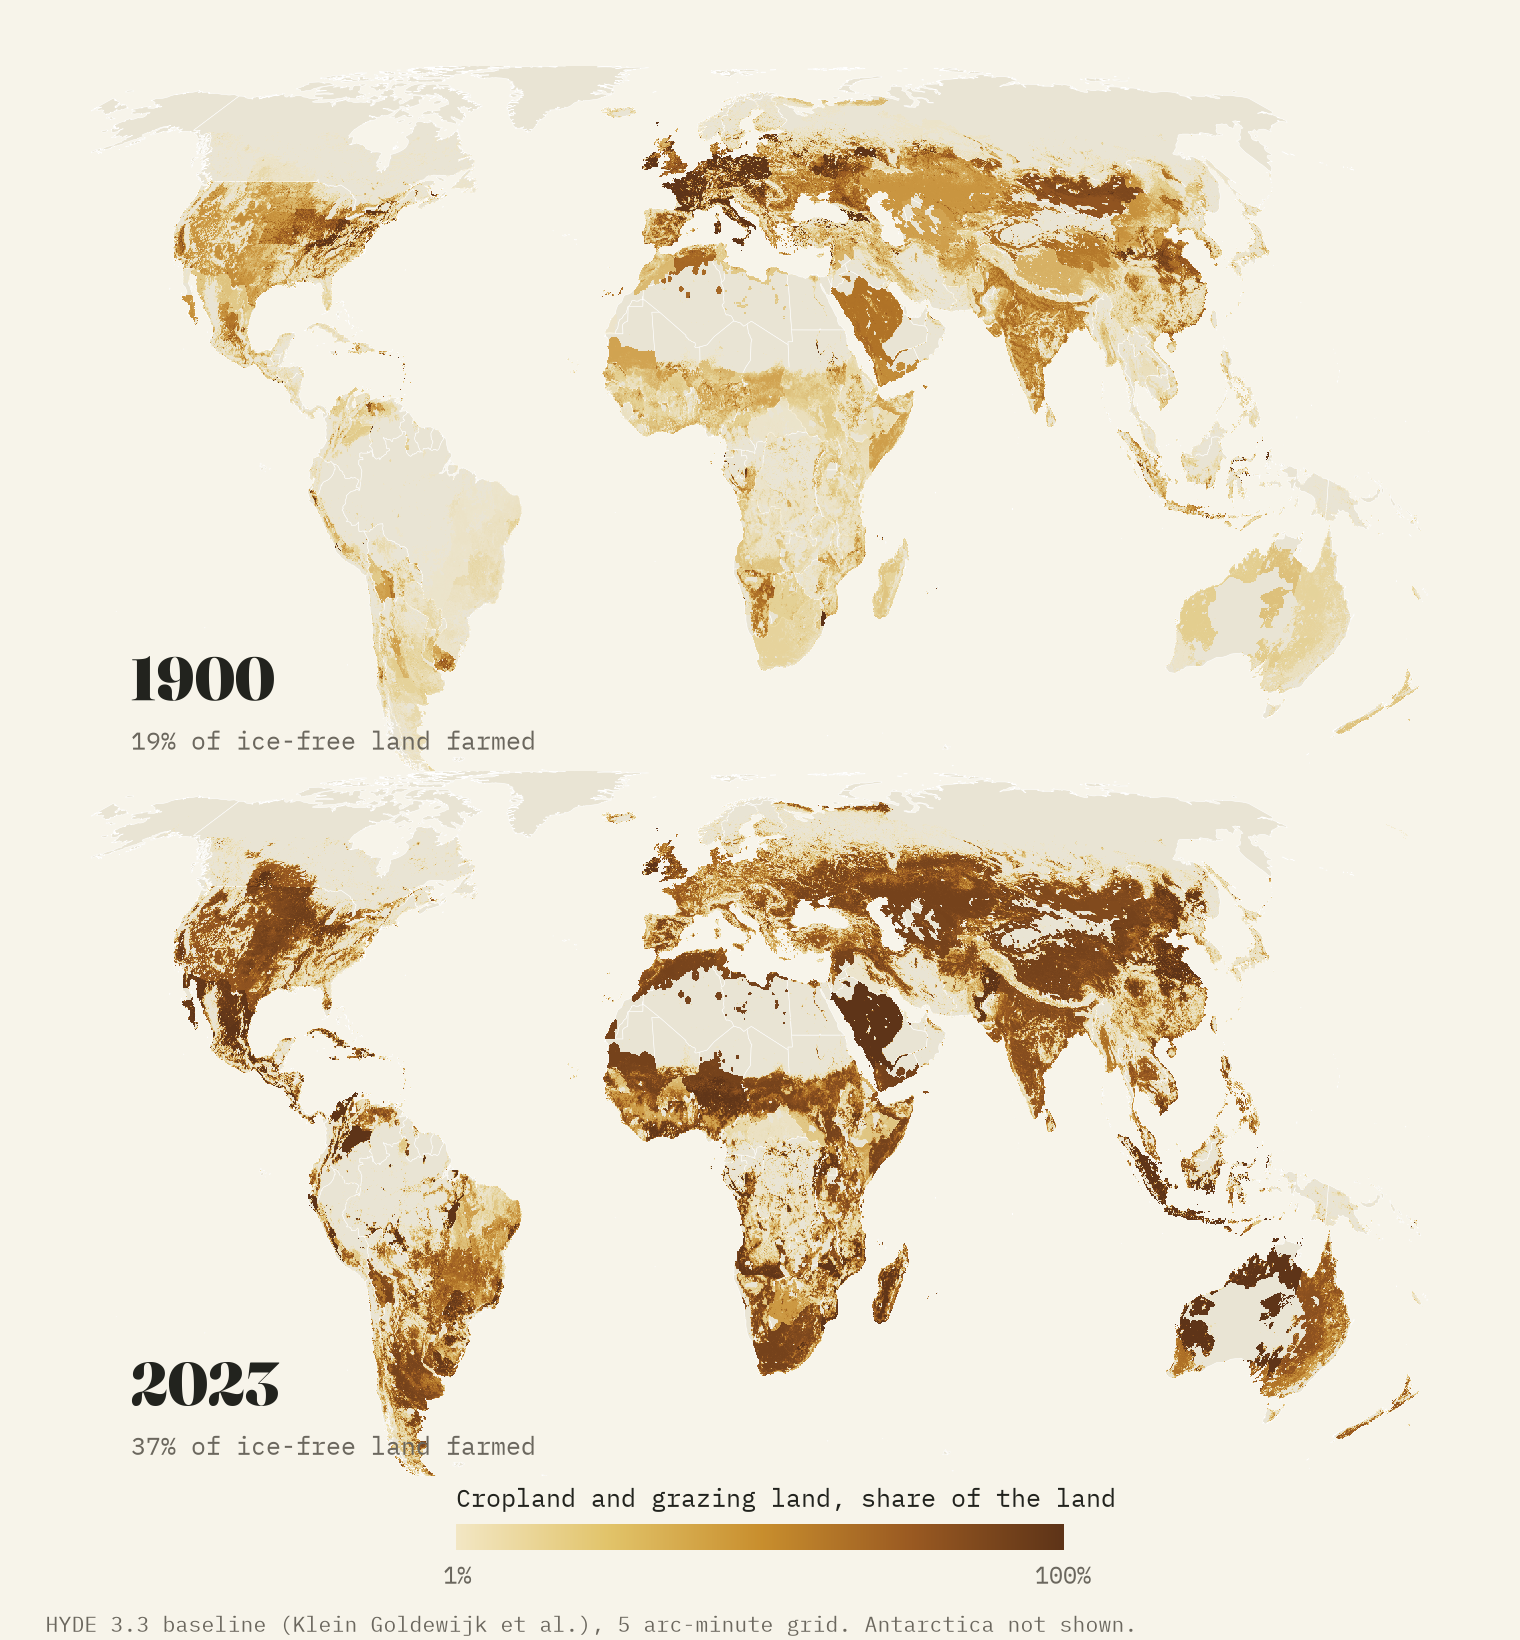
In 1900 farms covered about a fifth of the world’s ice-free land. Today they cover more than a third. I put the two maps side by side to see where the new fields and pastures came from, which forests went, and where the trees came back.
I have always liked old atlases, the ones with the world’s “chief products” stamped across each continent. They made me wonder what the land itself looked like around 1900. Railways and steamships already tied the continents together, and the prairies, the Pampas and the steppe of southern Russia were being ploughed for wheat. But the Brazilian Cerrado was still open savanna, the forests of Sumatra and Borneo were largely intact, and Europe was farmed harder than it is today.
Nobody mapped the world’s fields in 1900, but historians of land use have reconstructed them. The best open reconstruction is HYDE, the History Database of the Global Environment, built at Utrecht University. Its latest version, 3.3, estimates cropland, pasture and rangeland on a grid of about 9 km for every period back to 10,000 BCE. I took its maps for 1900 and 2023 and laid one over the other.
Farmland doubled
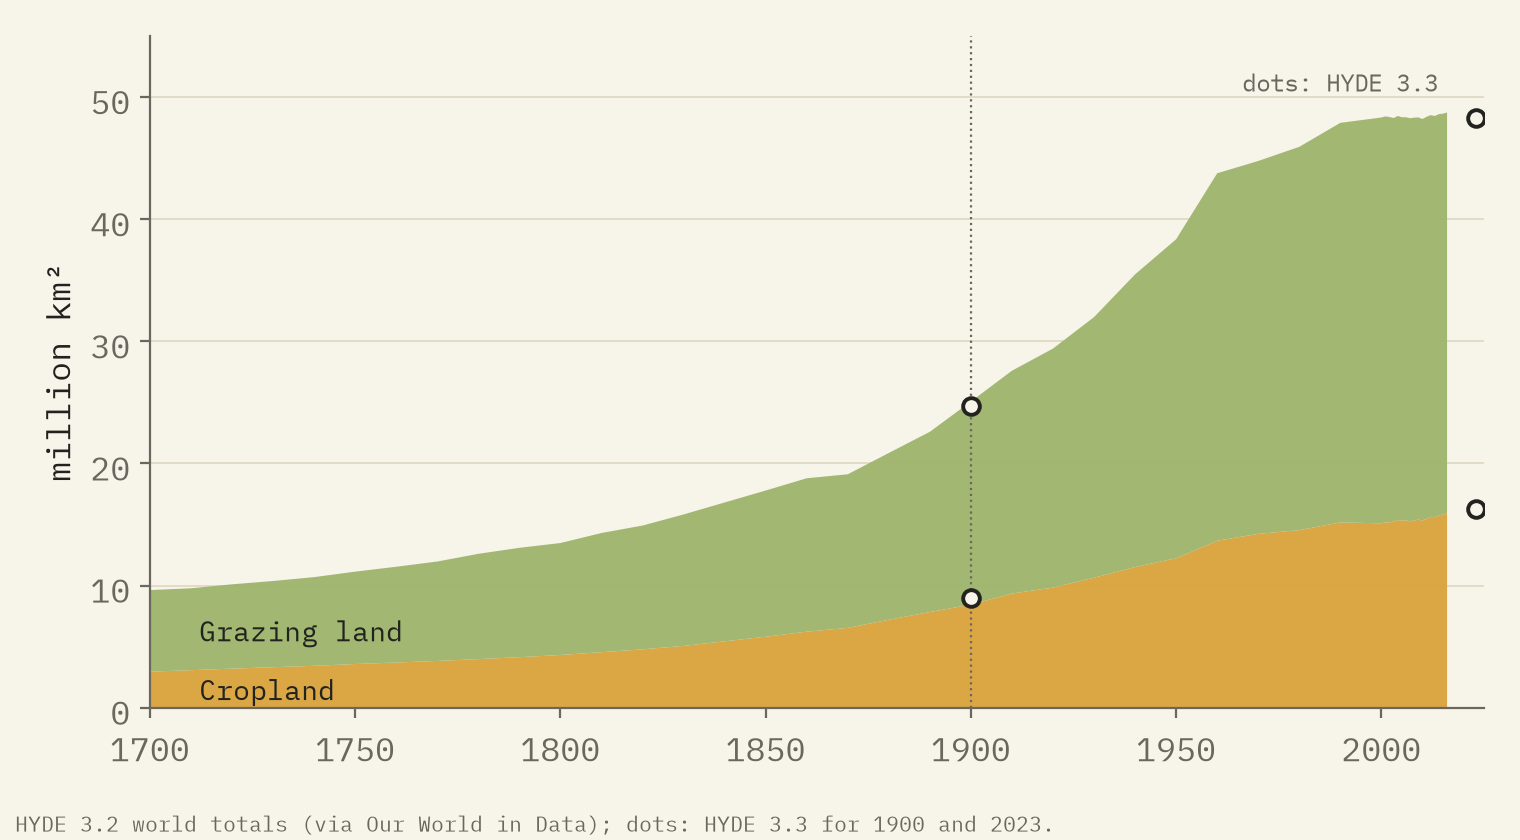
In HYDE’s estimate the world had 9.0 million km² of cropland in 1900 and 16.3 million in 2023. Grazing land grew from 15.7 to 32.0 million km². Together, farmland went from 19% of the ice-free land to 37%. The extra 23.5 million km² is 2.6 times the area of the United States.
Most of that is grazing, and most grazing land is rangeland: natural grass, scrub and savanna with cattle, sheep or goats on it, as across inland Australia, the Sahel and the steppes. From the air much of it would still look wild. The longer view shows when it happened. In the earlier HYDE 3.2 series, farmland grew by 15.4 million km² in the two centuries before 1900 and by 13.3 million in the fifty years after.
The frontier moved south
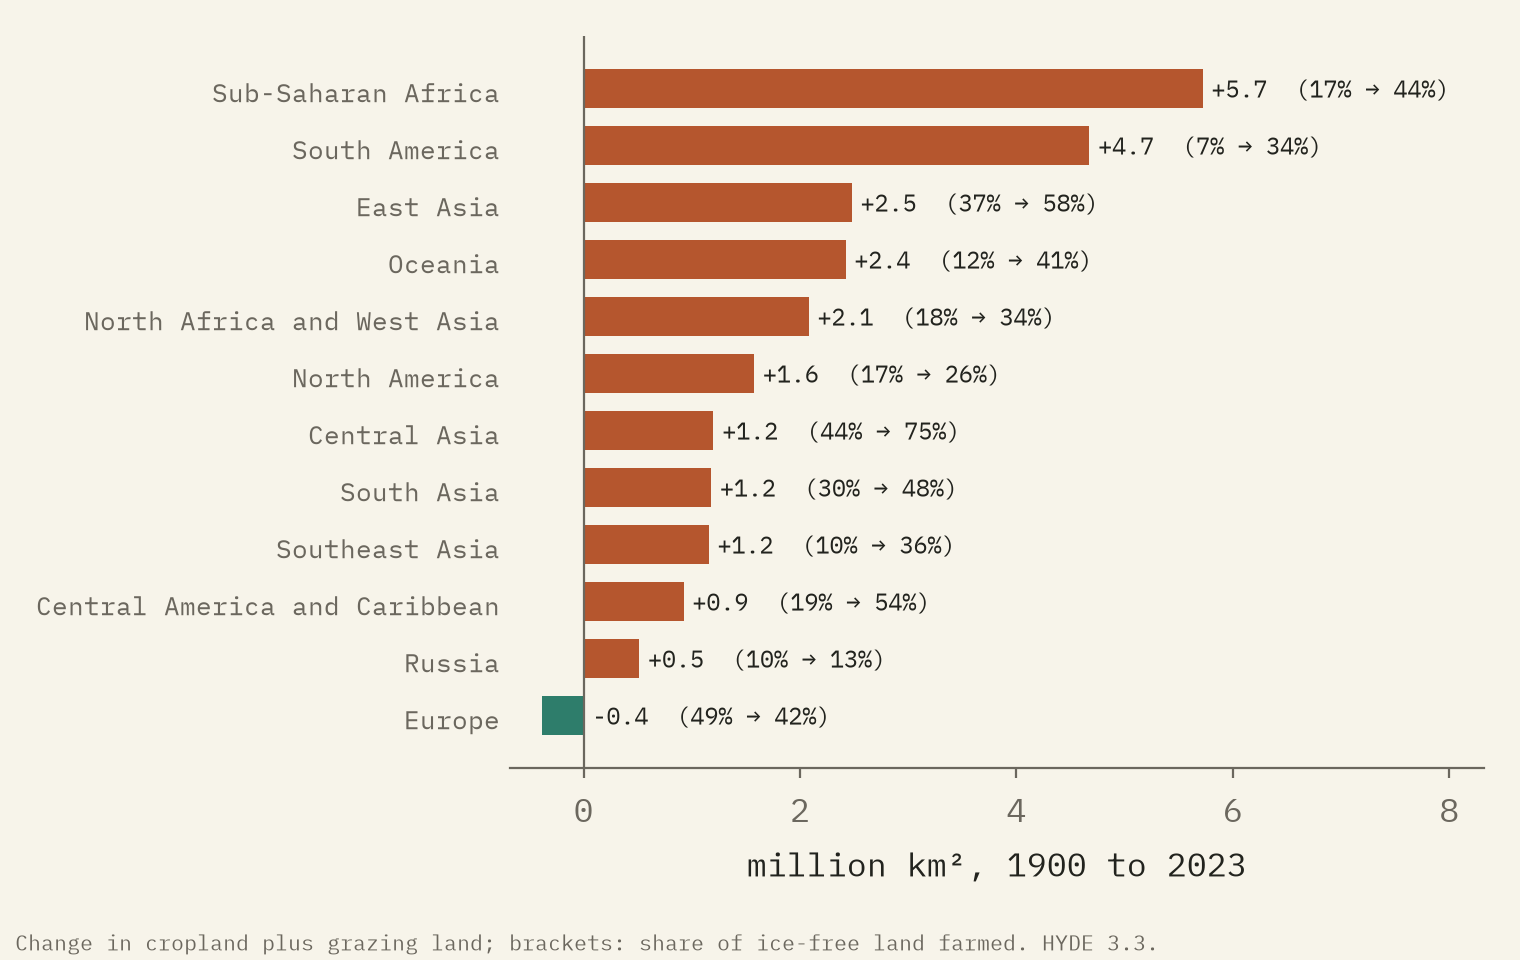
Every region of the world gained farmland except one. The biggest gains were in sub-Saharan Africa and South America, then East Asia and Oceania. By country, China, Brazil and Australia each added more than two million km². In Brazil much of the new farmland was cleared: the Cerrado went from 3% farmed to 41%. In Southeast Asia it was mostly cropland, with rice, rubber and oil palm taking the farmed share from 12% to 37%. The Sahel went from 26% to 64%.
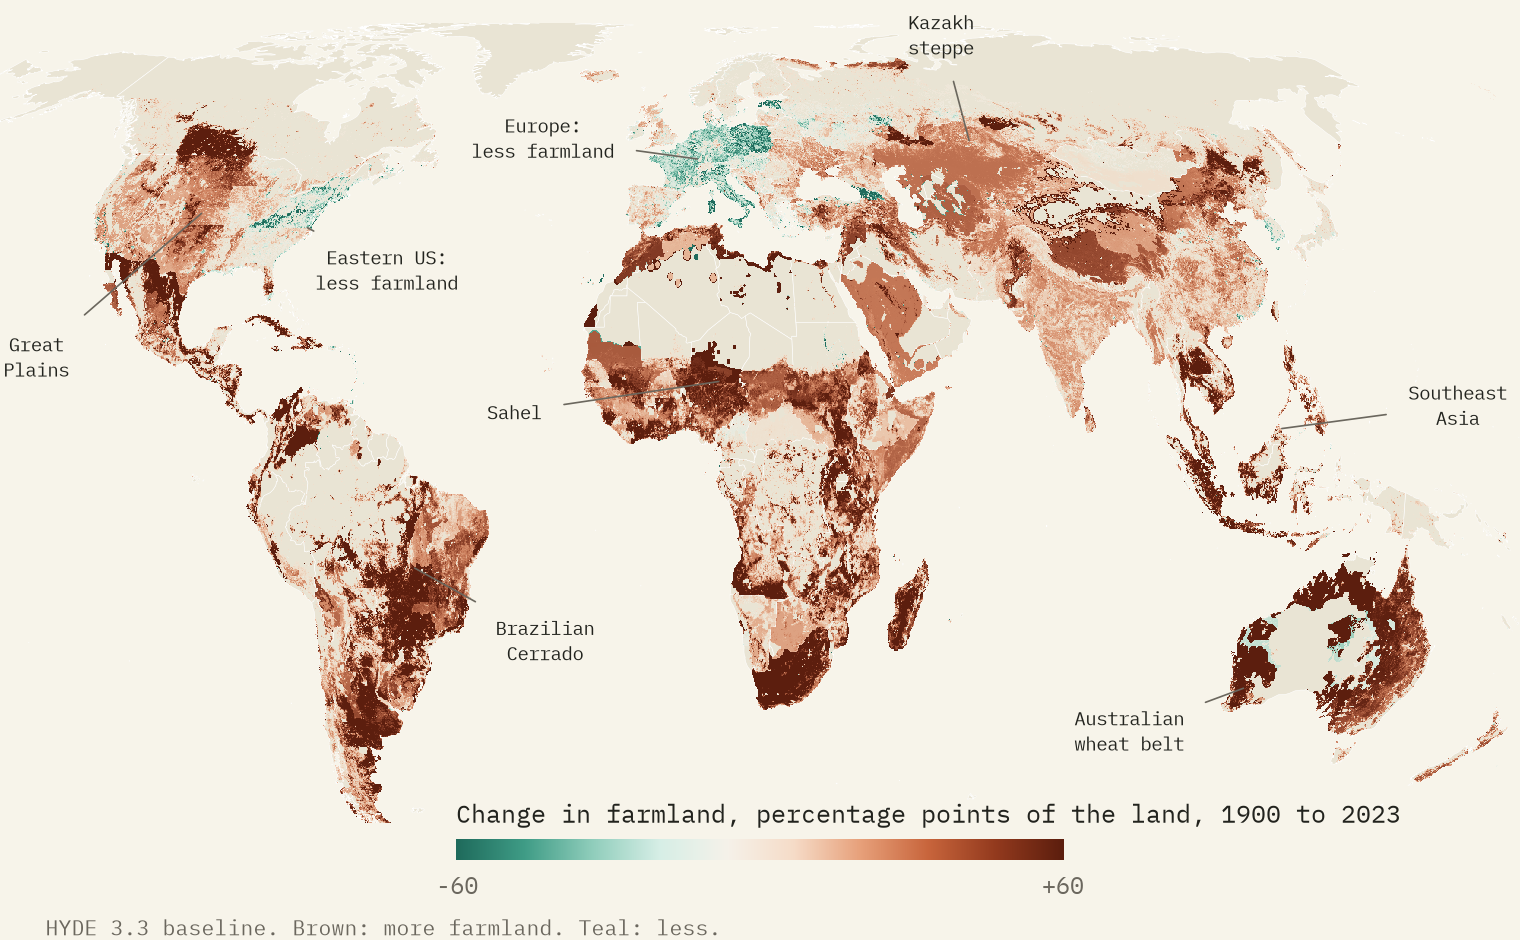
The old frontiers barely moved. The US Midwest was already 50% farmland in 1900, and it still is. The prairie had been ploughed in the half century before, so the great American change happened earlier than my maps can show.
Forests: gone in the tropics, back in the north
HYDE does not map forest, but it does know where forest would grow naturally, and how much of that forest zone is farmed. In 1900 it was 16%; now it is 27%. That net change hides two movements. Brazil, China, Indonesia, Australia and India brought the most forest-zone land into farming. Meanwhile, 1.2 million km² went out of farming, 87% of it in Europe, Russia and the United States. East of 90°W in the United States, the farmed share of the forest zone fell from 38% to 31%, as farms from New England to the Appalachians were given up and much of the land grew back to woods.
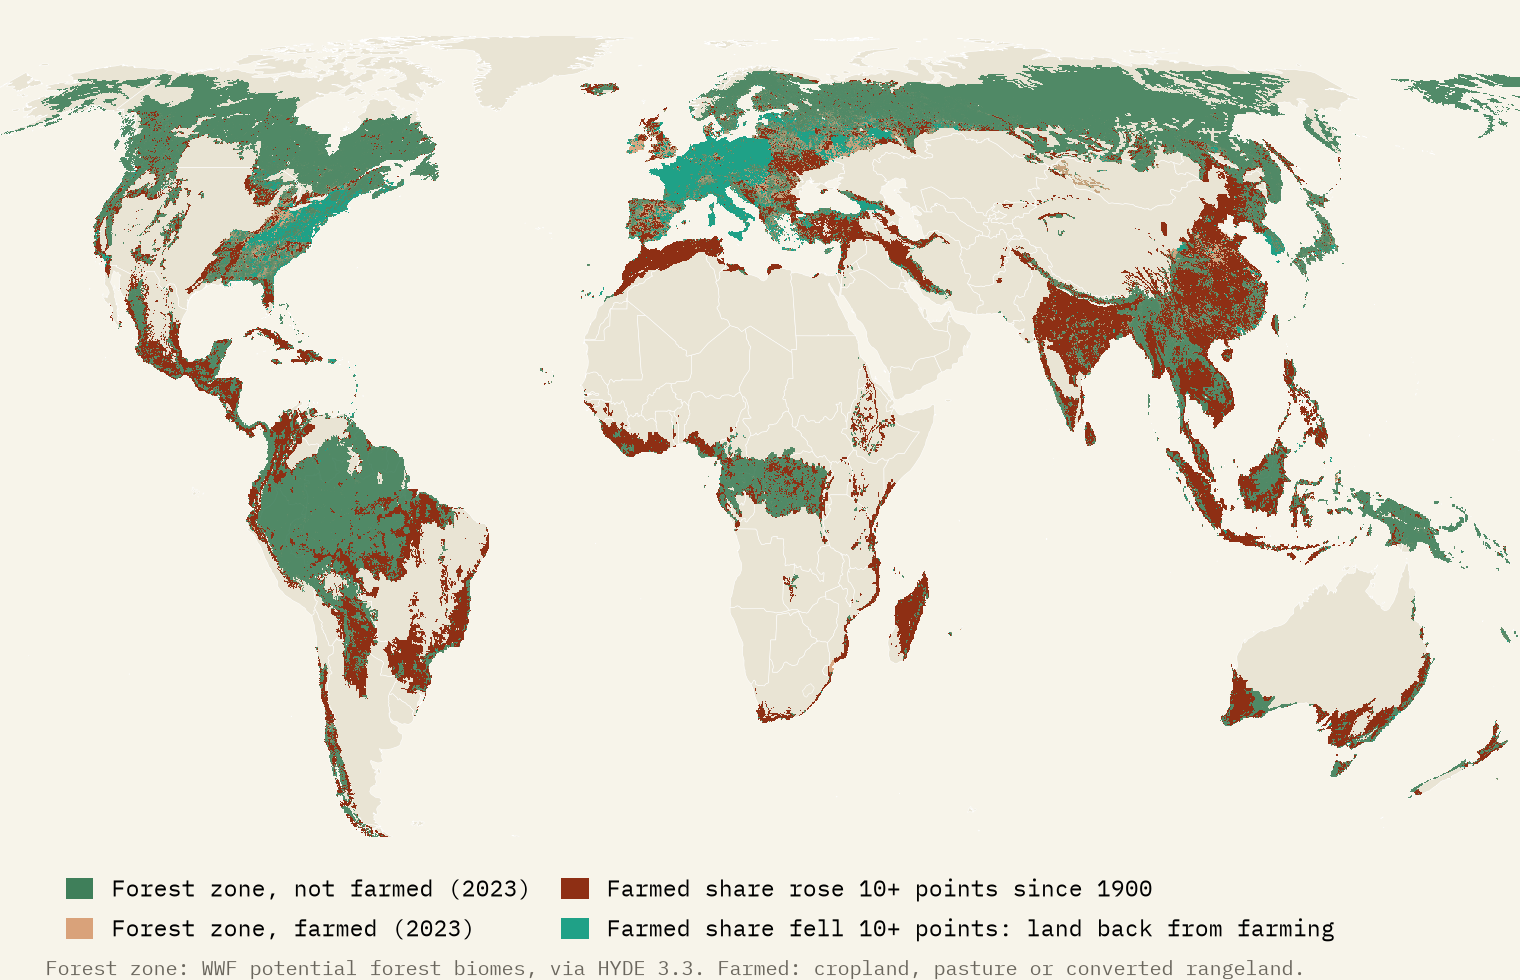
The forests that came back are in the countries that cleared theirs first. The forests going now are in the tropics.
Desert, forest, ice
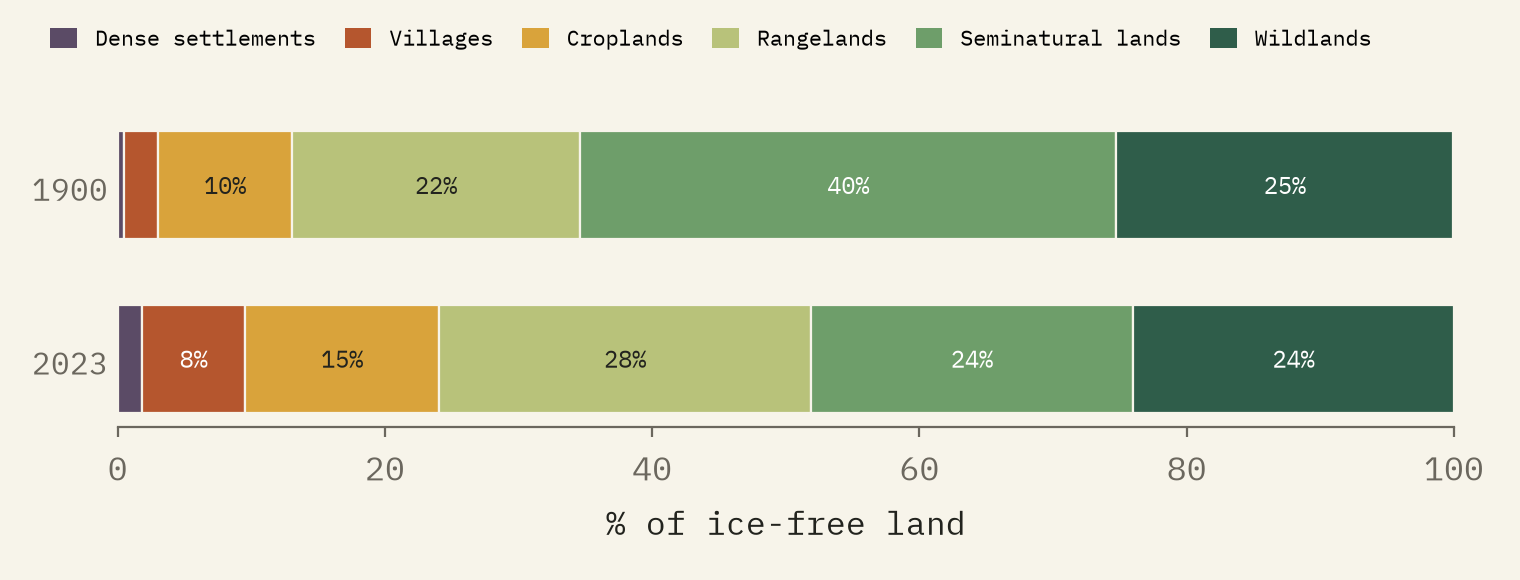
HYDE also sorts every cell into an anthrome, from cities through villages, croplands and rangelands to seminatural and wild land. The surprise is that the wildlands hardly shrank: 25% of the ice-free land in 1900, 24% now. They are the deserts, the tundra and the boreal forests, too dry, cold or remote to farm. What went was the middle: seminatural land, inhabited but mostly natural, fell from 40% to 24%.
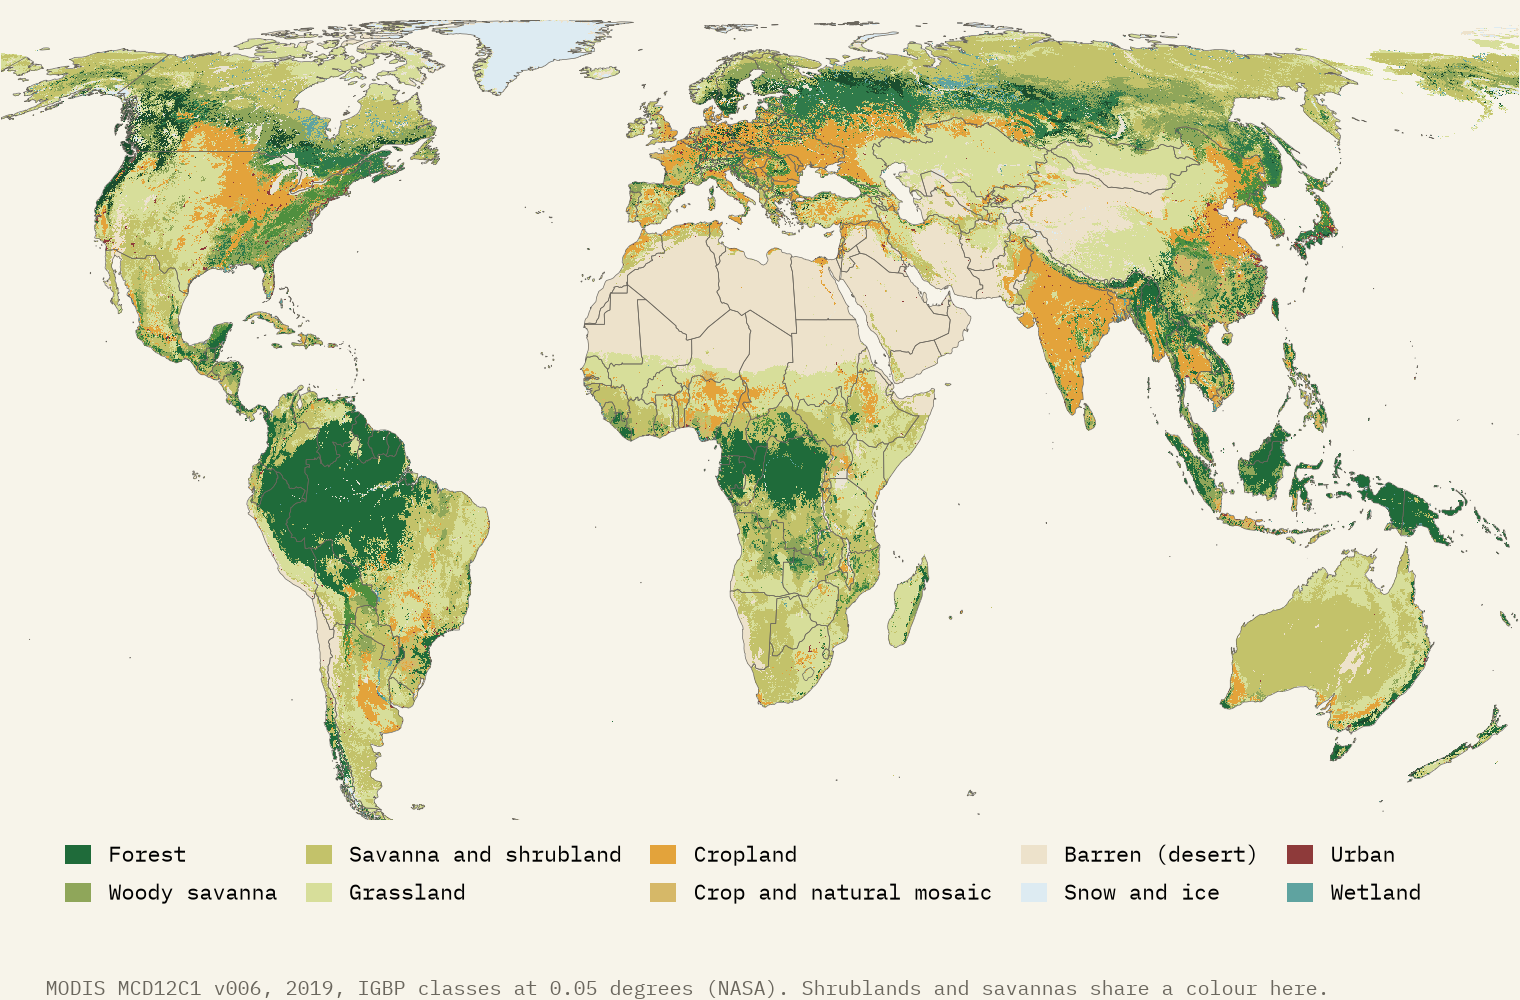
To check the present I compared HYDE with what satellites see. MODIS land cover for 2019 shows the world as it is now: forest across the north and the wet tropics, desert across the Sahara, Arabia and inland Australia, and ice on Greenland. It finds forest or woody savanna on 53% of the natural forest zone, less than the 73% that HYDE has unfarmed. The difference is land that is not farmed but not forest either: logged, burnt or naturally open.
How I did this
I used the HYDE 3.3 baseline grids for 1900 and 2023: cropland, pasture, rangeland and converted rangeland, the anthromes, and HYDE’s map of the natural forest zone. Farmland is cropland plus all grazing land, as a share of land outside the ice. In the forest zone, “farmed” means cropland, pasture or converted rangeland, so logging and fire do not show. The 1900 map is a model built from old statistics and spread over the land by rules, so trust the countries more than the single squares, and Africa, Asia and Latin America least. The paper sets out every step and caveat.
Notes and sources
- Klein Goldewijk, K., Beusen, A., Doelman, J. and Stehfest, E. History Database of the Global Environment 3.3 (HYDE 3.3). Utrecht University, CC BY 4.0. Method: Klein Goldewijk et al. (2017), Earth System Science Data 9, 927 to 953.
- HYDE 3.2 world totals 1700 to 2016 as republished by Our World in Data, CC BY 4.0.
- Friedl, M. and Sulla-Menashe, D. MODIS MCD12C1 land cover type, 2019. NASA LP DAAC, public domain.
- Natural Earth outlines and place names (public domain).
- I wrote the text, with drafting and editing assistance from Claude (Anthropic), which also helped prepare the analysis code. I reviewed and checked all text and results.

