
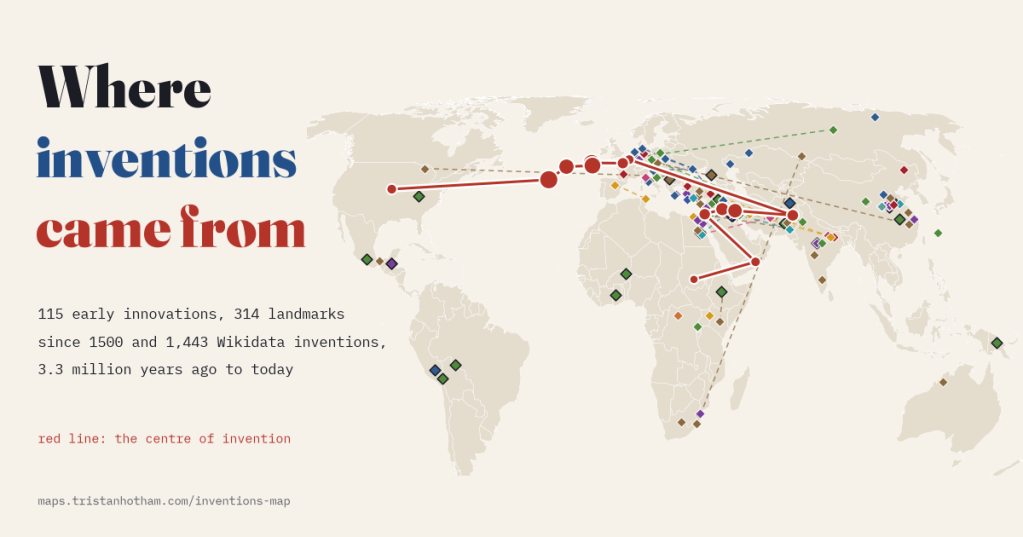
Who invented farming? Nobody, and at least 11 peoples at once. I put the world’s inventions back where they came from, from the first stone tools to the World Wide Web, and followed the centre of invention as it crossed the map. The map also shows who wrote the history down.
Ask where something was invented and you usually get one town and one name. Gutenberg in Mainz. Bell and the telephone. It makes a good story, but it is a strange way to think about the plough, or writing, or the wheel. So I tried to map inventions properly, across the whole of human history, and to be honest about where the record runs out.
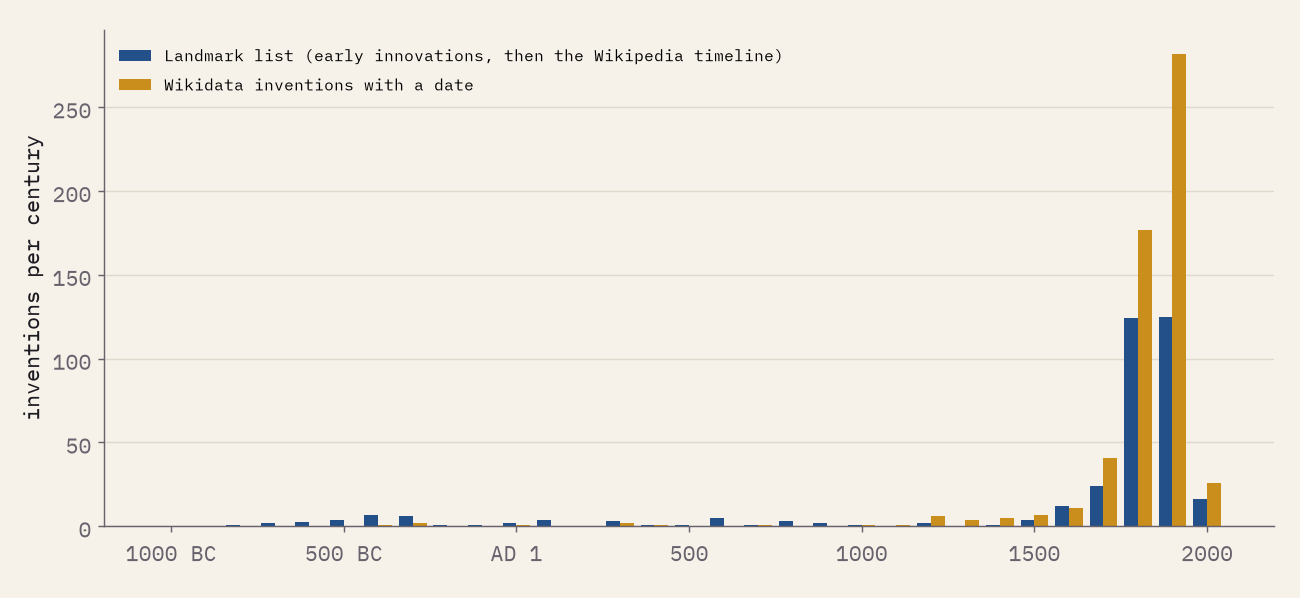
The map has three layers. For the deep past I read nine Wikipedia pages, from the Timeline of historic inventions to the pages on the Neolithic Revolution, the history of writing and the wheel, and wrote down 115 early innovations at 155 places, with each date and place exactly as the pages give them, ranges and all. For the modern world I took the 314 entries since 1500 in the same timeline. And from Wikidata, the open database behind Wikipedia, I filtered 1,443 inventions out of 24,186 items that have an inventor or a date of invention, most of which turned out to be islands, comets, theorems and statues.
Invented more than once
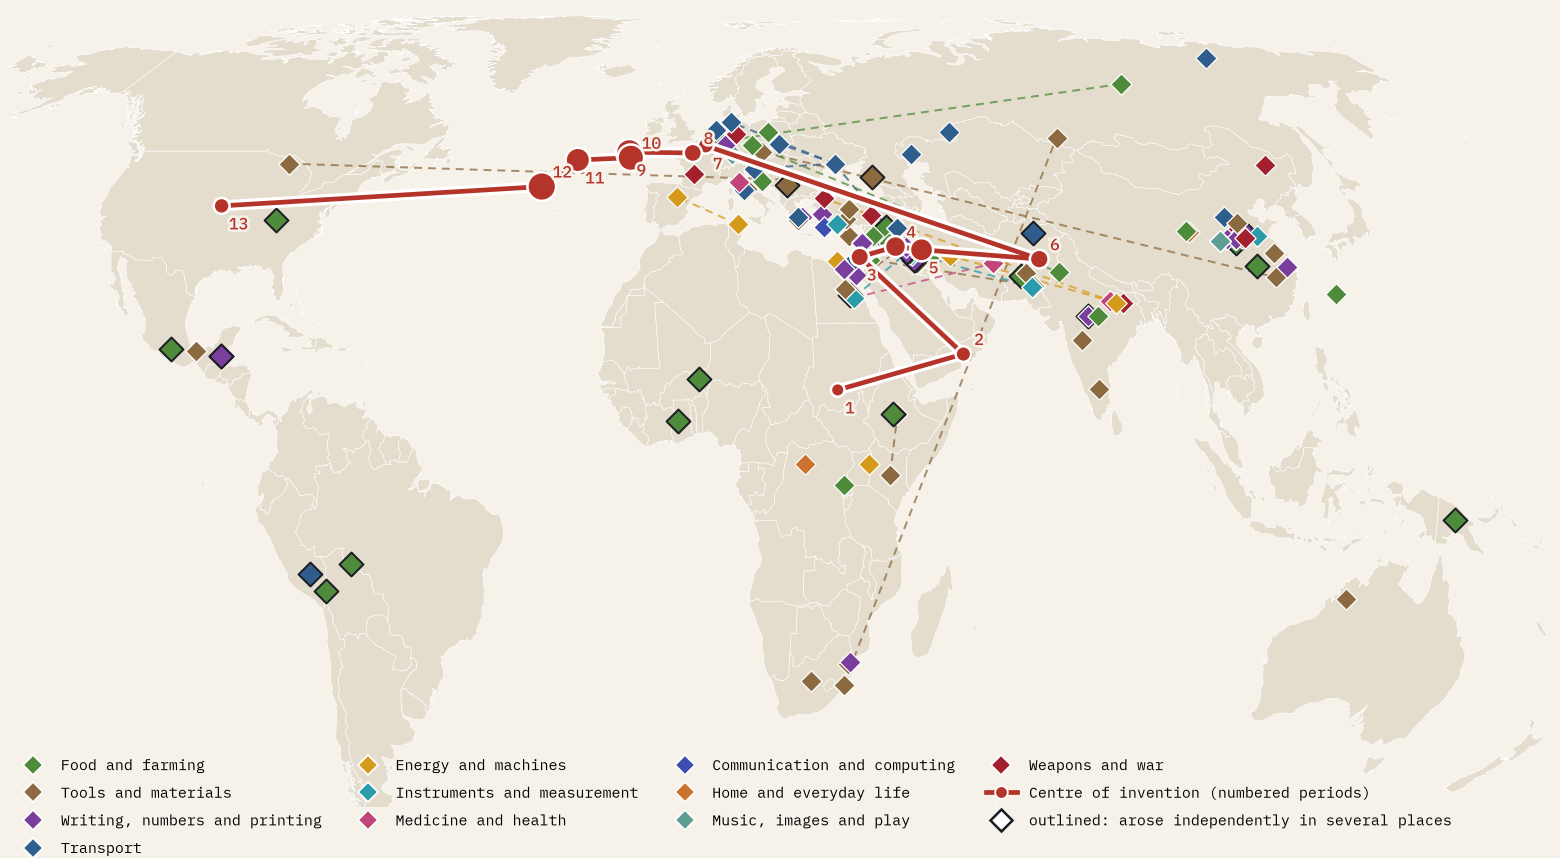
The first surprise is how often the big things were invented more than once. The Neolithic Revolution page lists 11 centres where farming began: the Fertile Crescent from about 10,000 BC, the Yangtze and Yellow River basins, the Kuk Swamp in the New Guinea Highlands, southern Mexico, the Amazon basin and the Andes, the Ethiopian highlands, the Sahel and West Africa, and eastern North America. Writing was invented at least four times, in Mesopotamia, Egypt, China and among the Maya. Zero three times, in Babylon, among the Maya and in India. Even the simple suspension bridge appears twice, in the Andes and the Hindu Kush.
Where the pages are unsure, so is the map. Glass was first made “in either Mesopotamia or Ancient Egypt”; coins in “Phoenicia or Lydia”. The wheel turns up almost at once in clay models by the Black Sea, wagon pictures at Uruk and on a pot at Bronocice in Poland, ruts in northern Germany and a wooden wheel from the Ljubljana Marshes. I show every candidate and crown none.
A centre that moves
Average the locations of each period’s landmarks and you get a centre of invention, and it travels. In the deep past it sits in Africa. From 10,000 BC to AD 1 it is in West Asia: 51% of the landmarks from 5000 to 2000 BC come from Mesopotamia, Egypt and their neighbours. From AD 1 to 1500, 50% are Chinese: paper, woodblock printing, porcelain, the banknote, gunpowder and movable type.
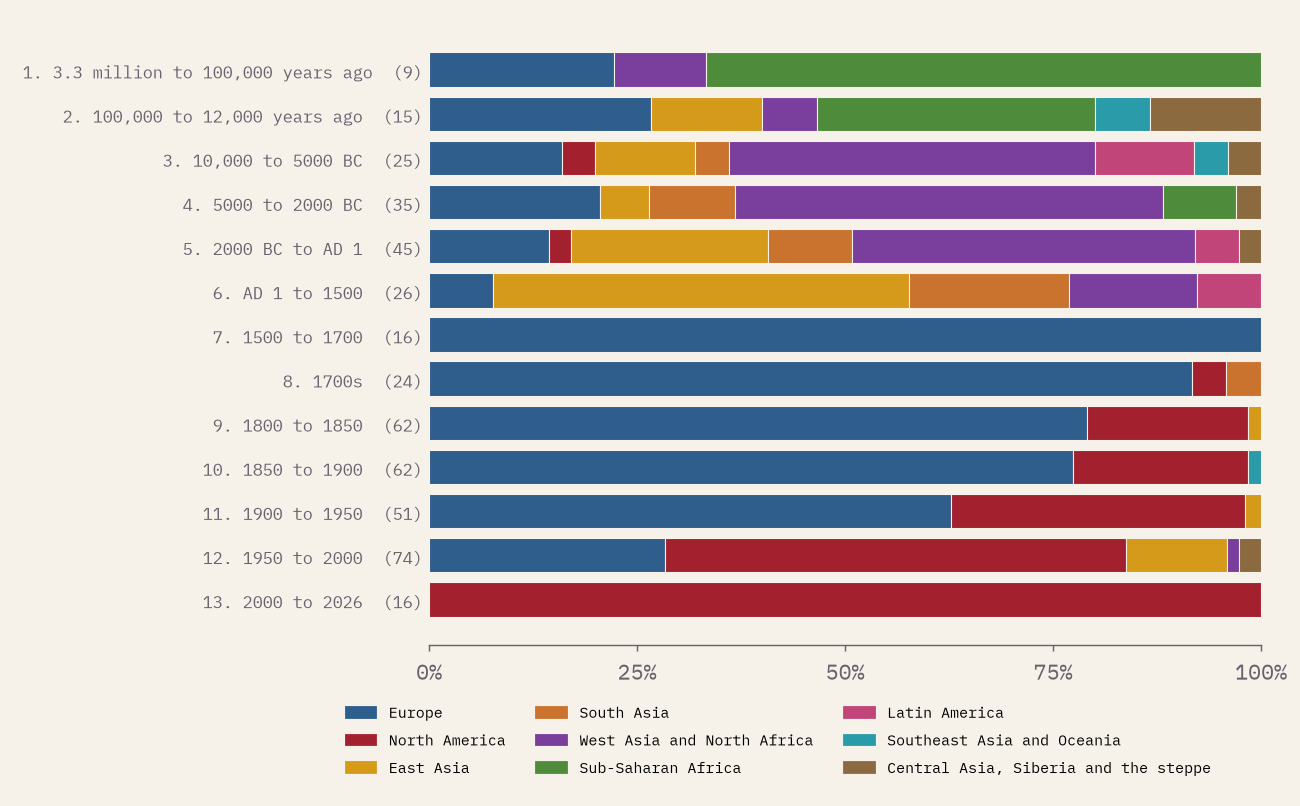
Then it jumps. From 1500 to 1700 every landmark on the list is European, and Europe still holds 77% of them in the second half of the nineteenth century. After that the centre drifts west across the Atlantic. North America first leads from 1950 to 2000, with 55% of the landmarks, and East Asia comes back to 12%. The Wikidata layer, counted the same way, tells the same story.
London, New York, Paris and Vienna
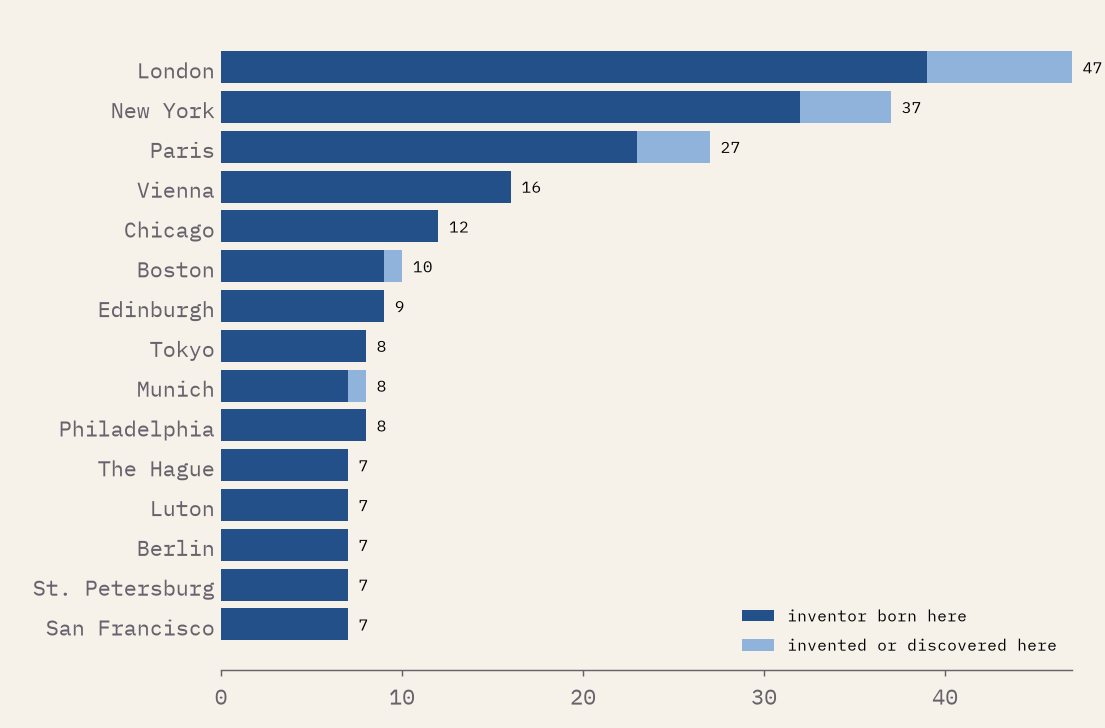
Wikidata places most inventions by their inventor’s birthplace, so its most inventive cities are really the cities that produced inventors. London leads with 47, from Babbage’s computer to Berners-Lee’s web, then New York (37), Paris (27) and Vienna (16). Tokyo is the first city outside Europe and North America.
Who gets the credit
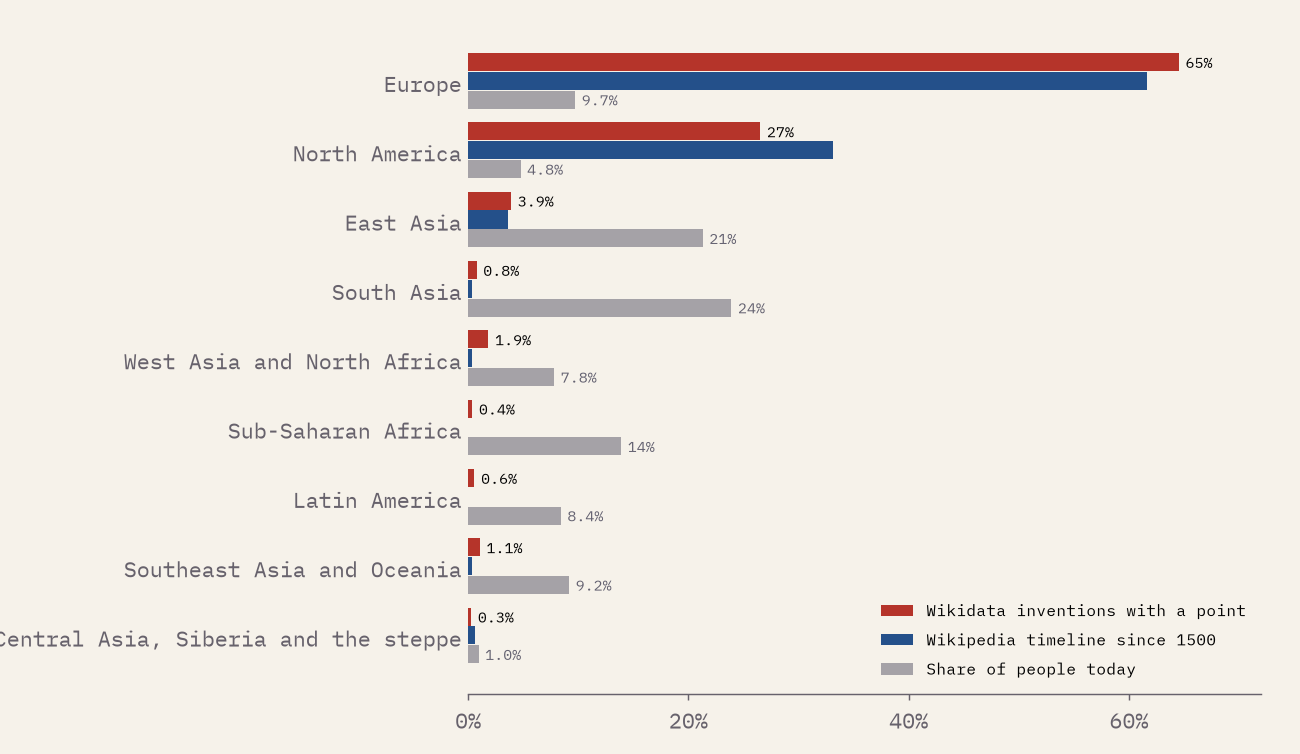
Now the caveat, which is big enough to be a finding. Of the Wikidata inventions I could map, 91% are in Europe or North America, home to 14% of the world’s people today. South Asia has 8 and sub-Saharan Africa 4. That is a picture of who wrote Wikipedia and Wikidata, and of an idea of invention as something done by a named person with a patent: 83% of Wikidata’s inventions have a named inventor, while the early innovations mostly have none.
The habit of crediting one person produces some lovely oddities. Wikidata’s only inventor of the car is Ferdinand Verbiest, a Flemish Jesuit who built a little steam vehicle for the Chinese emperor, so the car’s dot sits in Belgium. Gunpowder, which the Wikipedia timeline dates to ninth-century China, is credited to Berthold Schwarz, a legendary German monk. I have left these as Wikidata records them, and every point on the map says how it was placed.
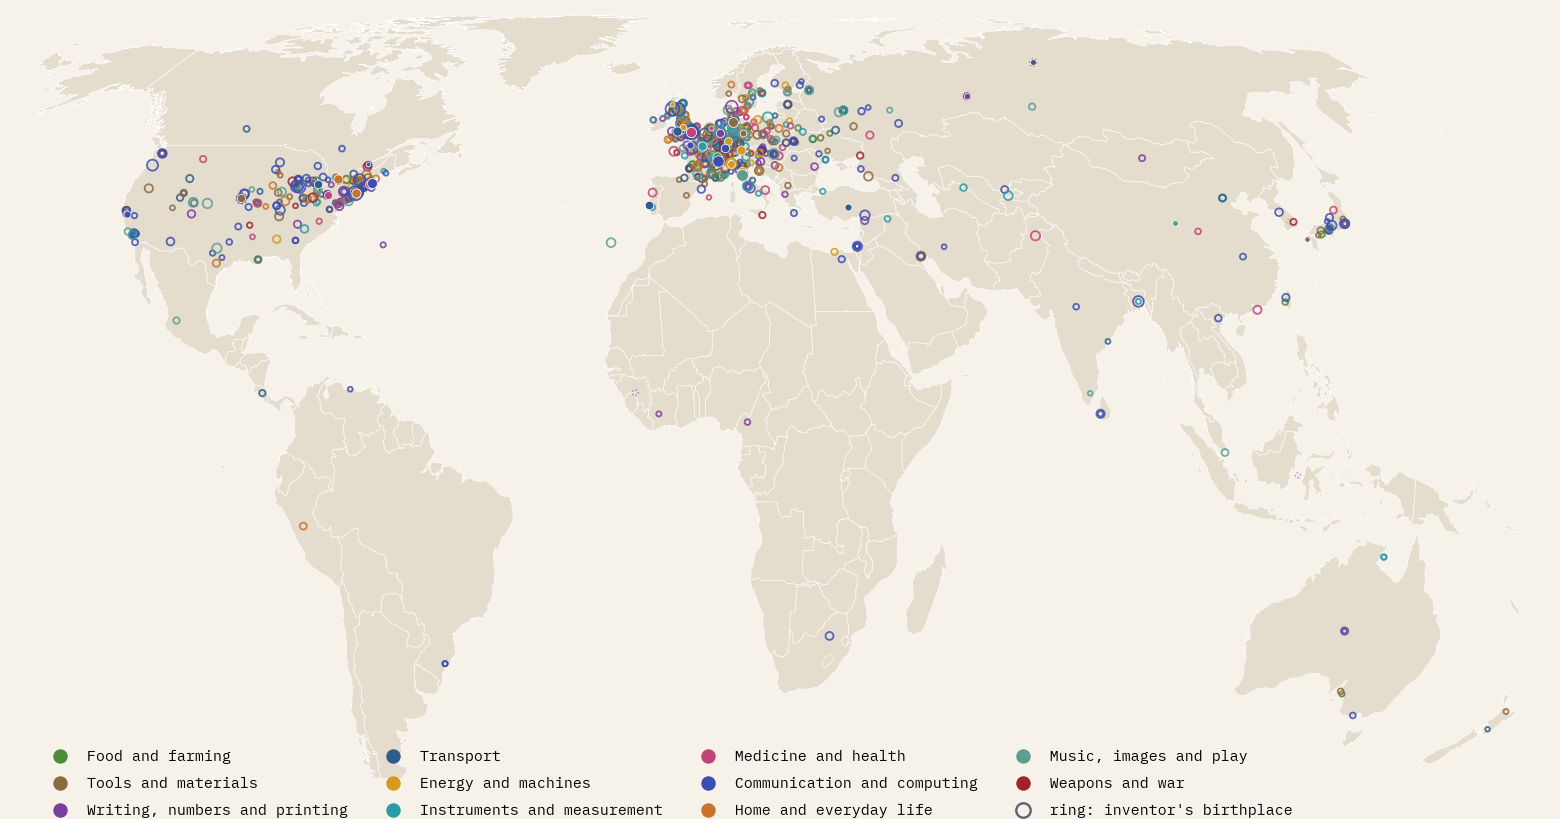
Farming was invented at least 11 times. Wikidata knows 4 inventions from sub-Saharan Africa.
How I did this
The early table is my reading of nine English Wikipedia pages, saved in 2026. Every row keeps the page’s own dates and places and the passage it rests on, and a script checks each passage against the page. The coordinates are mine and rough, and the map shows how rough with a ring. The timeline entries since 1500 are placed by a place they name, by the birthplace of a person they name who appears in Wikidata as an inventor, or, for about two in five, by hand at the country where the inventor worked. Wikidata inventions were filtered by their classes and names, checked by hand down to ten sitelinks, and placed at their place of invention, the inventor’s birthplace or the country of origin, in that order. The centre of invention is the average latitude and longitude of each period’s landmarks. The paper sets out every step and caveat.
This is a map of the written record of invention, mostly in English. It does not rank peoples or places, and the gaps in it are gaps in the record, not in human ingenuity.
Notes and sources
- English Wikipedia: Timeline of historic inventions, Timeline of prehistory, Neolithic Revolution, Domestication, History of writing, Wheel, Bronze Age, List of Indian inventions and discoveries and Islamic Golden Age. CC BY-SA 4.0.
- Wikidata, via QLever. CC0.
- Natural Earth countries, populated places and population estimates. Public domain.
- I wrote the text, with drafting and editing assistance from Claude (Anthropic), which also helped prepare the analysis code. I reviewed and checked all text and results.

