
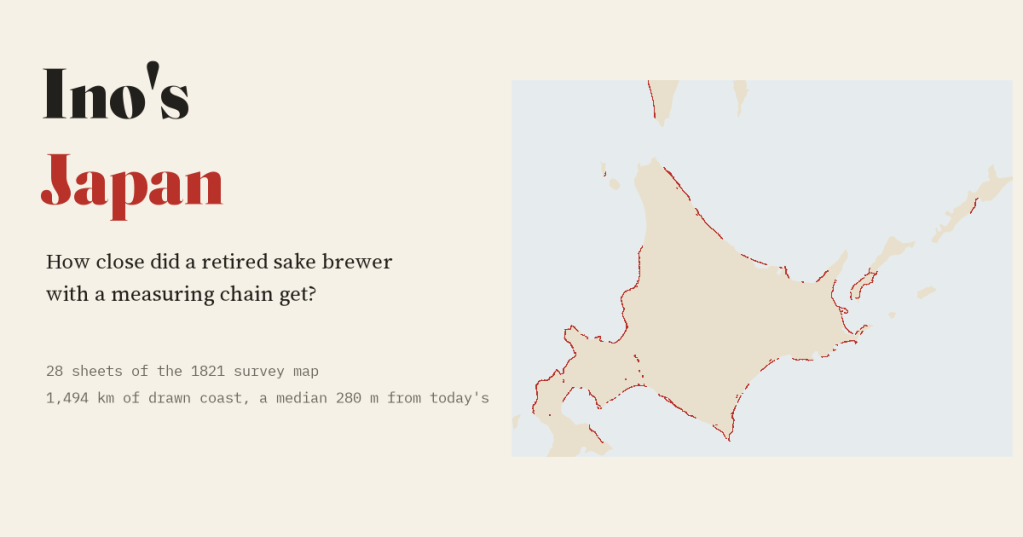
In 1800 a retired sake brewer called Ino Tadataka set out to measure Japan on foot. I put 28 sheets of his great survey map back on a modern map to see how close he got.
Most of the old maps I have set against modern ones are wonderful and wrong. This one is the opposite. Ino Tadataka spent decades running a sake brewery in Sawara, east of Edo, and only after he retired did he go to the capital to study astronomy. In 1800, at the age of 55, he set off north with a small team, a measuring chain, compasses and a quadrant for the stars. Over the next 17 years his surveys walked about 35,000 km of coast and road. He died before the map was finished, and his team completed it in 1821: 214 large sheets, the first map of the whole of Japan drawn from measurement.
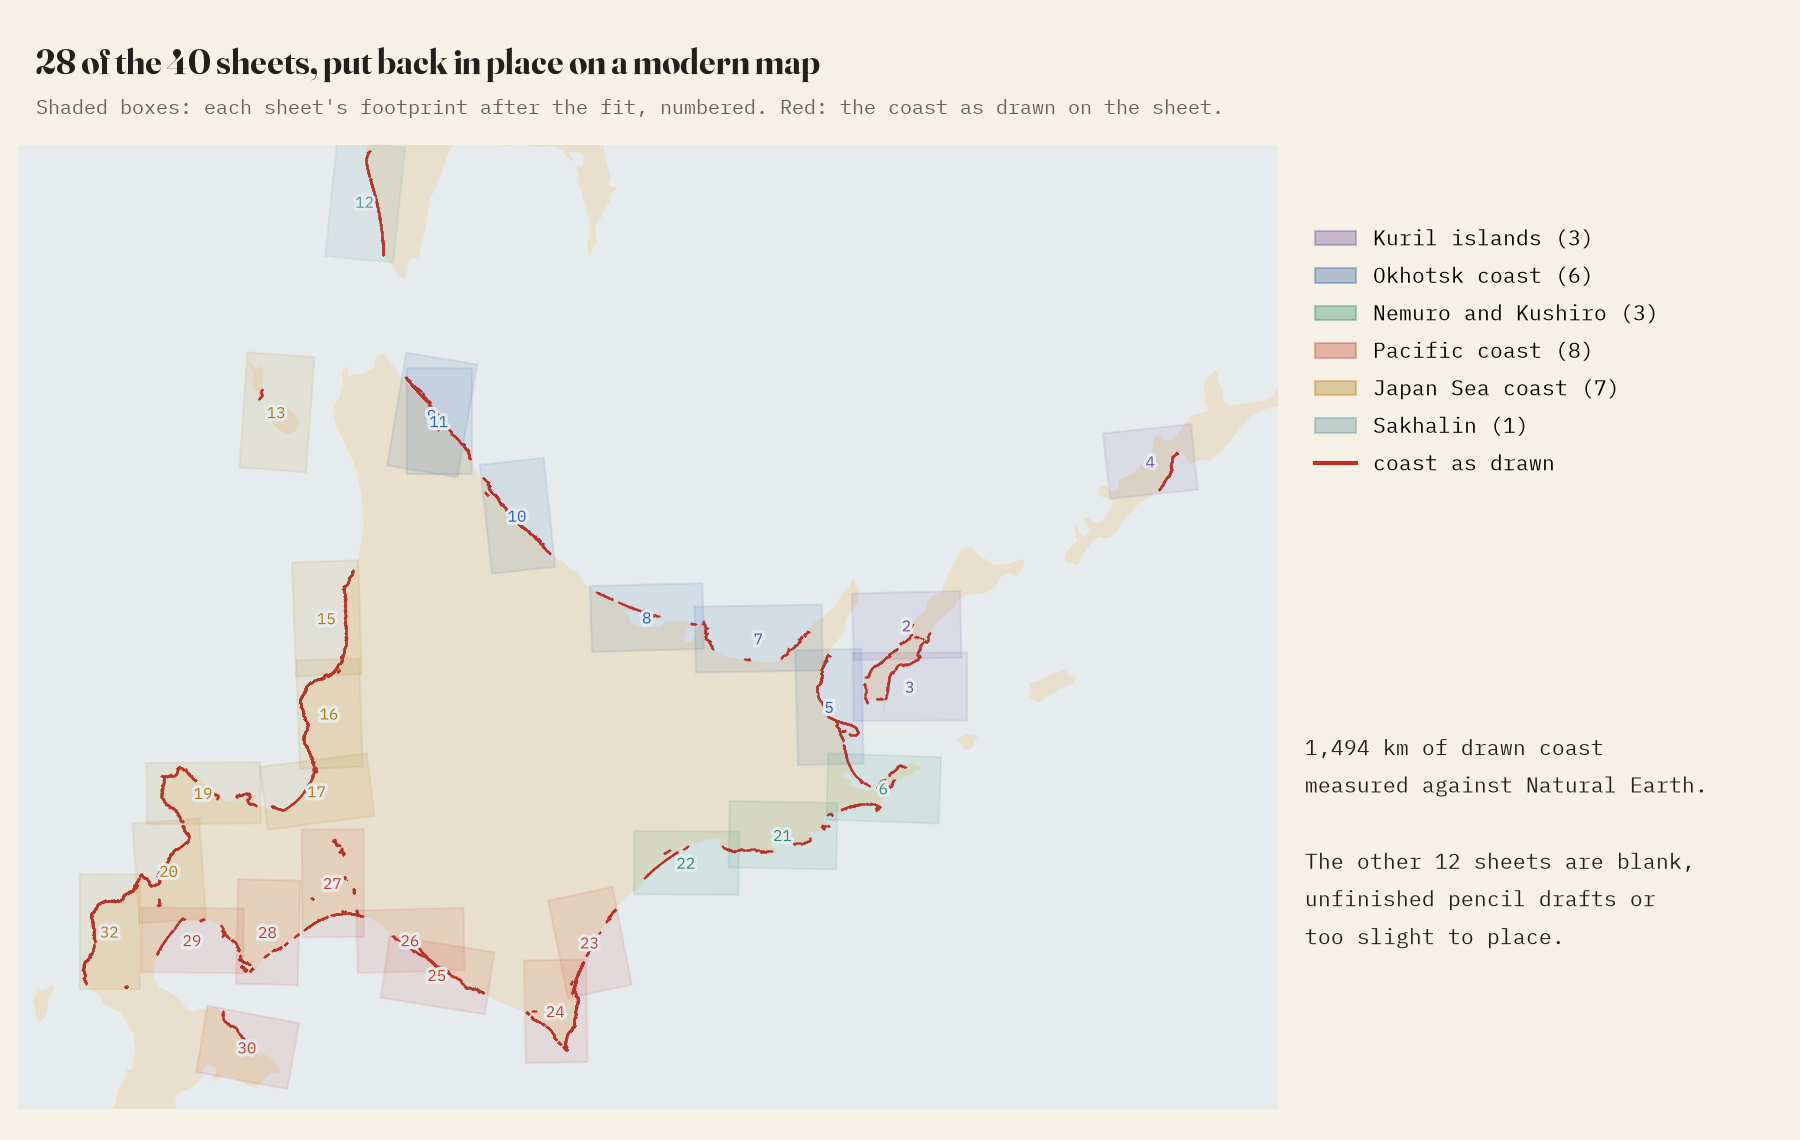
The Library of Congress holds a manuscript copy of those large sheets, and photographs of sheets 1 to 40 are on Wikimedia Commons. They are all from the far north: Hokkaido, the southern Kurils and a strip of Sakhalin, drawn at 1:43,600. None of them has a grid of latitude and longitude, so first I had to find where each one belongs. I picked out the drawn coastline by colour and searched the modern map for the place where it fits best. 28 of the 40 sheets found a home; the rest are blank, unfinished pencil drafts or show too little coast.
How close?
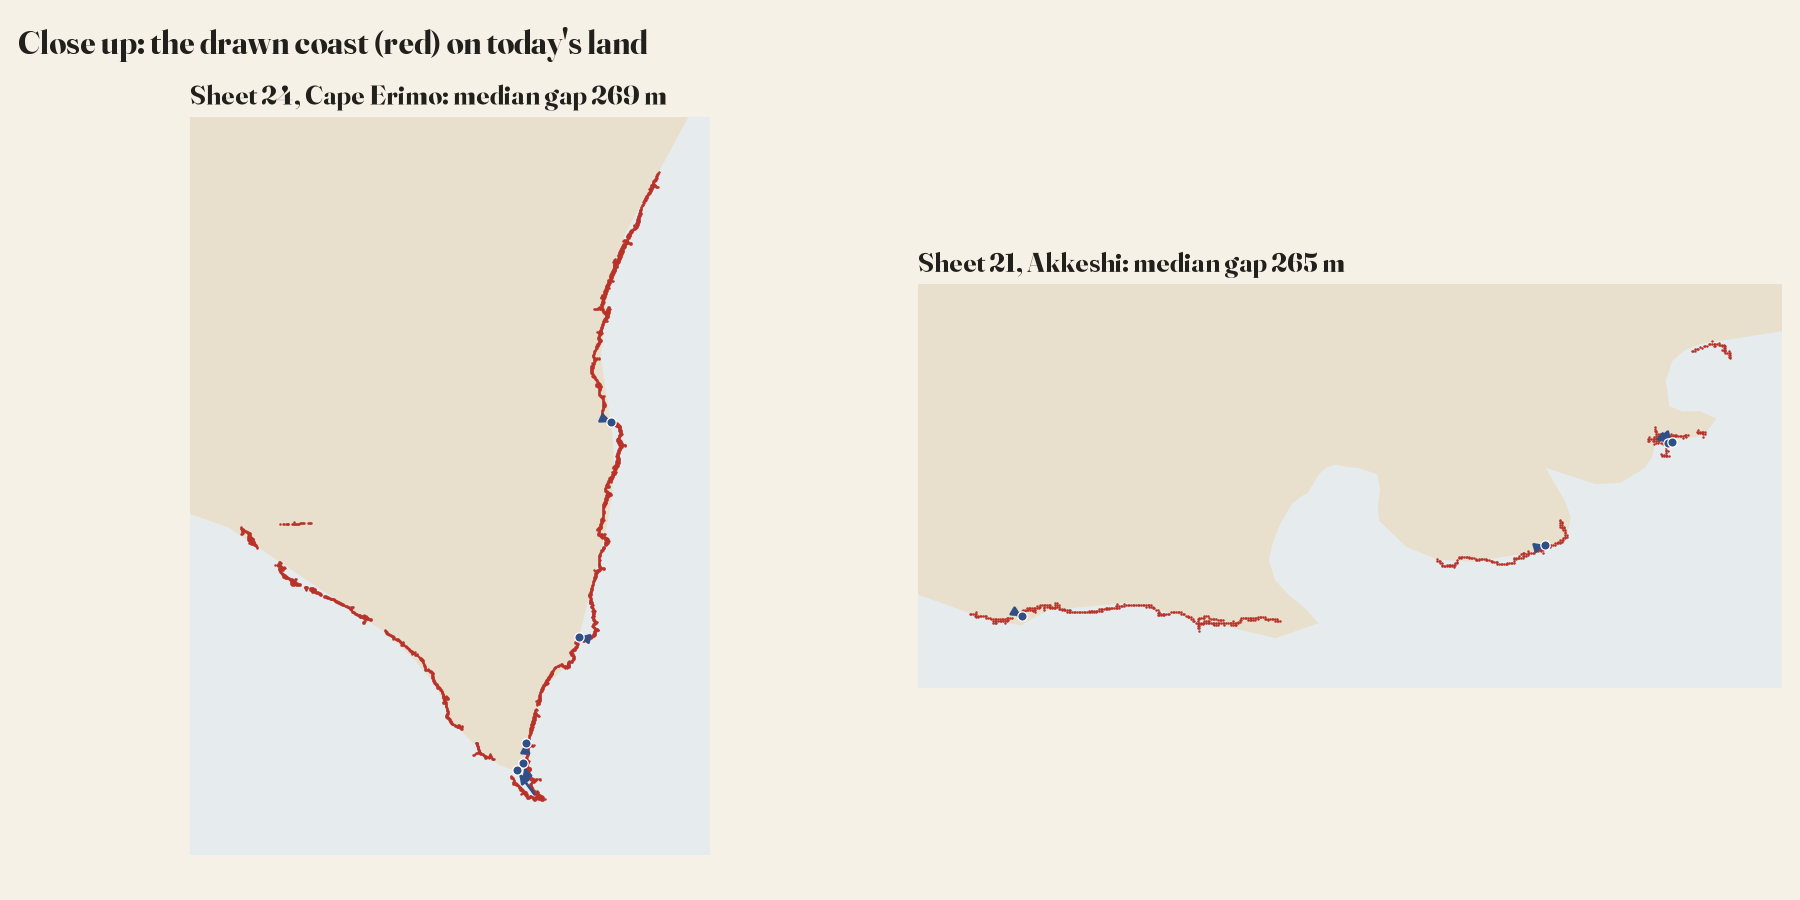
To measure each sheet I kept its scale fixed and let it move and turn once, to the position where its drawn coast best fits the modern coast. Then I measured, every kilometre along 1,494 km of drawn coast, how far it lies from the modern line. On a typical sheet the median gap is 280 m, and 90% of the coast is within a kilometre. On the paper that is about 6.4 mm. Put the sheet on the map and the two coasts lie almost on top of each other.
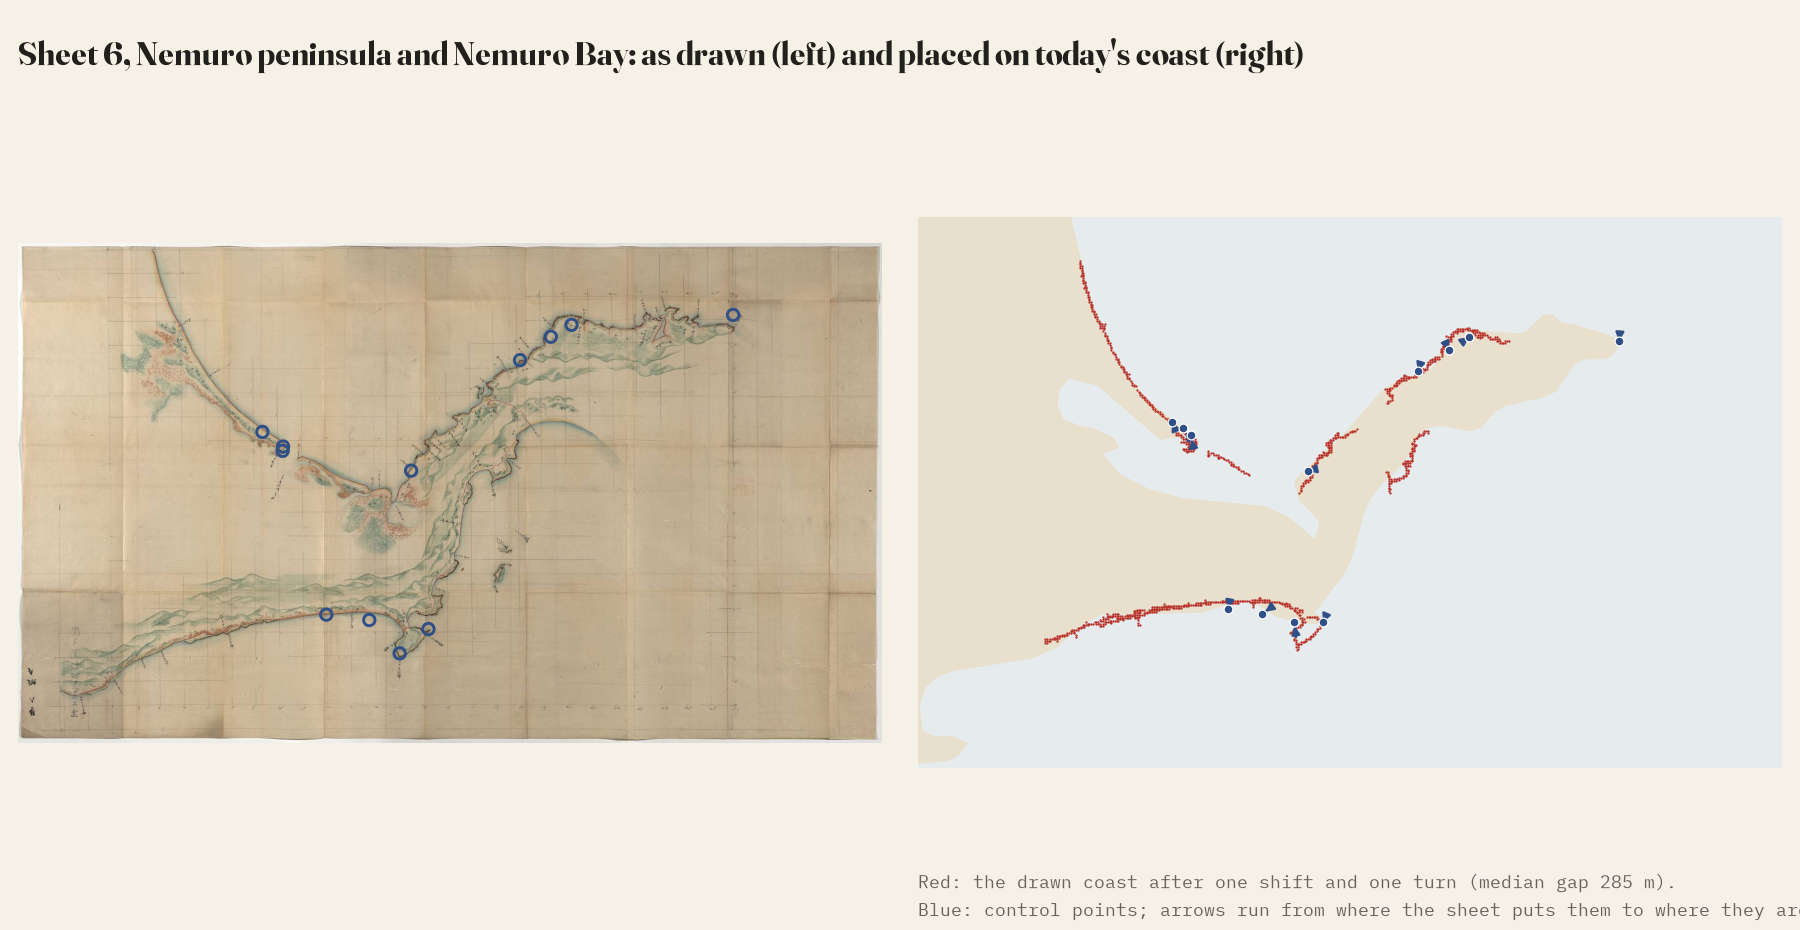
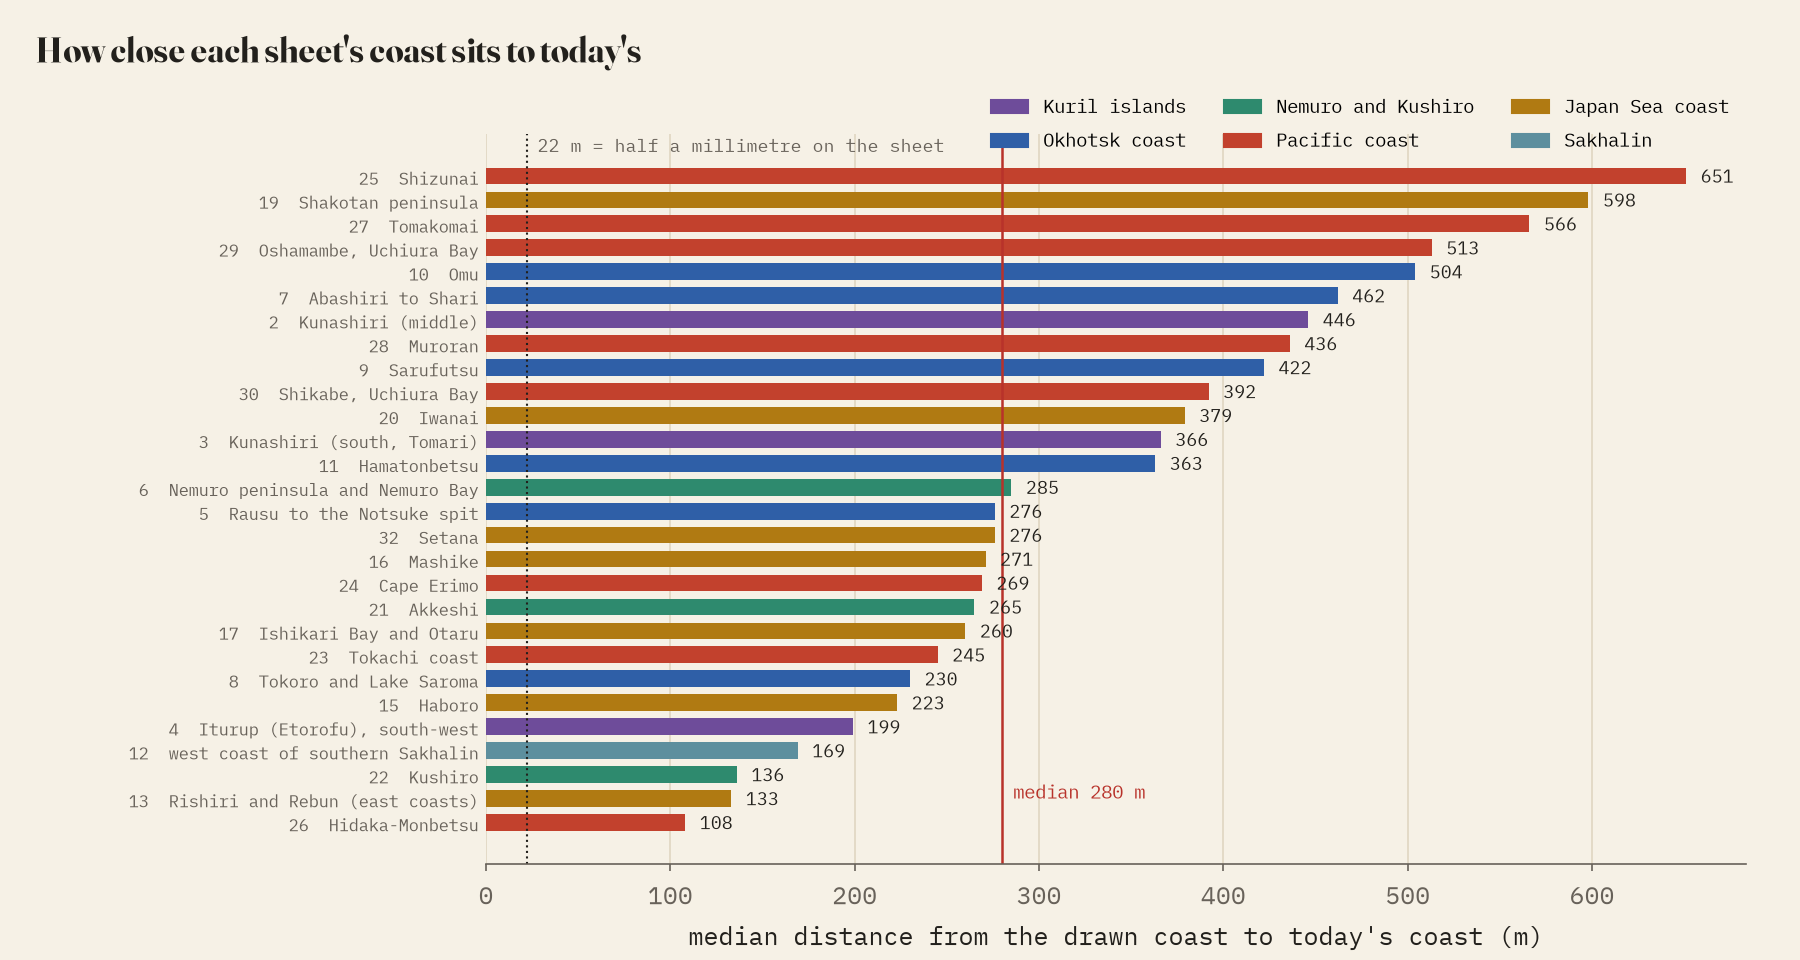
That number is an upper bound. Half a millimetre on the sheet is 22 m on the ground, so the gap is far bigger than any draughtsman’s slip, but much of it is not Ino’s. The sheets are copies, folded and photographed, and my modern coastline, Natural Earth’s 1:10m outline, is drawn for maps of whole countries: it smooths away small bays and spits and can be several hundred metres off the real shore. A better modern line could only make Ino look better.
Capes and corners
A coastline pins a map across the shore but not along it, so I also used 93 control points: 23 capes, spit tips and bends I picked by eye, and 70 curving stretches of coast matched automatically. They lie a median 543 m from their true positions. Cape Nosappu, the eastern tip of Hokkaido, is 585 m out; Cape Notoro 531 m. Cape Erimo is the outlier at 2,702 m, drawn running further out to sea than the modern outline. The sheets are also square to the world: on those whose coast fixes the angle, the median tilt from true north is 1.3 degrees, and their scales agree to within 5%.
The whole country
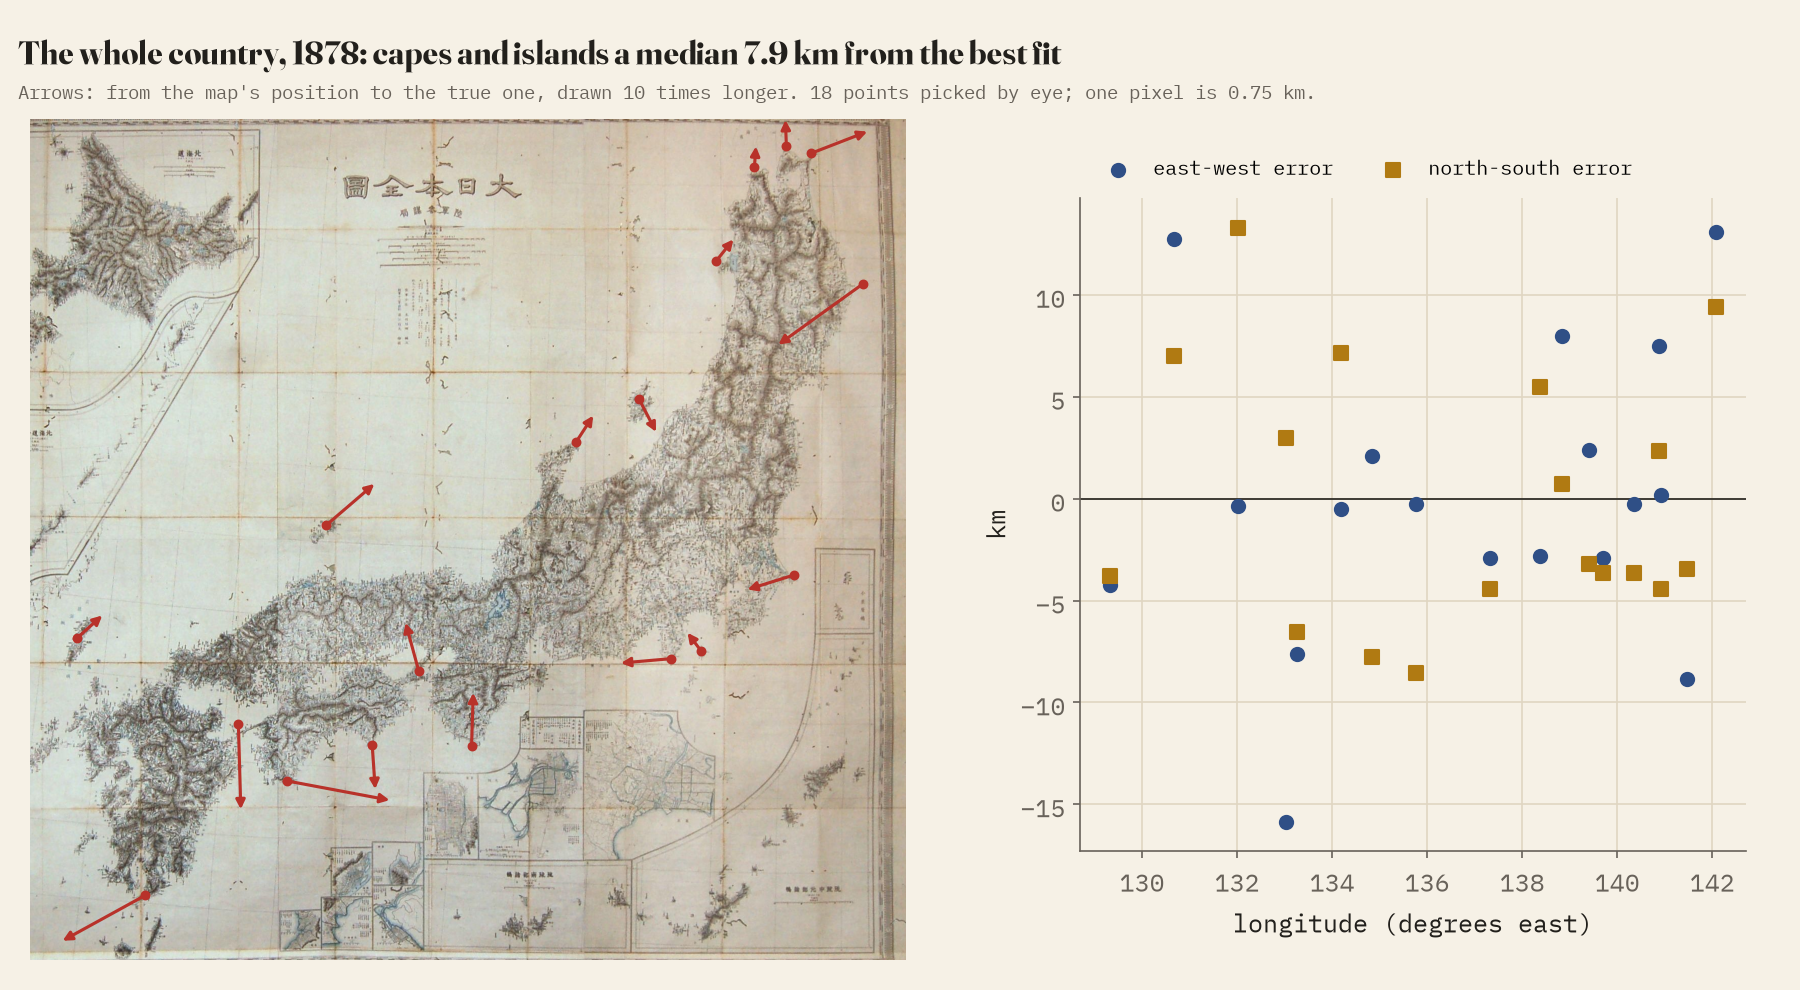
The large sheets cannot say where Ino put Hokkaido as a whole, so for the national picture I used a map of Japan compiled from his survey and published by the Army General Staff in 1878. On 18 capes and islands, from Tsushima to the eastern tip of Honshu, the median point is 7.9 km from where the best-fitting modern map puts it. Ino fixed latitudes by the stars and worked longitudes out from his traverses, so you might expect east and west to drift. At this resolution I cannot see it: north-south and east-west errors are the same size. The only hint is that east-west distances come out about 1.9% longer than north-south ones, which could as easily be the 1878 projection.
How I did this
The sheets are the Library of Congress copy’s first 40, 18.7% of the 214, and all from the far north, so this says nothing directly about the main islands, which were drawn at 1:36,000. Much of the north on the finished map is usually credited to the surveyor Mamiya Rinzo, so this measures Ino’s map rather than only his own footsteps. I aimed for 250 control points and found 93: smooth beaches and a generalised modern coast leave few features to match. The positions on the 1878 map are my own picks on a low-resolution photograph. The paper sets out every step, and the data and code are open.
Notes and sources
- Ino Tadataka and team, Dai Nihon Enkai Yochi Zenzu, large-scale sheets, manuscript copy, Library of Congress, public domain; photographs via Wikimedia Commons.
- Dai Nihon Zenzu, Army General Staff Bureau, 1878, Wikimedia Commons, public domain.
- Natural Earth 1:10m coastline (public domain).
- I wrote the text, with drafting and editing assistance from Claude (Anthropic), which also helped prepare the analysis code. I reviewed and checked all text and results.

