
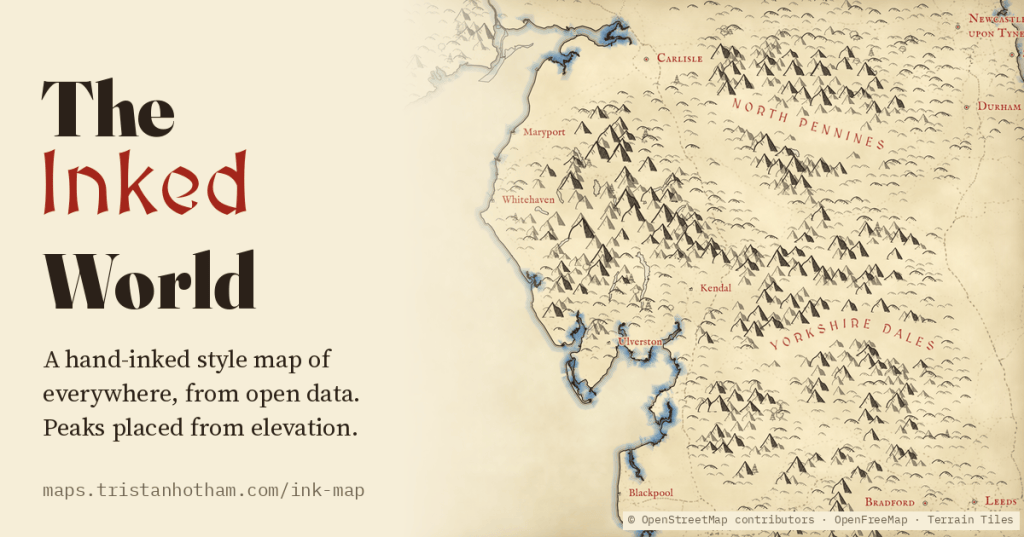
The maps at the front of fantasy novels, Tolkien’s above all, draw one place at one scale, by hand. I wanted a Tolkien-inspired map of the modern Earth that draws the whole world, at every zoom, from open data: little ink peaks on the real high ground, forests of tiny trees, rippled coasts and red lettering, from the Pacific down to a single Lakeland fell.
Everyone knows the look. Rows of small inked mountains marching across the land, clusters of trees for the forests, the coast traced again and again with thin lines as if the sea were lapping at it, and the names of kingdoms and seas lettered in red, spaced wide and bent along the land. It is the look of the map in the front of a fantasy novel, and of a lot of older printed maps too. It is lovely, and it is always made by hand, for one place, at one scale.
Web maps are the opposite: they show anywhere, at any zoom, in one smooth modern style. So I tried to make a map that does both. Everything on it is drawn by a rule from open data, live in your browser. Nothing is traced from any artist’s map.
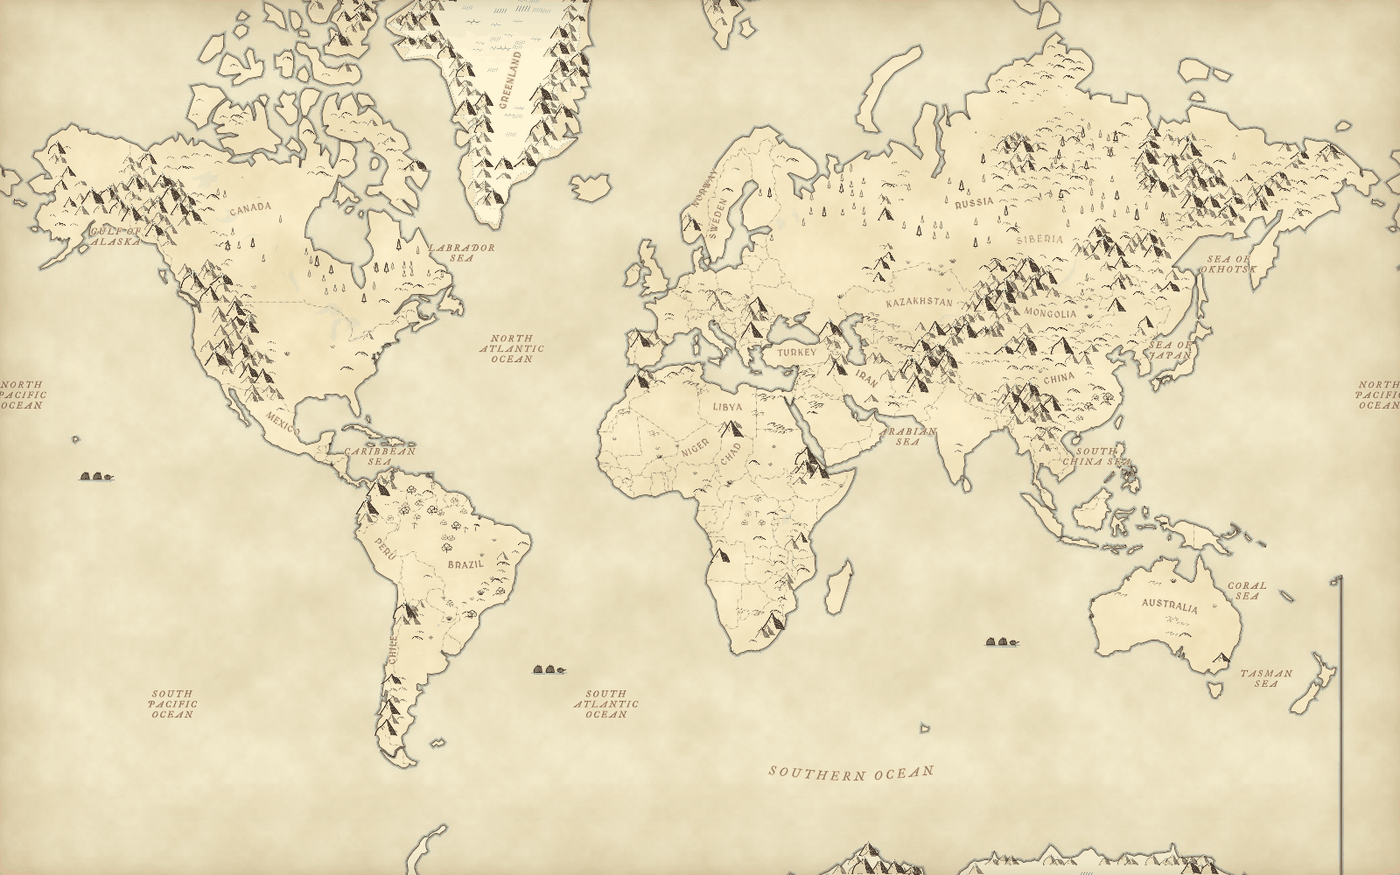
Mountains from elevation
The mountains come from a free elevation model, the AWS Terrain Tiles. The map lays a grid over the land, with cells about 14 screen pixels across, and finds the highest point in each cell. If that point rises far enough above the lowest ground around it, it gets a little inked peak; if it rises less, a rounded hill; if hardly at all, nothing. The trick is that “far enough” depends on the scale. Zoomed right out, where a cell is about 237 km across, a range has to rise about 477 m above its surroundings to earn a peak. In the Lake District at zoom 11, where a cell is about 311 m across, a crag needs about 130 m.
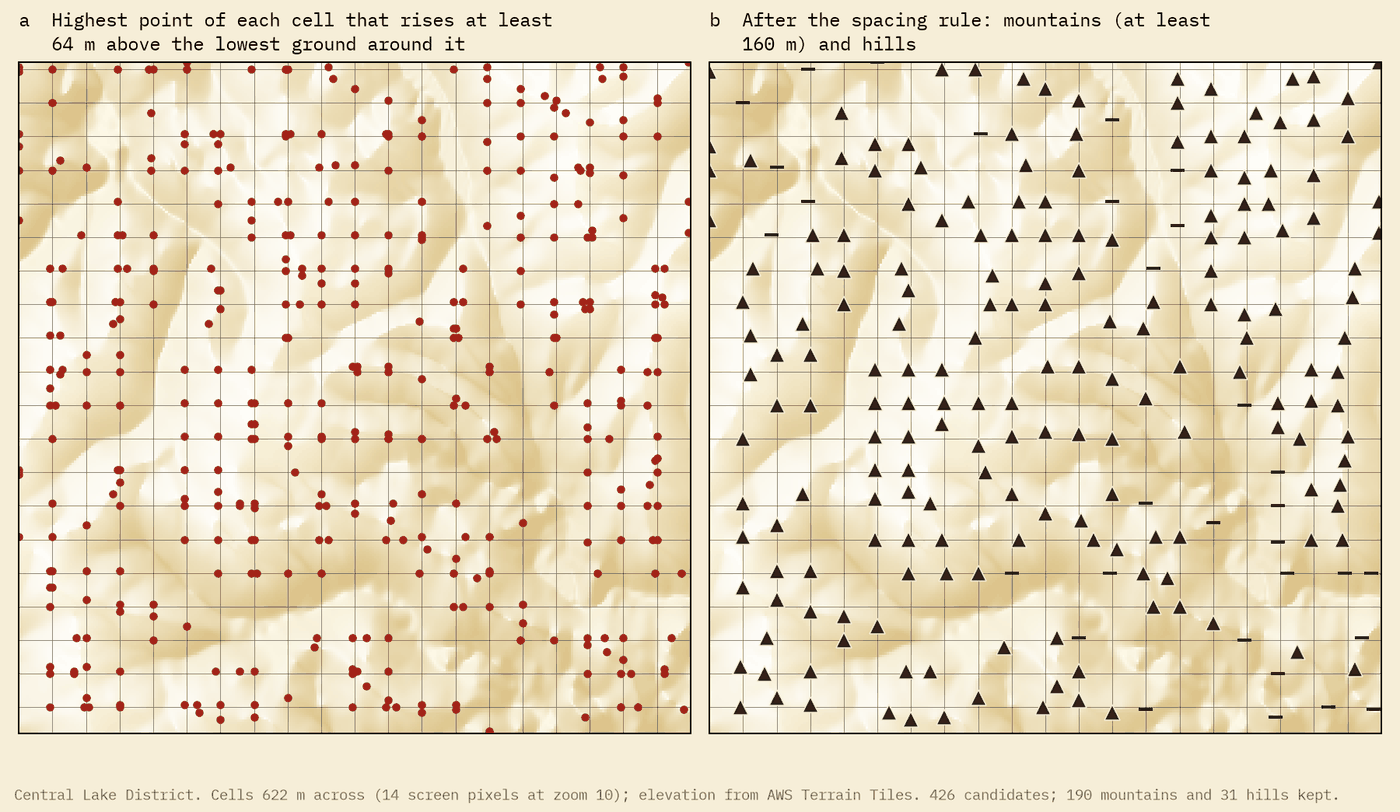
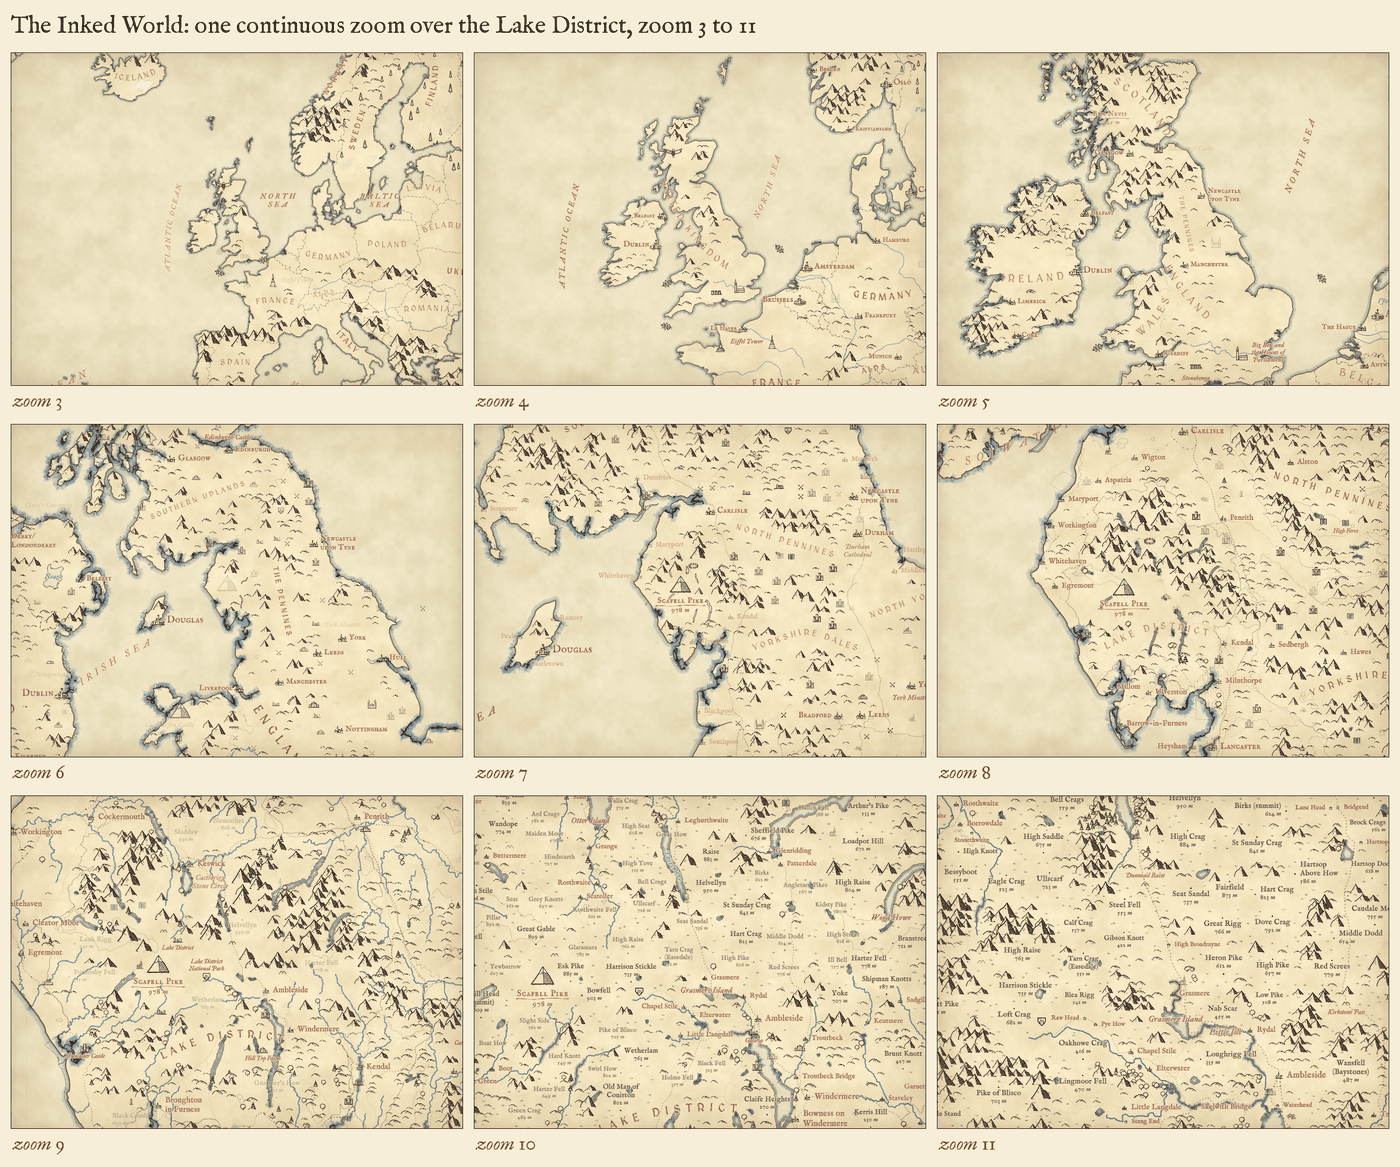
Each cell splits into four as you zoom in, and the highest point of a cell is always the highest point of one of its four children. So a peak drawn at one zoom is still there at the next. Zooming in never swaps the mountains out; it adds smaller ones between them, fading them in. The pen width, the size of the lettering, the number of ripples along the coast and the blue wash on the sea all change smoothly with the zoom, so it stays one drawing.
The glyphs
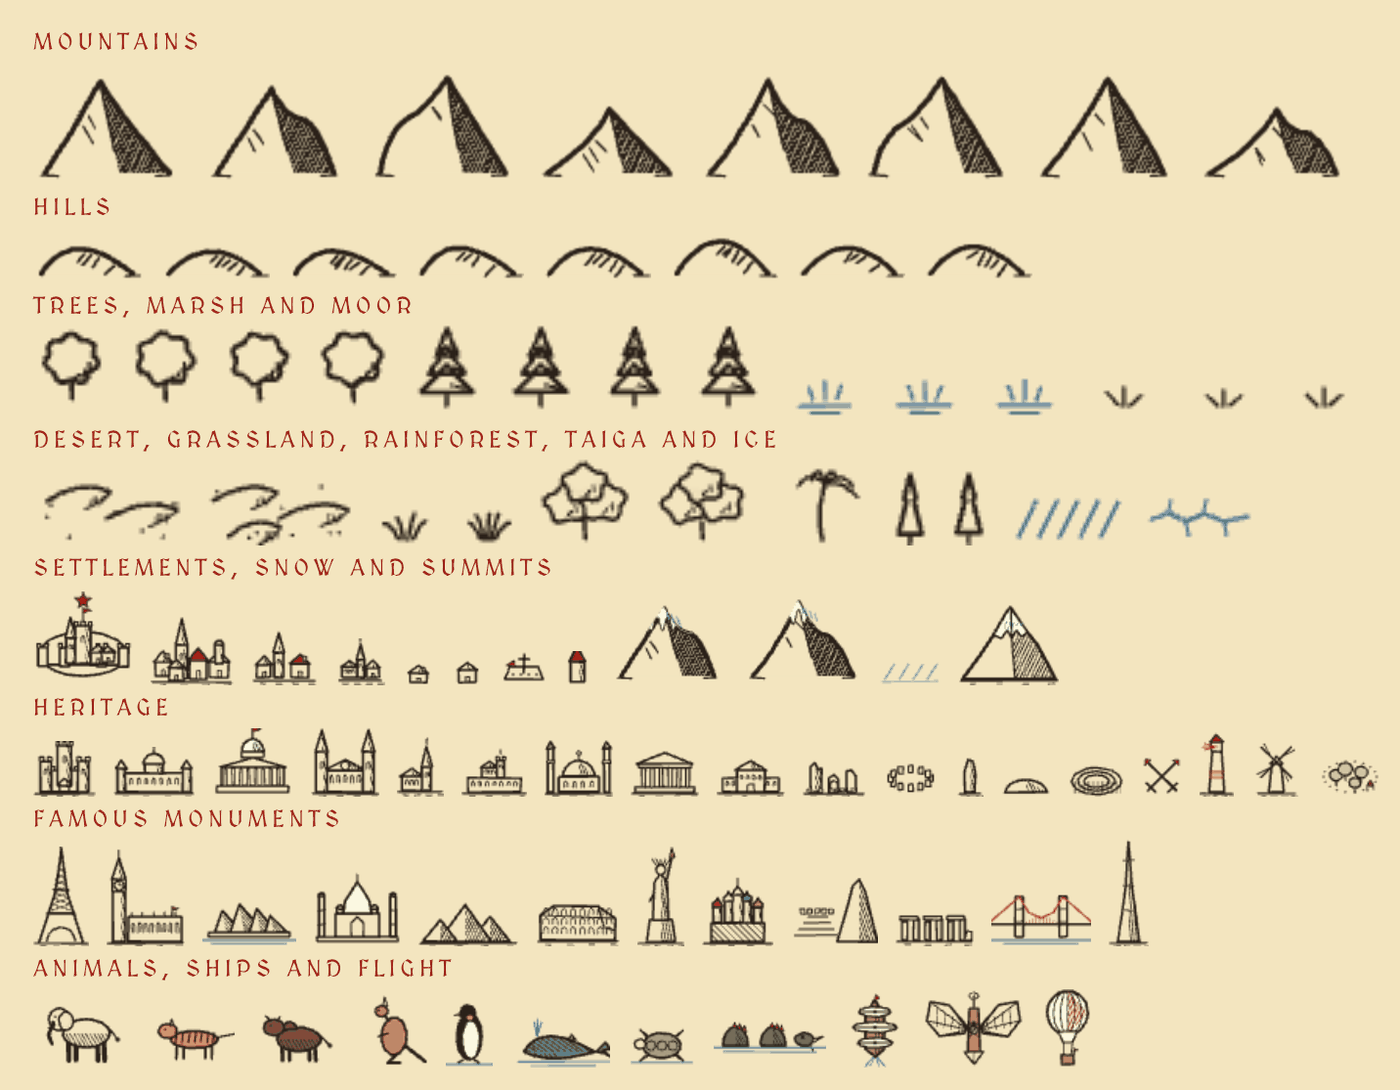
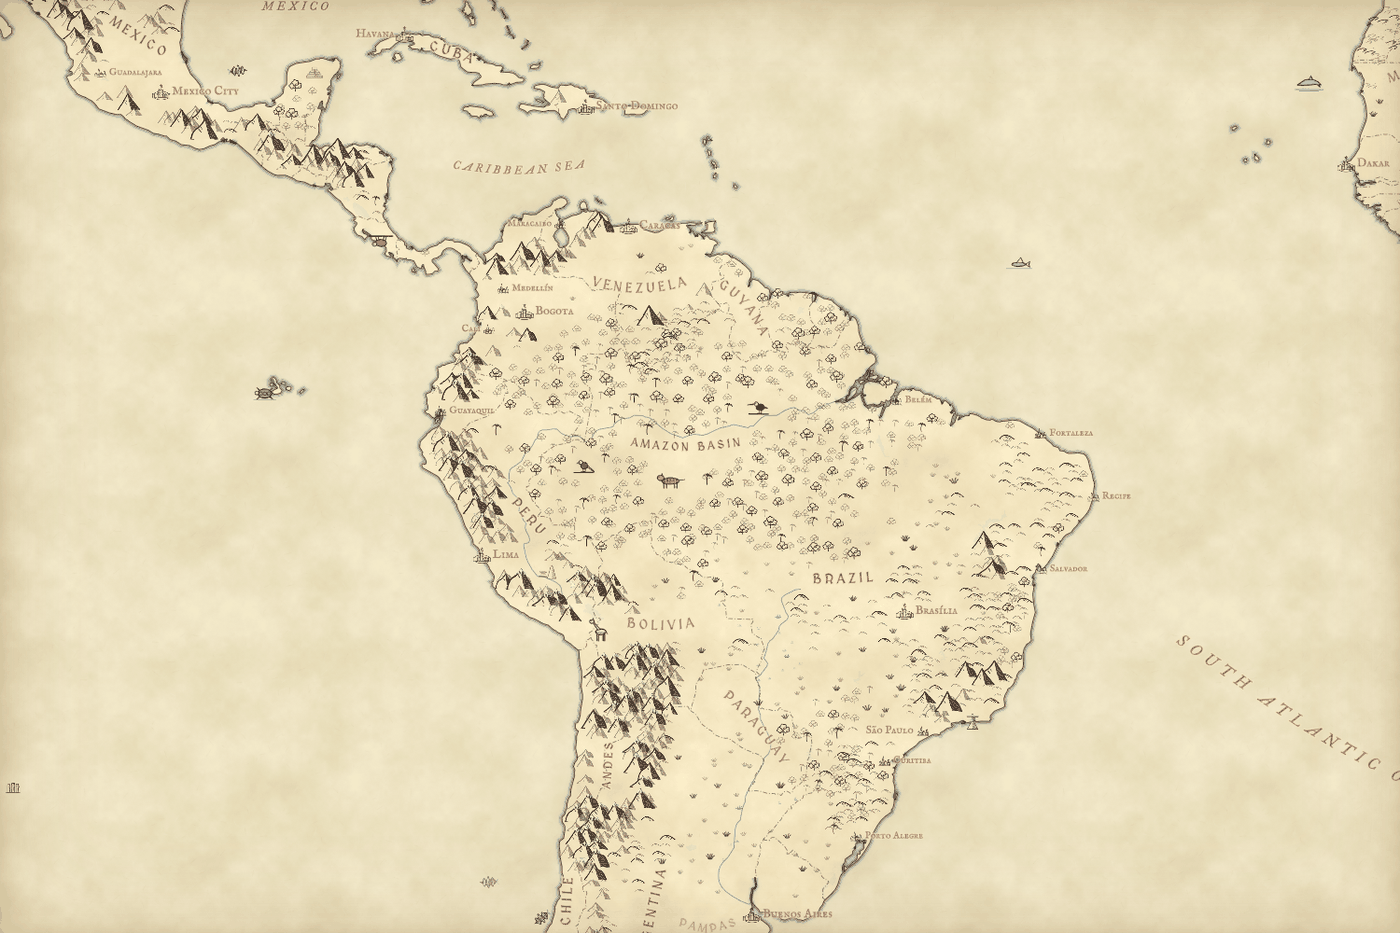
The little drawings are painted by the page itself when it loads, with a slight wobble in every stroke: eight mountains with hatched shadow sides, eight rounded hills, broadleaf and conifer trees, tufts of marsh grass in blue and of moorland in black, and small symbols for cities, towns and villages. Trees only grow inside woods mapped in OpenStreetMap, and tufts inside its wetlands and heaths, so close in you can see the real forests (from zoom 7) and moors (from zoom 9).
Lettering the world
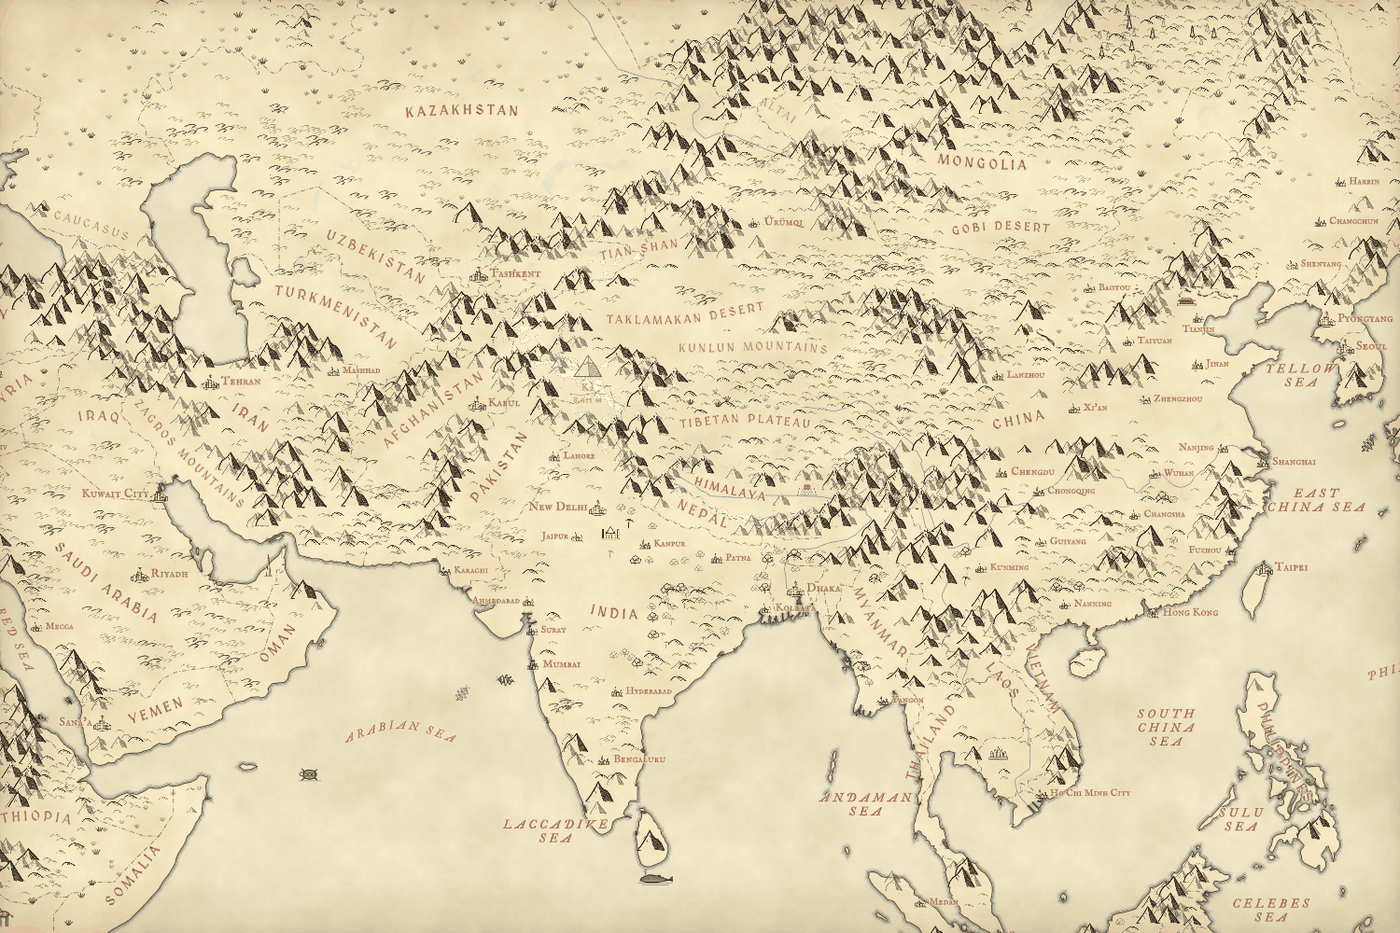
On a hand-drawn map the names matter as much as the mountains. Countries are lettered in red capitals along a gentle curve fitted to their shape, and for 17 awkward ones, such as Russia, Chile, Norway and Indonesia, I drew the curve myself. I also placed 167 names by hand: 62 hills, moors and seas around Britain and Ireland, and 105 oceans, seas, ranges and deserts around the world, from the Pacific and the Sahara to the Tian Shan. Ranges are lettered along their flanks, where a map maker would leave room, not on top of the peaks. Names are placed first and never overlap, and the mountains step aside wherever a name sits.
Zooming in never swaps the mountains out. It adds smaller ones between them.
Great ranges were the hardest part. In the Himalaya every patch of ground is steep, so every cell earns a peak and the map turns into a solid block of ink. So where the ground is saturated with strong relief, a mountain that has three or more higher mountains around it is left out. What remains are the ridges and summits. In hill country like the Lake District this almost never kicks in, so the fells stay as rich as they were. And no glyph is ever drawn on water: each tile reads the sea and lakes from OpenStreetMap, so a seamount, or a speck of an island too small to see, never puts a lone mountain in the middle of the ocean.
Only where the mountains are
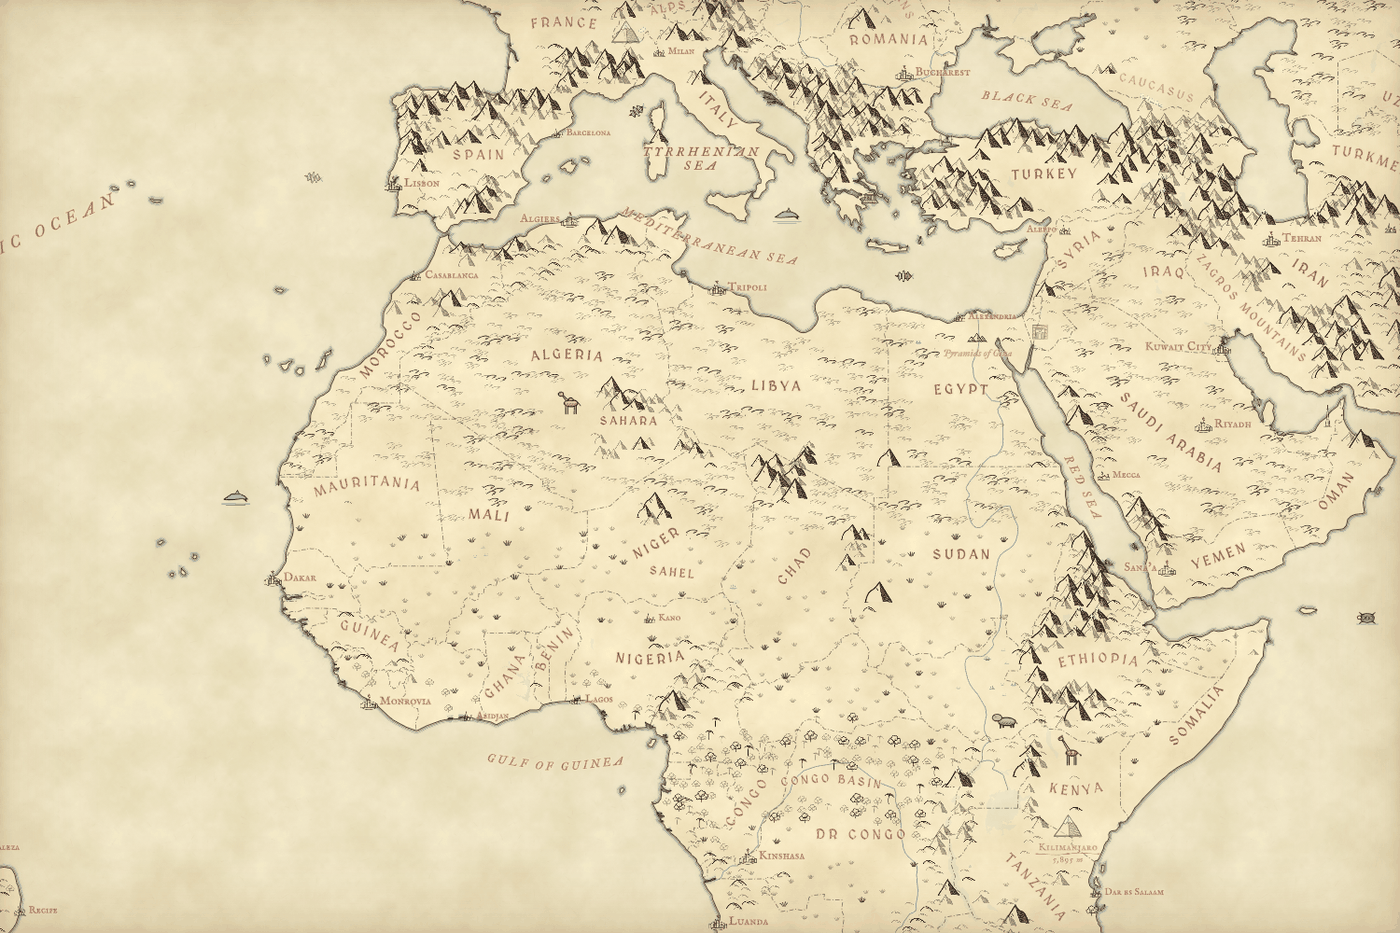
My first world map had a problem: it put peaks across the Sahara, Arabia and the Australian interior. Those places are high, and on coarse elevation tiles they rise a long way above the nearest lowland, but they are not mountains. So every candidate peak now also has to be rugged: the ground close around it must be steep, by a bar that rises as the elevation gets more detailed. In 181 ecoregions whose very names say mountains, like the High Atlas or the Tibesti, the bar is lower; in open deserts, steppe and forest it is higher. The Ahaggar and Tibesti keep their peaks; the sand seas, the Great Plains and the floor of the Tibetan Plateau do not.
Between the ranges the map is drawn by biome, from the RESOLVE Ecoregions map of the world’s 846 ecoregions: crescent dunes in the deserts, sparse tufts on the steppe and savanna, crowded round crowns and the odd palm in the rainforest, small pointed conifers across the taiga, and pale blue hatching on the ice of Greenland and Antarctica.
Down to a single fell
Close in, the map fills up with what OpenStreetMap knows: villages with little ink houses, rivers and lakes named in blue, fells with their heights, faint dotted roads and tracks. In the view of the central Lake District below there are 1,184 mountains, 2,126 hills, 1,702 trees and 6,933 tufts of moorland and marsh, each one placed by a rule.
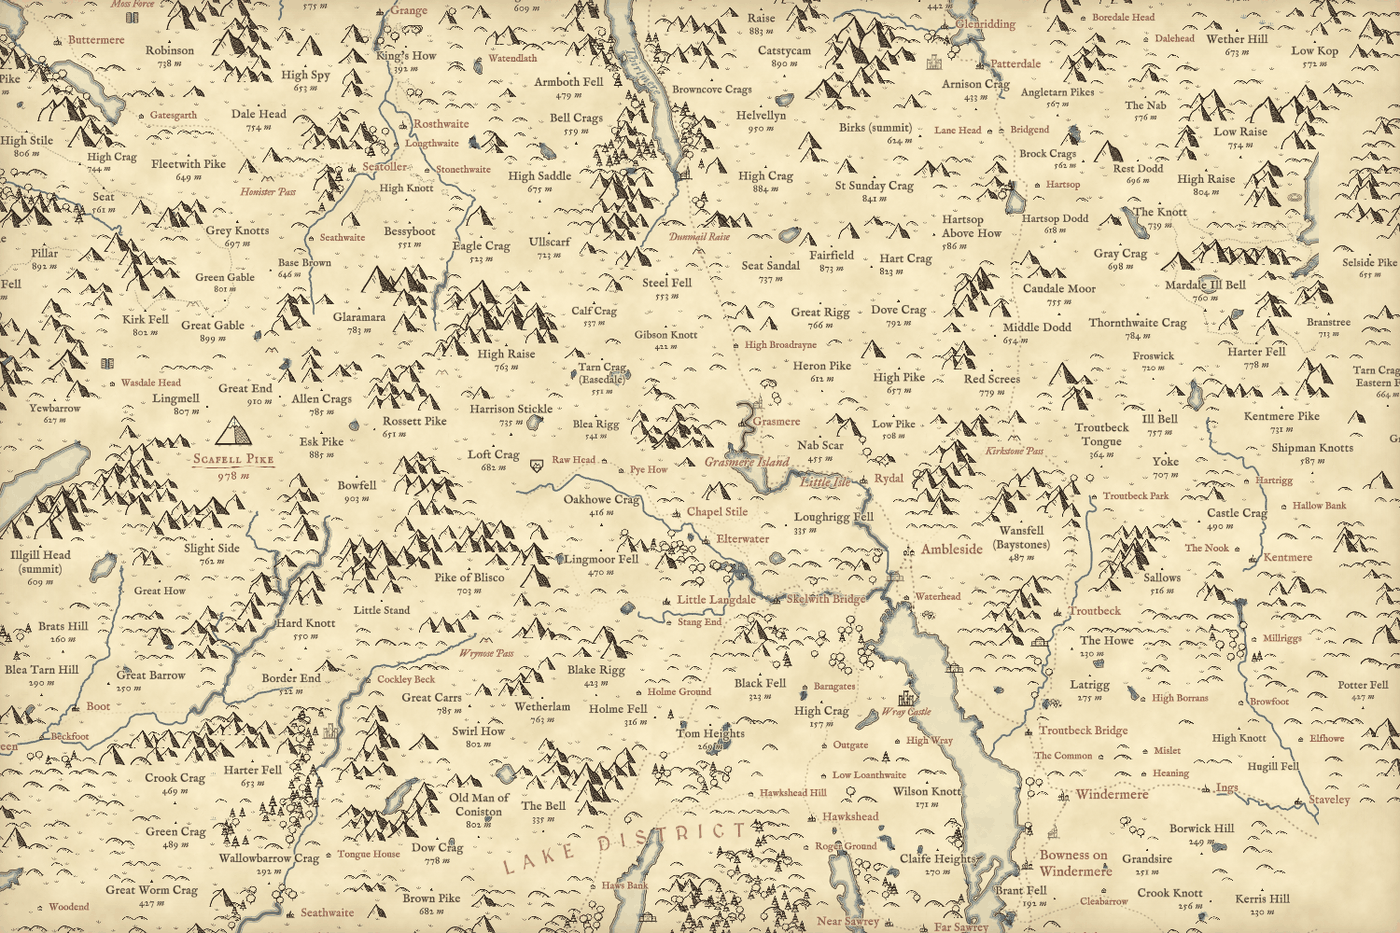
Castles, whales and flying machines
Old maps were never only land and water, so the map now draws what people built and what lives there. More than a quarter of a million heritage sites from Wikidata fade in as you zoom, the best known first: castles, palaces and parliaments, cathedrals and village churches, monasteries, mosques and temples, great houses, ruins, stone circles, barrows and hillforts, battlefields and lighthouses, each a small ink drawing with its name in red italic. About 150 world-famous monuments, from the Eiffel Tower to the Sydney Opera House, have drawings of their own and show from the world view, and Hadrian’s Wall, Offa’s Dyke and the Great Wall follow their real lines.
The highest summits get a finer drawing with snow and their name and height over a red flourish, and every peak above the snow line for its latitude gets a white cap. Close in, towns fill with little townhouses along the real streets, packed round a market square and church and thinning out at the edges. Far out, elephants, tigers, bison and kangaroos stand in their native ranges, whales gather where they really do, sailing ships leave the old ports along lanes from real logbooks, and the busiest airports are drawn as Renaissance flying machines taking off. The sea serpents and balloons are there for fun, and the key says so.
How I did this
The page uses MapLibre, with vector tiles of OpenStreetMap from OpenFreeMap, which is free and needs no key, and the AWS Terrain Tiles for elevation. A small background worker turns elevation and land cover into glyph positions for each tile as you pan and zoom, so the whole world works with nothing pre-rendered. The lettering uses the free MedievalSharp and IM Fell fonts. There is a layers panel, including a plain modern map to check where you are, search for places and peaks, and a full-screen button. The paper sets out every rule and its limits: peaks sit on the high points of grid cells rather than on named summits, their size shows local relief rather than height, and woods are only as complete as OpenStreetMap.
Notes and sources
- Map data © OpenStreetMap contributors (Open Database Licence), as vector tiles from OpenFreeMap in the OpenMapTiles schema.
- Elevation: AWS Terrain Tiles, built by Mapzen from SRTM, GMTED2010, ETOPO1 and other sources.
- Biomes: RESOLVE Ecoregions 2017 (CC BY 4.0), Dinerstein et al. (2017) BioScience 67, 534 to 545.
- Heritage sites, landmarks and summits: Wikidata (CC0). Ship lanes: CLIWOC, the Climatological Database for the World’s Oceans 1750 to 1850.
- Natural Earth country outlines, places and states (public domain), and ONS Local Authority District boundaries (Open Government Licence v3.0), used for the lettering and search.
- Fonts: MedievalSharp and the IM Fell types (SIL Open Font License). Map library: MapLibre GL JS.
- The design is my own; it was inspired by the general look of hand-drawn maps, and no artwork, lettering or emblem from any map was traced or reused.
- I wrote the text, with drafting and editing assistance from Claude (Anthropic), which also helped prepare the analysis code. I reviewed and checked all text and results.

