
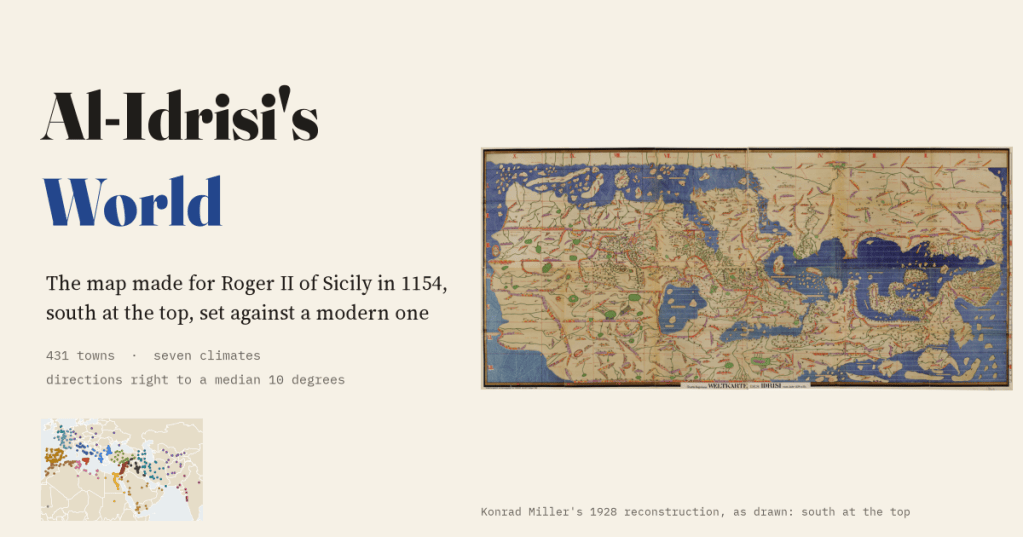
In 1154 a Muslim geographer in Palermo finished a map of the known world for the Norman king of Sicily. It has south at the top. I read 431 of its towns, put them on a modern map, and measured how right it is.
Al-Idrisi was born in Ceuta, on the African side of the Strait of Gibraltar, and made his name at the court of Roger II, the Norman king of Sicily. For Roger he wrote a geography of the whole known world, the Book of Roger, and drew a map to go with it. The book divides the world into seven climates, bands of latitude running from the equator to the cold north, and cuts each climate into ten sections from west to east. Put the seventy sections together and you get one long rectangle of the world, from the Atlantic to China, with Arabia and Africa at the top and Europe hanging underneath.
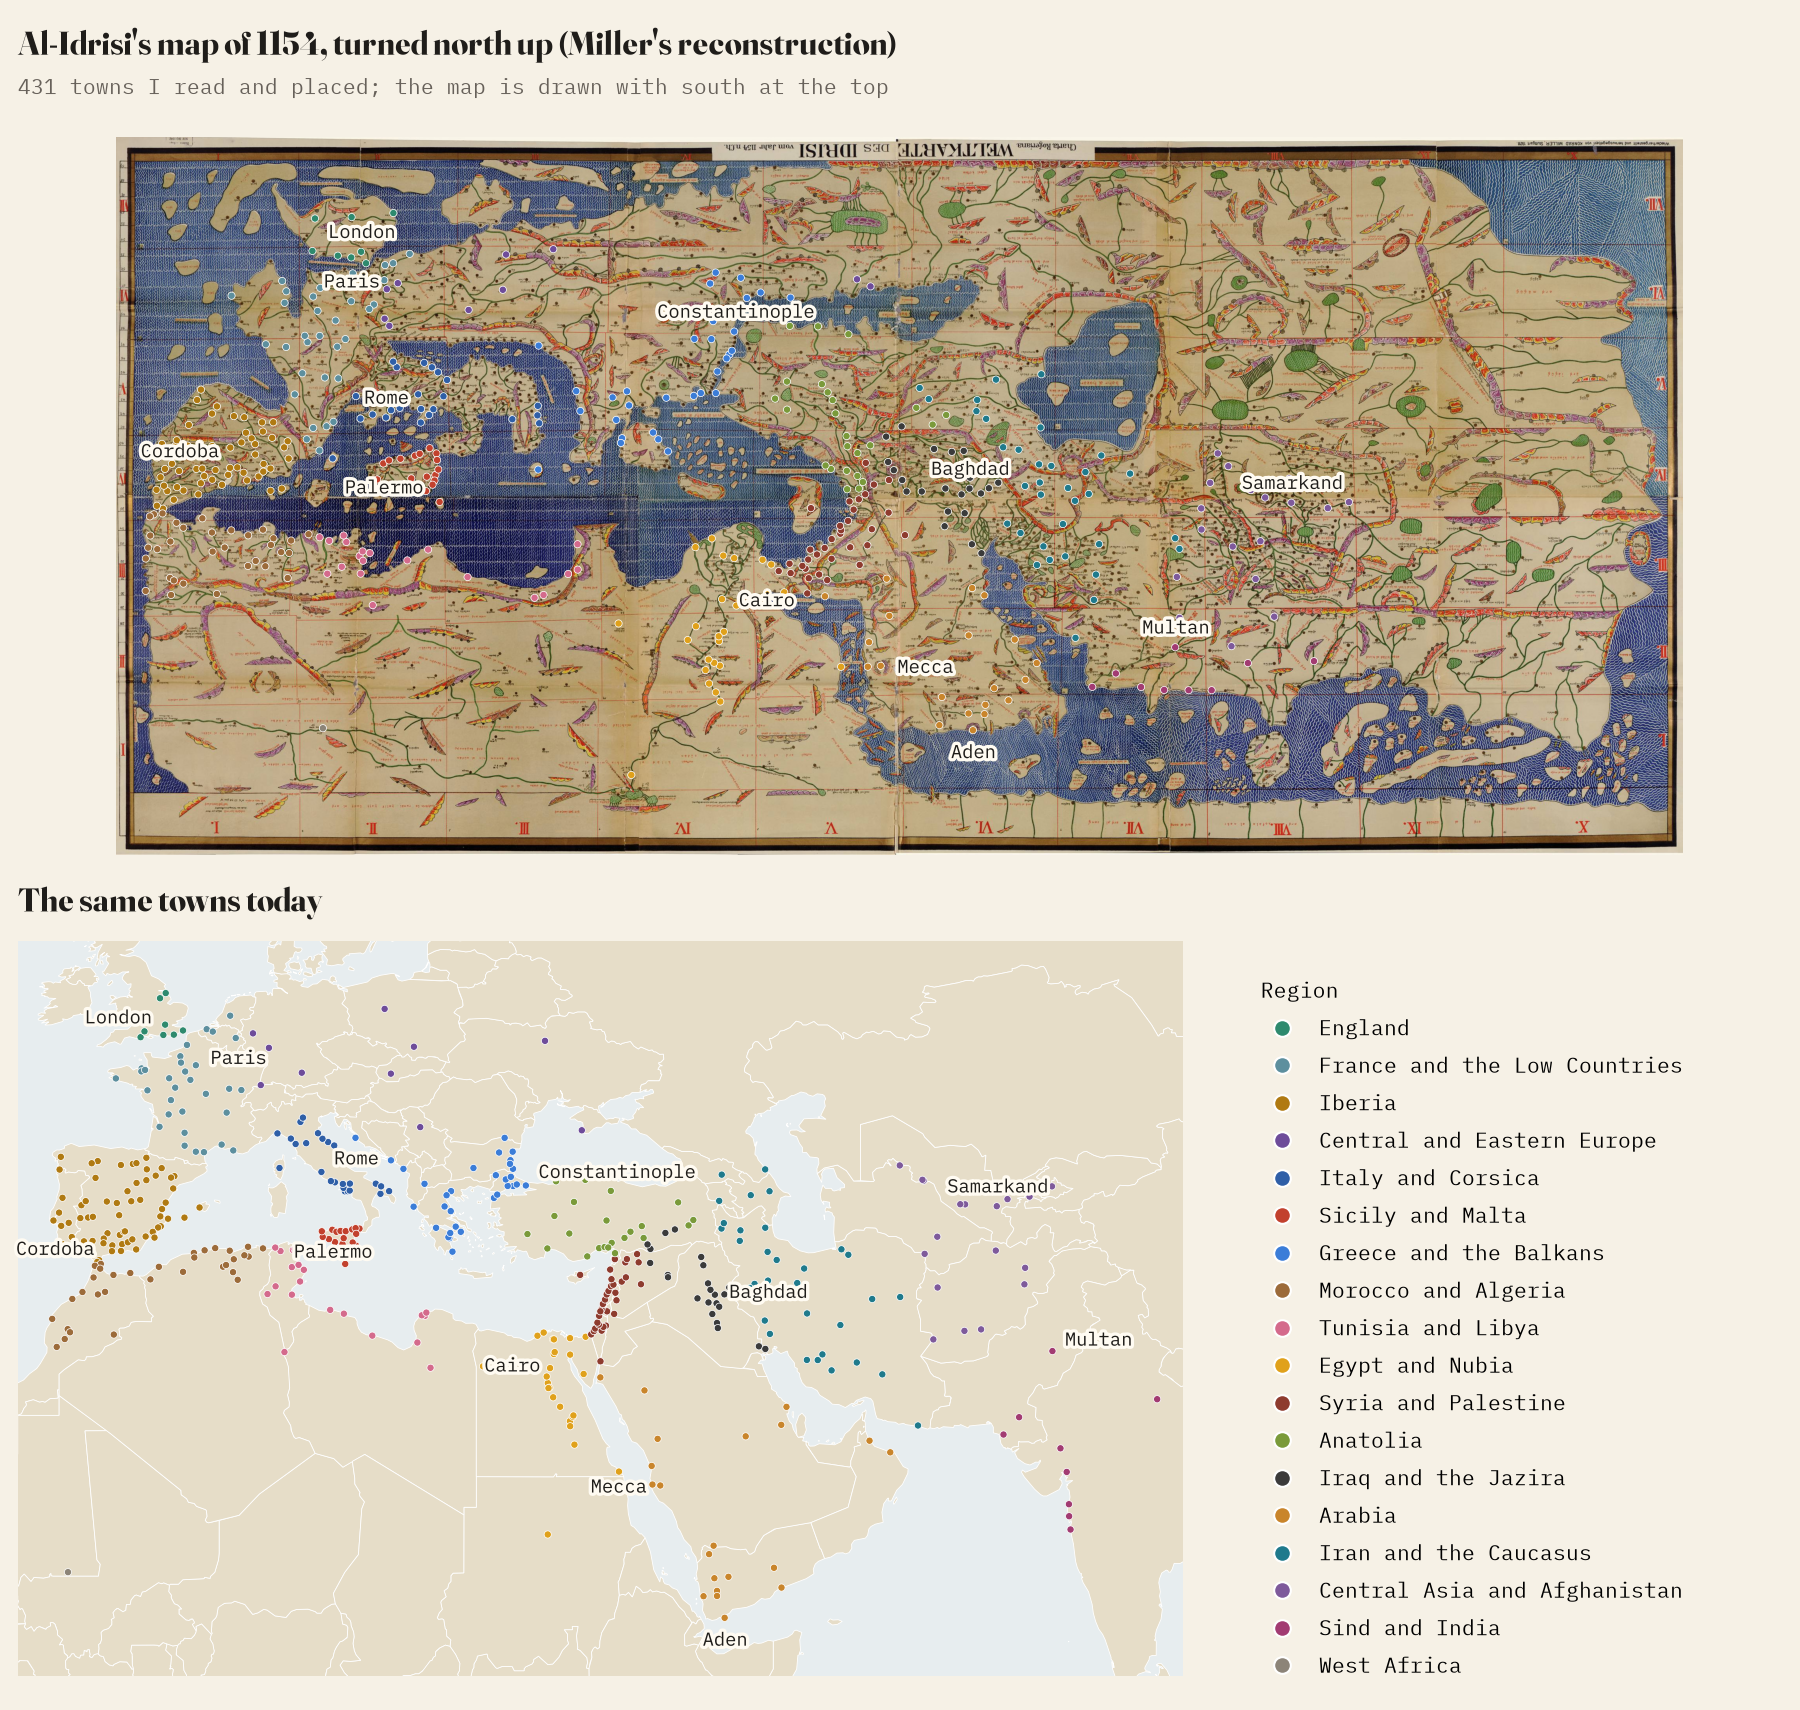
The original map is lost. In 1928 the German scholar Konrad Miller rebuilt it from the manuscripts as one great sheet, with every name written out in Latin letters. I went through that sheet section by section and read the town labels I could identify with confidence: 431 of them, from Lisbon and Salisbury to Aden and Kannauj. Then I turned the map north up and set it against a modern one.
It points the right way
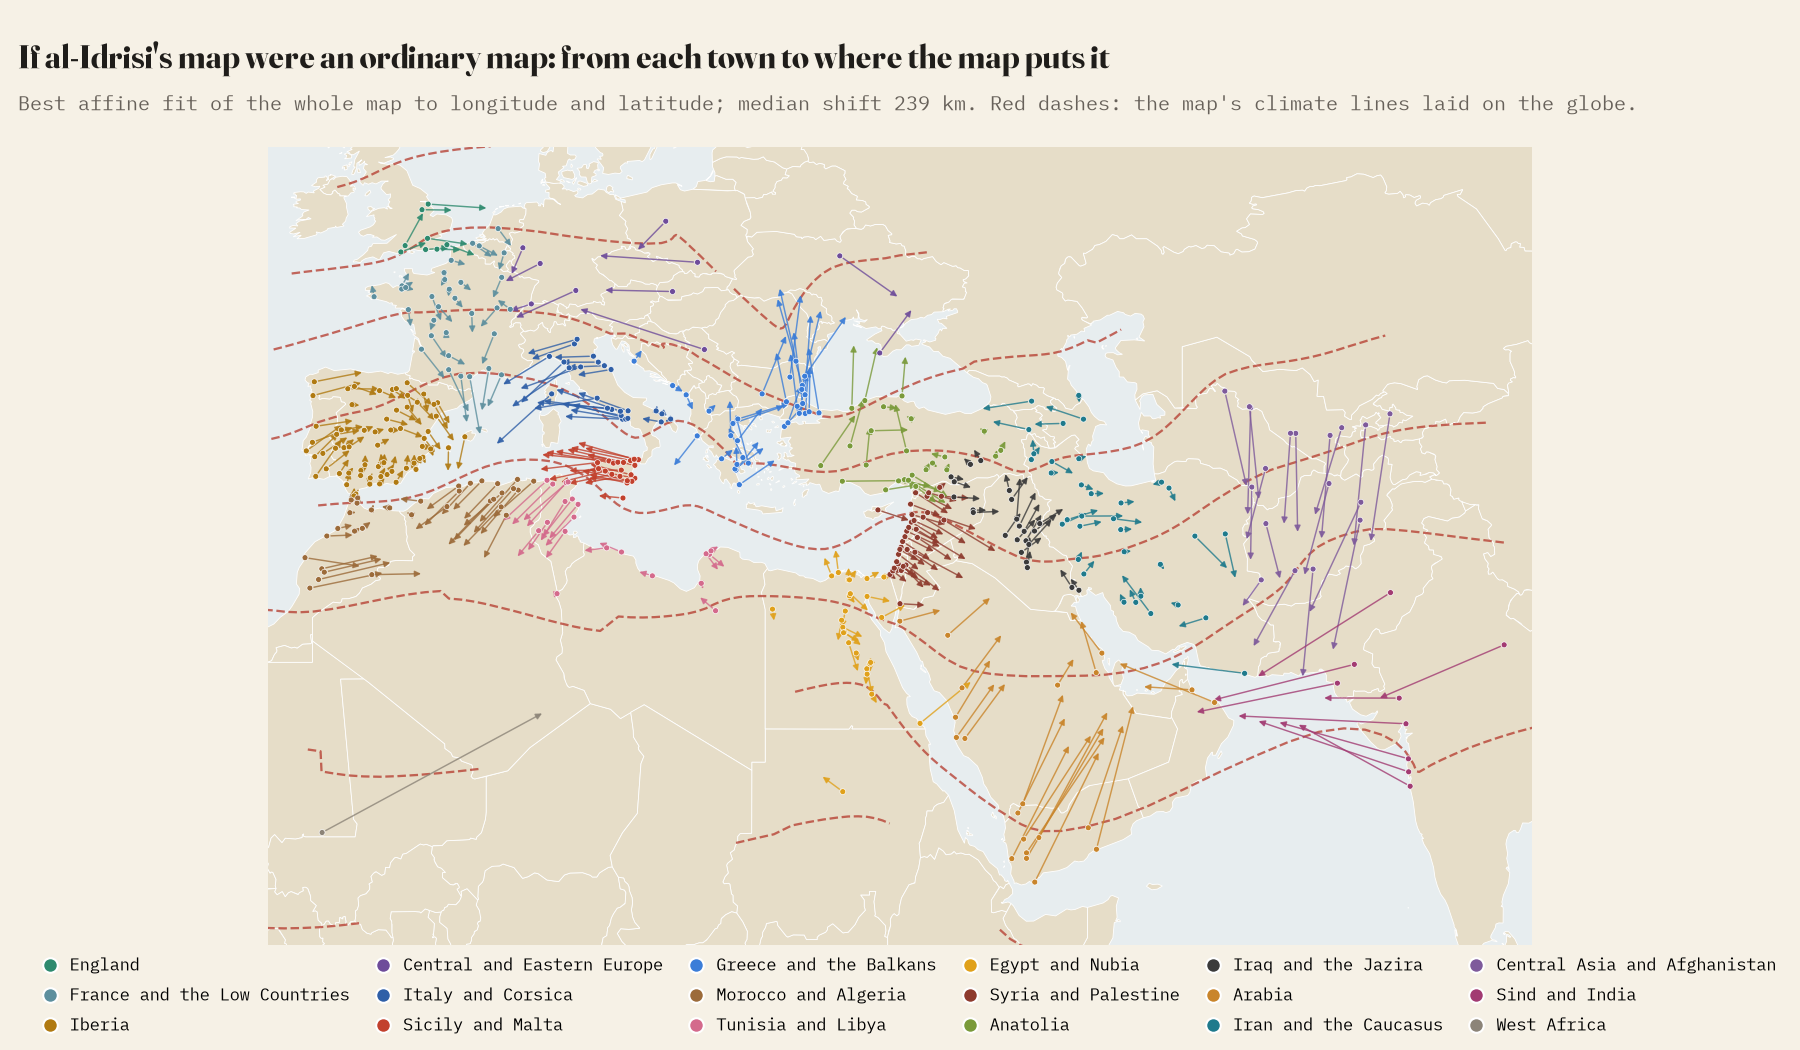
Turned north up, the map is recognisably the Old World. Across all 92,193 pairs of towns at least 100 km apart, the direction from one to the other is out by a median of just 10 degrees, and 99% are within 45 degrees. Where it goes wrong is in the joins. If you lay the whole map on the globe with the best stretch and shift, the median town lands 239 km from where it is: Arabia slides north, India is pulled west, and the Black Sea coast drifts.
Best at home
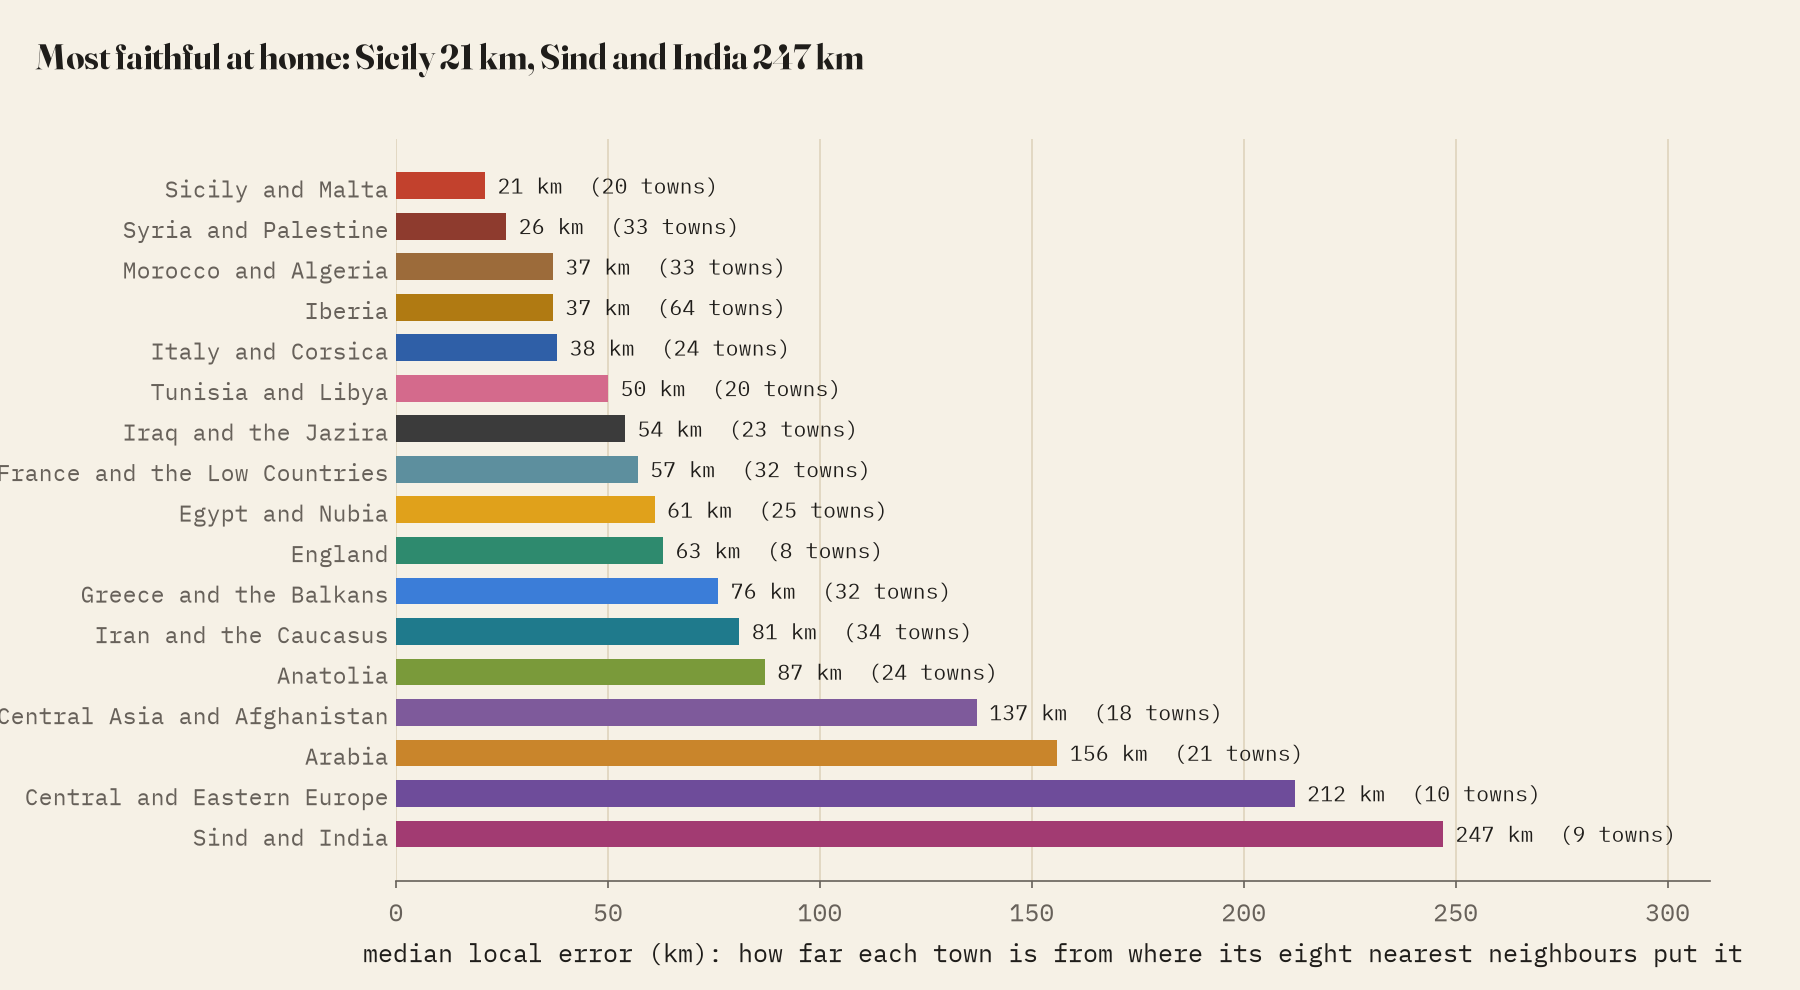
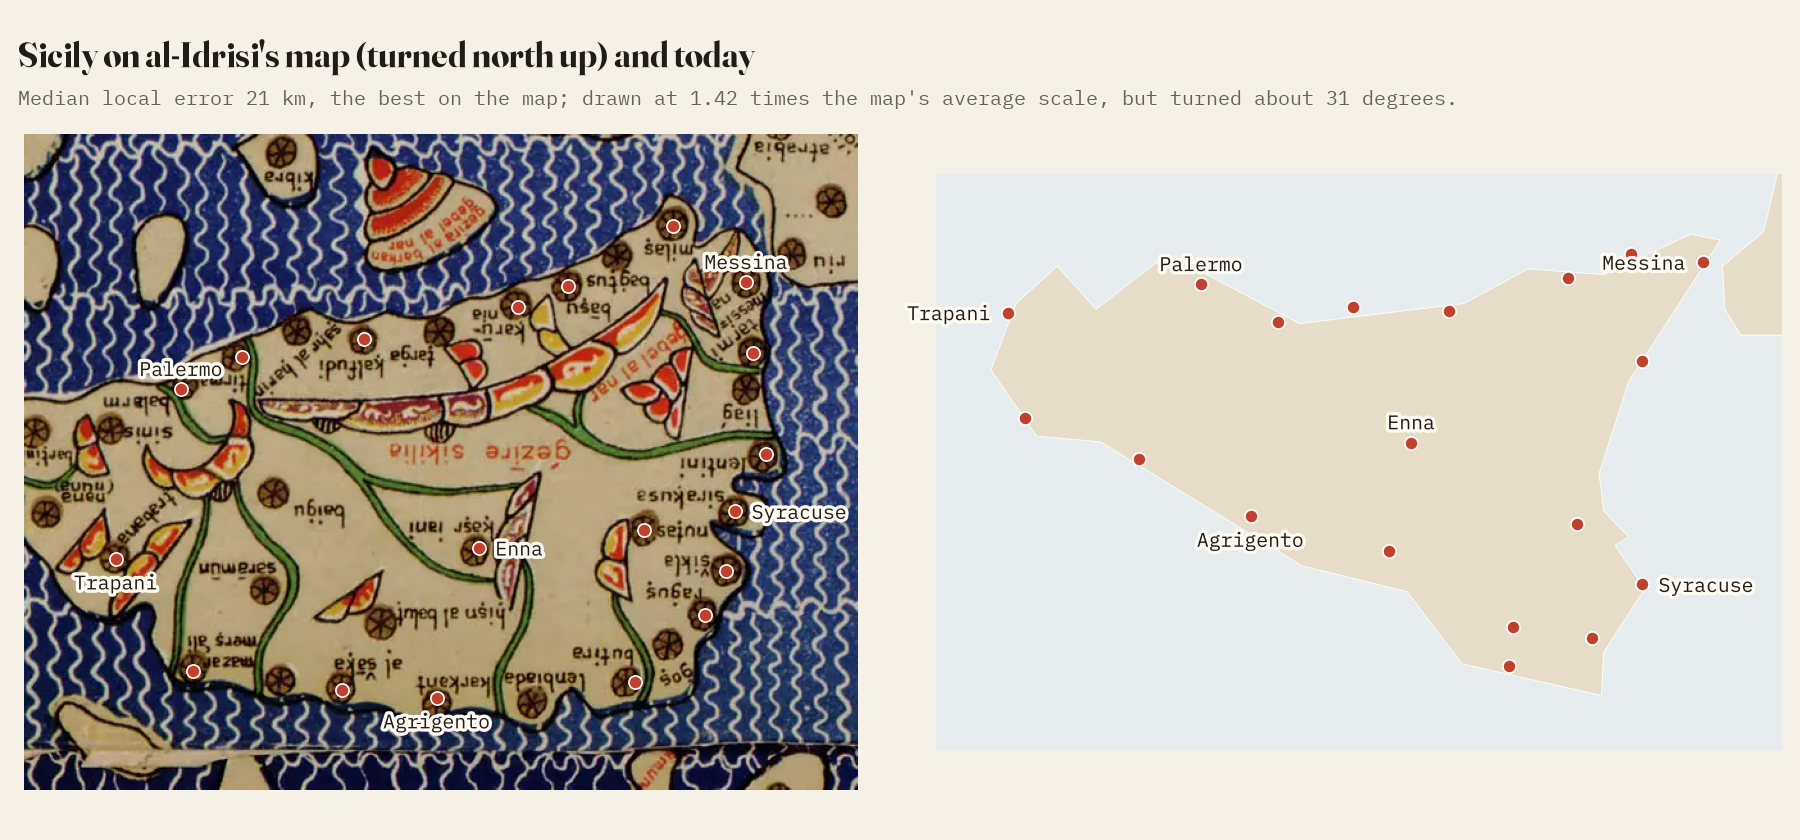
A fairer test is local. For each town I took its eight nearest real neighbours and asked where they, on the map, say it should be. The median miss is 55 km. Around the Mediterranean it is 44 km; in northern Europe 71 km; in Asia beyond the Euphrates 92 km. The best drawn region of all is Sicily, Roger’s own island, at 21 km. That is what you would expect of a map made the way al-Idrisi says it was, by gathering the reports of travellers who came to the court at Palermo.
Sicily is also drawn bigger than anywhere else: at 1.42 times the map’s average scale, against 0.59 for Arabia. The rectangular grid alone cannot explain it. Its one flaw is that the whole island is turned about 31 degrees.
Seven shelves
The climates do their job: the towns of each one are, on average, further north than the one before, without exception. But the map draws every climate the same height, and the world is not like that. The latitudes that best separate the towns of neighbouring climates fall at about 18, 29, 36, 40, 47 and 53 degrees north, so the second climate covers 10.6 degrees and the middle ones about 6. The thinly known south is squeezed; the crowded Mediterranean is spread out.
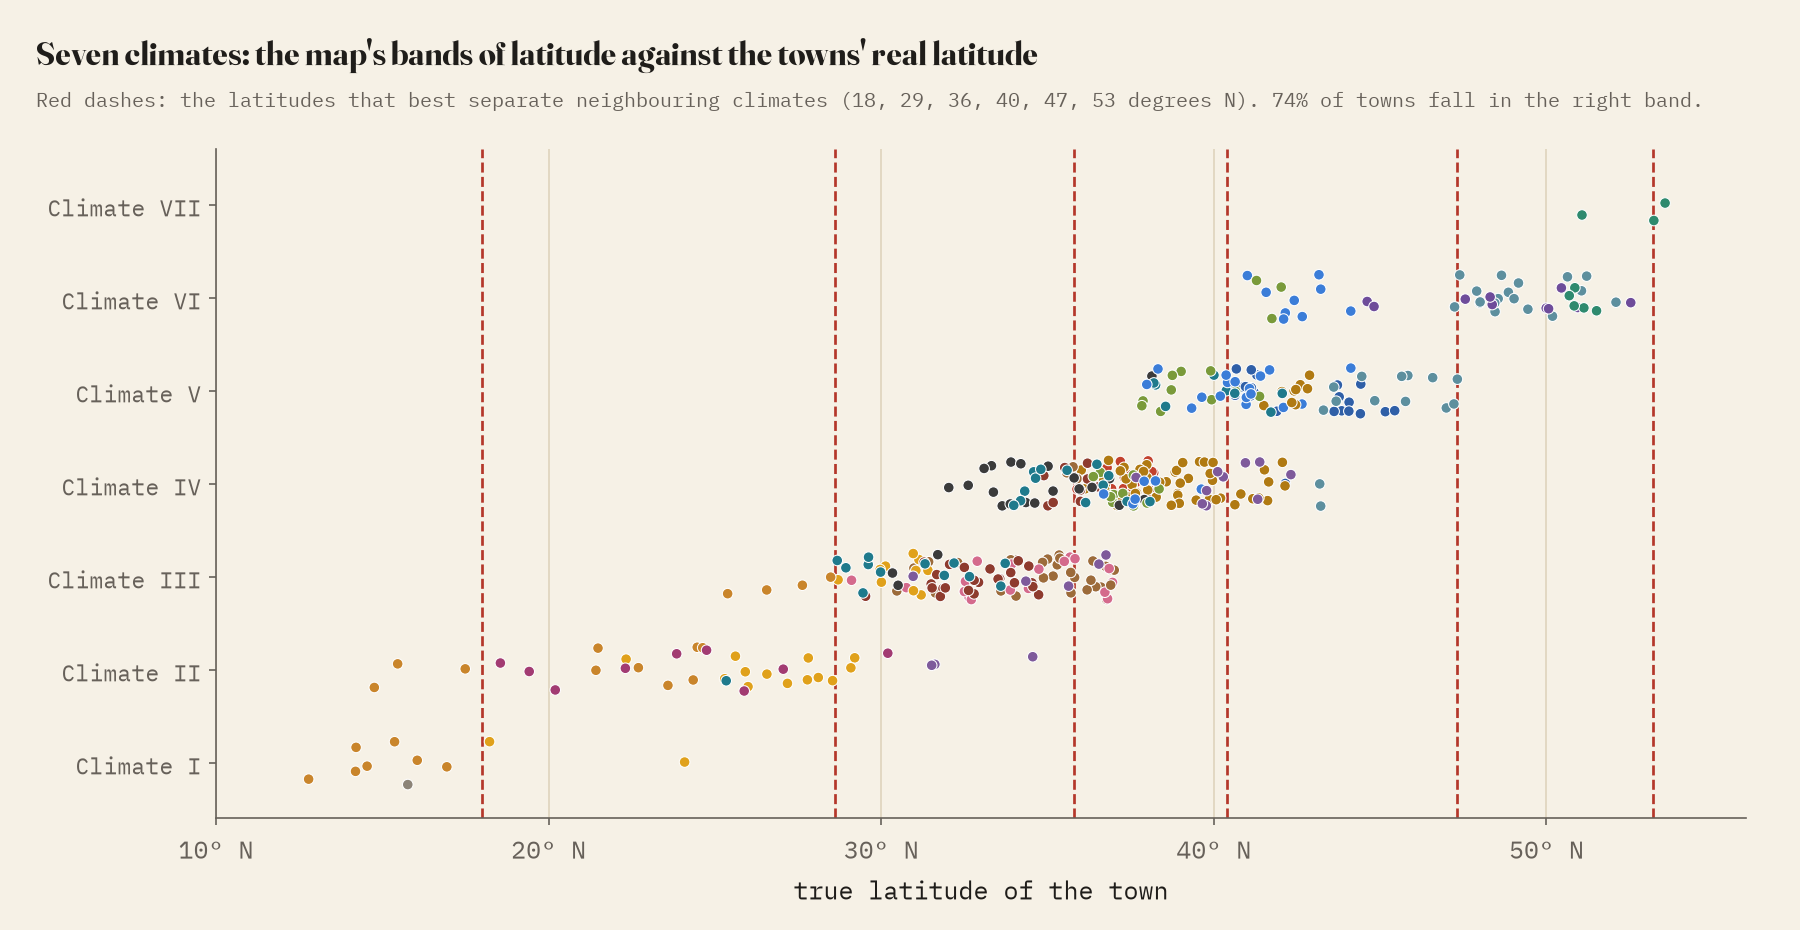
Two places stand out. The Nile rises at the top of the map in the Mountains of the Moon, which the text puts sixteen degrees beyond the equator; the map draws them barely past it. And England, “the island of Inkiltara”, sits astride the sixth and seventh climates at very nearly the right latitude, but turned so that Paris lies almost due south of London.
Miles and days
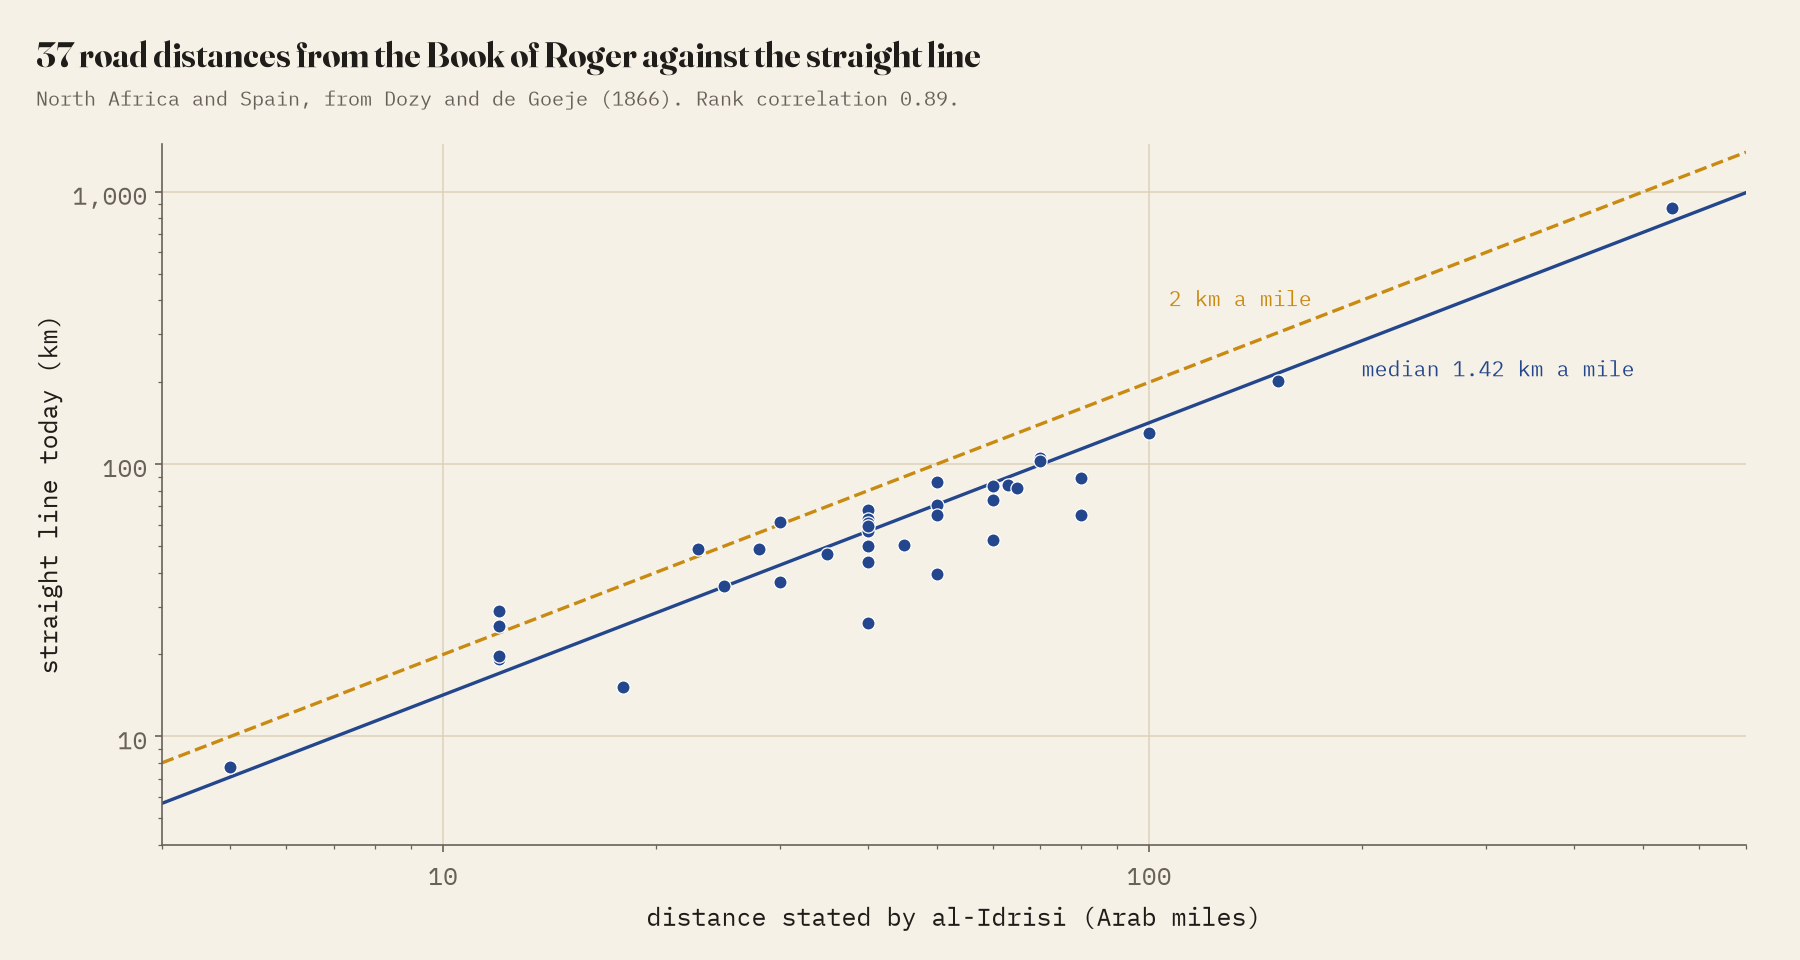
The Book of Roger is full of distances. From an 1866 edition of its chapters on North Africa and Spain I took 63 between towns I could identify. They hang together well: the stated miles rise with the real distance, at a median of 1.42 km of straight line per mile, and a day’s journey comes to about 36 km. With an Arab mile of about 2 km, the roads were some 35 to 40% longer than the straight line, or the miles were shorter than we think.
Palermo and Hereford
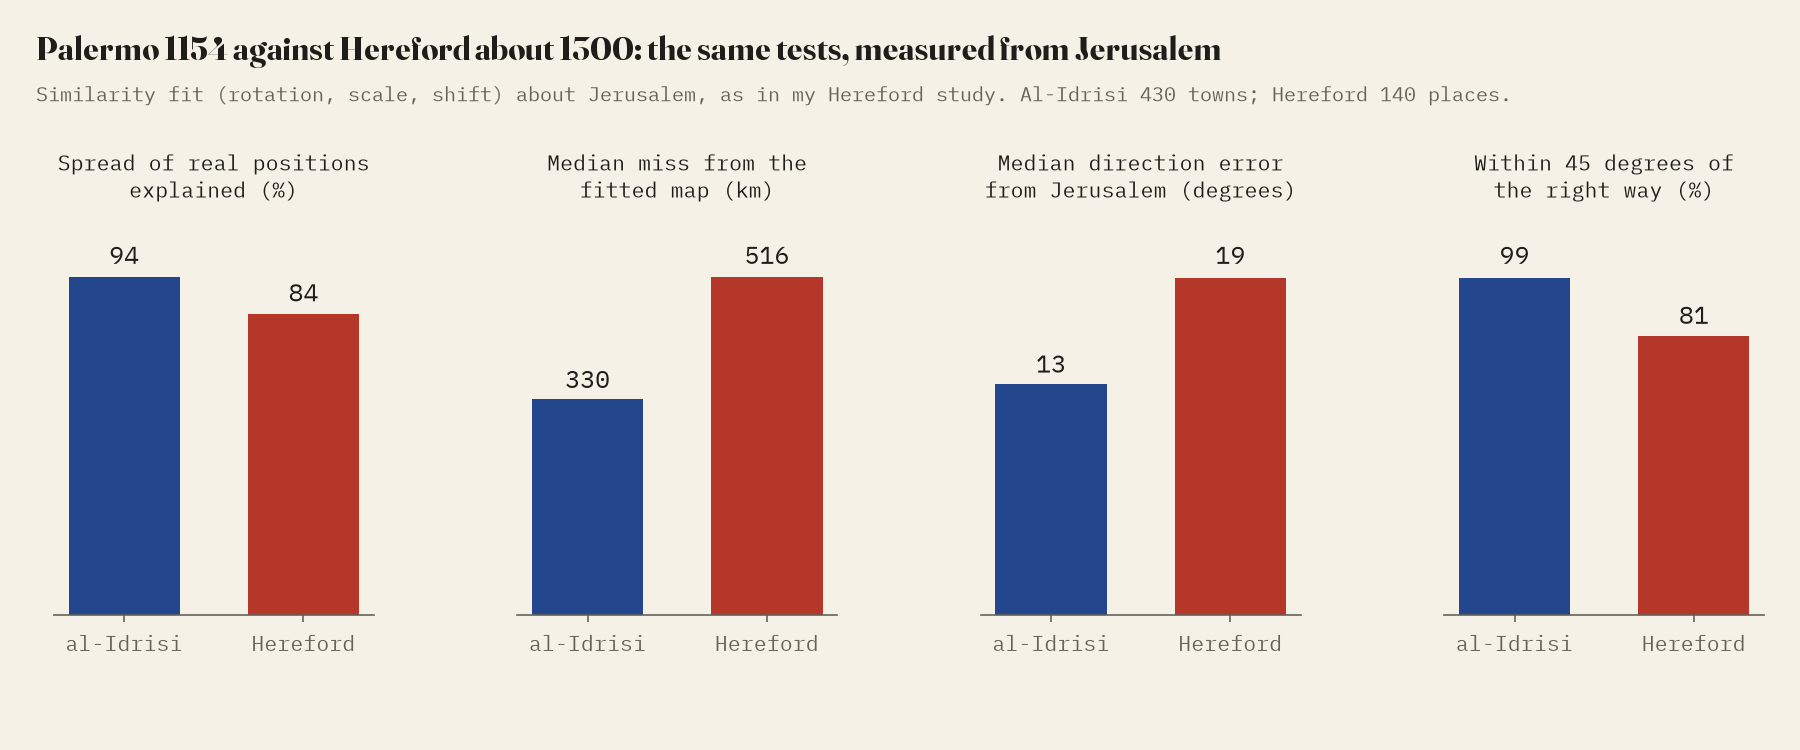
About 146 years later, someone in Hereford drew the most famous Christian map of the world, with east at the top and Jerusalem at the centre. I measured it the same way. On the same tests al-Idrisi wins clearly: measured from Jerusalem, his map explains 0.94 of the spread of real positions against 0.84, and the median place lands 330 km from where it should be against 516 km. Hereford swells the Holy Land to 4.5 times its average scale; al-Idrisi gives Syria and Palestine 1.25. One is a sermon in pictures, the other a geographer’s survey. Both spend most on home.
How I did this
All positions are on Miller’s 1928 reconstruction, not on a medieval manuscript. I read the labels by eye and snapped 90% of my readings to the town symbols found automatically on the image. I identified each town and checked 85% of them against the al-Thurayya, Pleiades and Natural Earth gazetteers; the rest are small places. The sample is thin in India, eastern Europe and Africa south of the Sahara, so treat those figures with care. The distances come from Dozy and de Goeje’s 1866 edition, each checked against the line of the scan it comes from. The data, code and paper have the details.
Notes and sources
- Konrad Miller’s 1928 reconstruction of the map, Wikimedia Commons, public domain.
- R. Dozy and M. J. de Goeje, Description de l’Afrique et de l’Espagne par Edrisi (1866), public domain.
- al-Thurayya Gazetteer, CC BY 4.0; Pleiades, version 4.1, CC BY 3.0; Natural Earth (public domain).
- I wrote the text, with drafting and editing assistance from Claude (Anthropic), which also helped prepare the analysis code. I reviewed and checked all text and results.


