
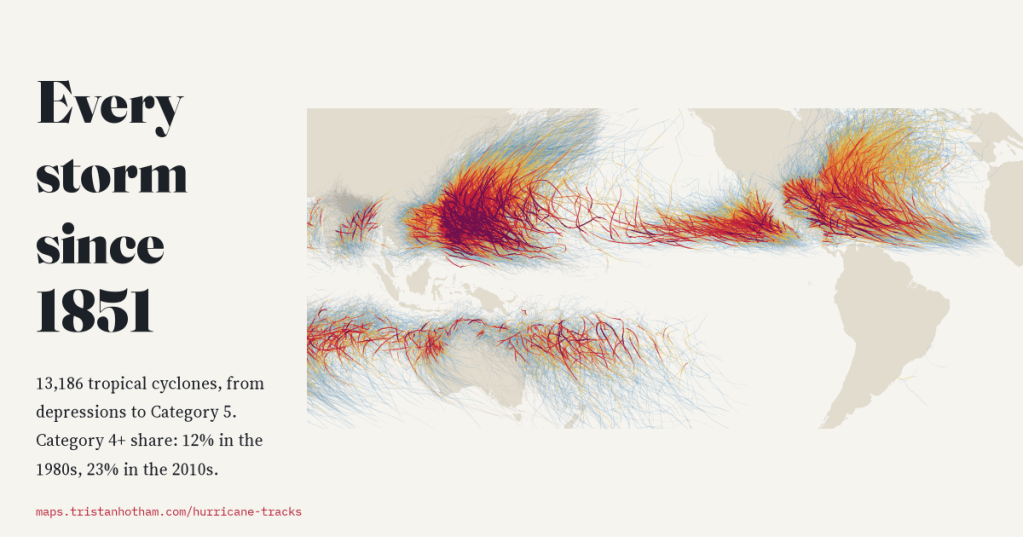
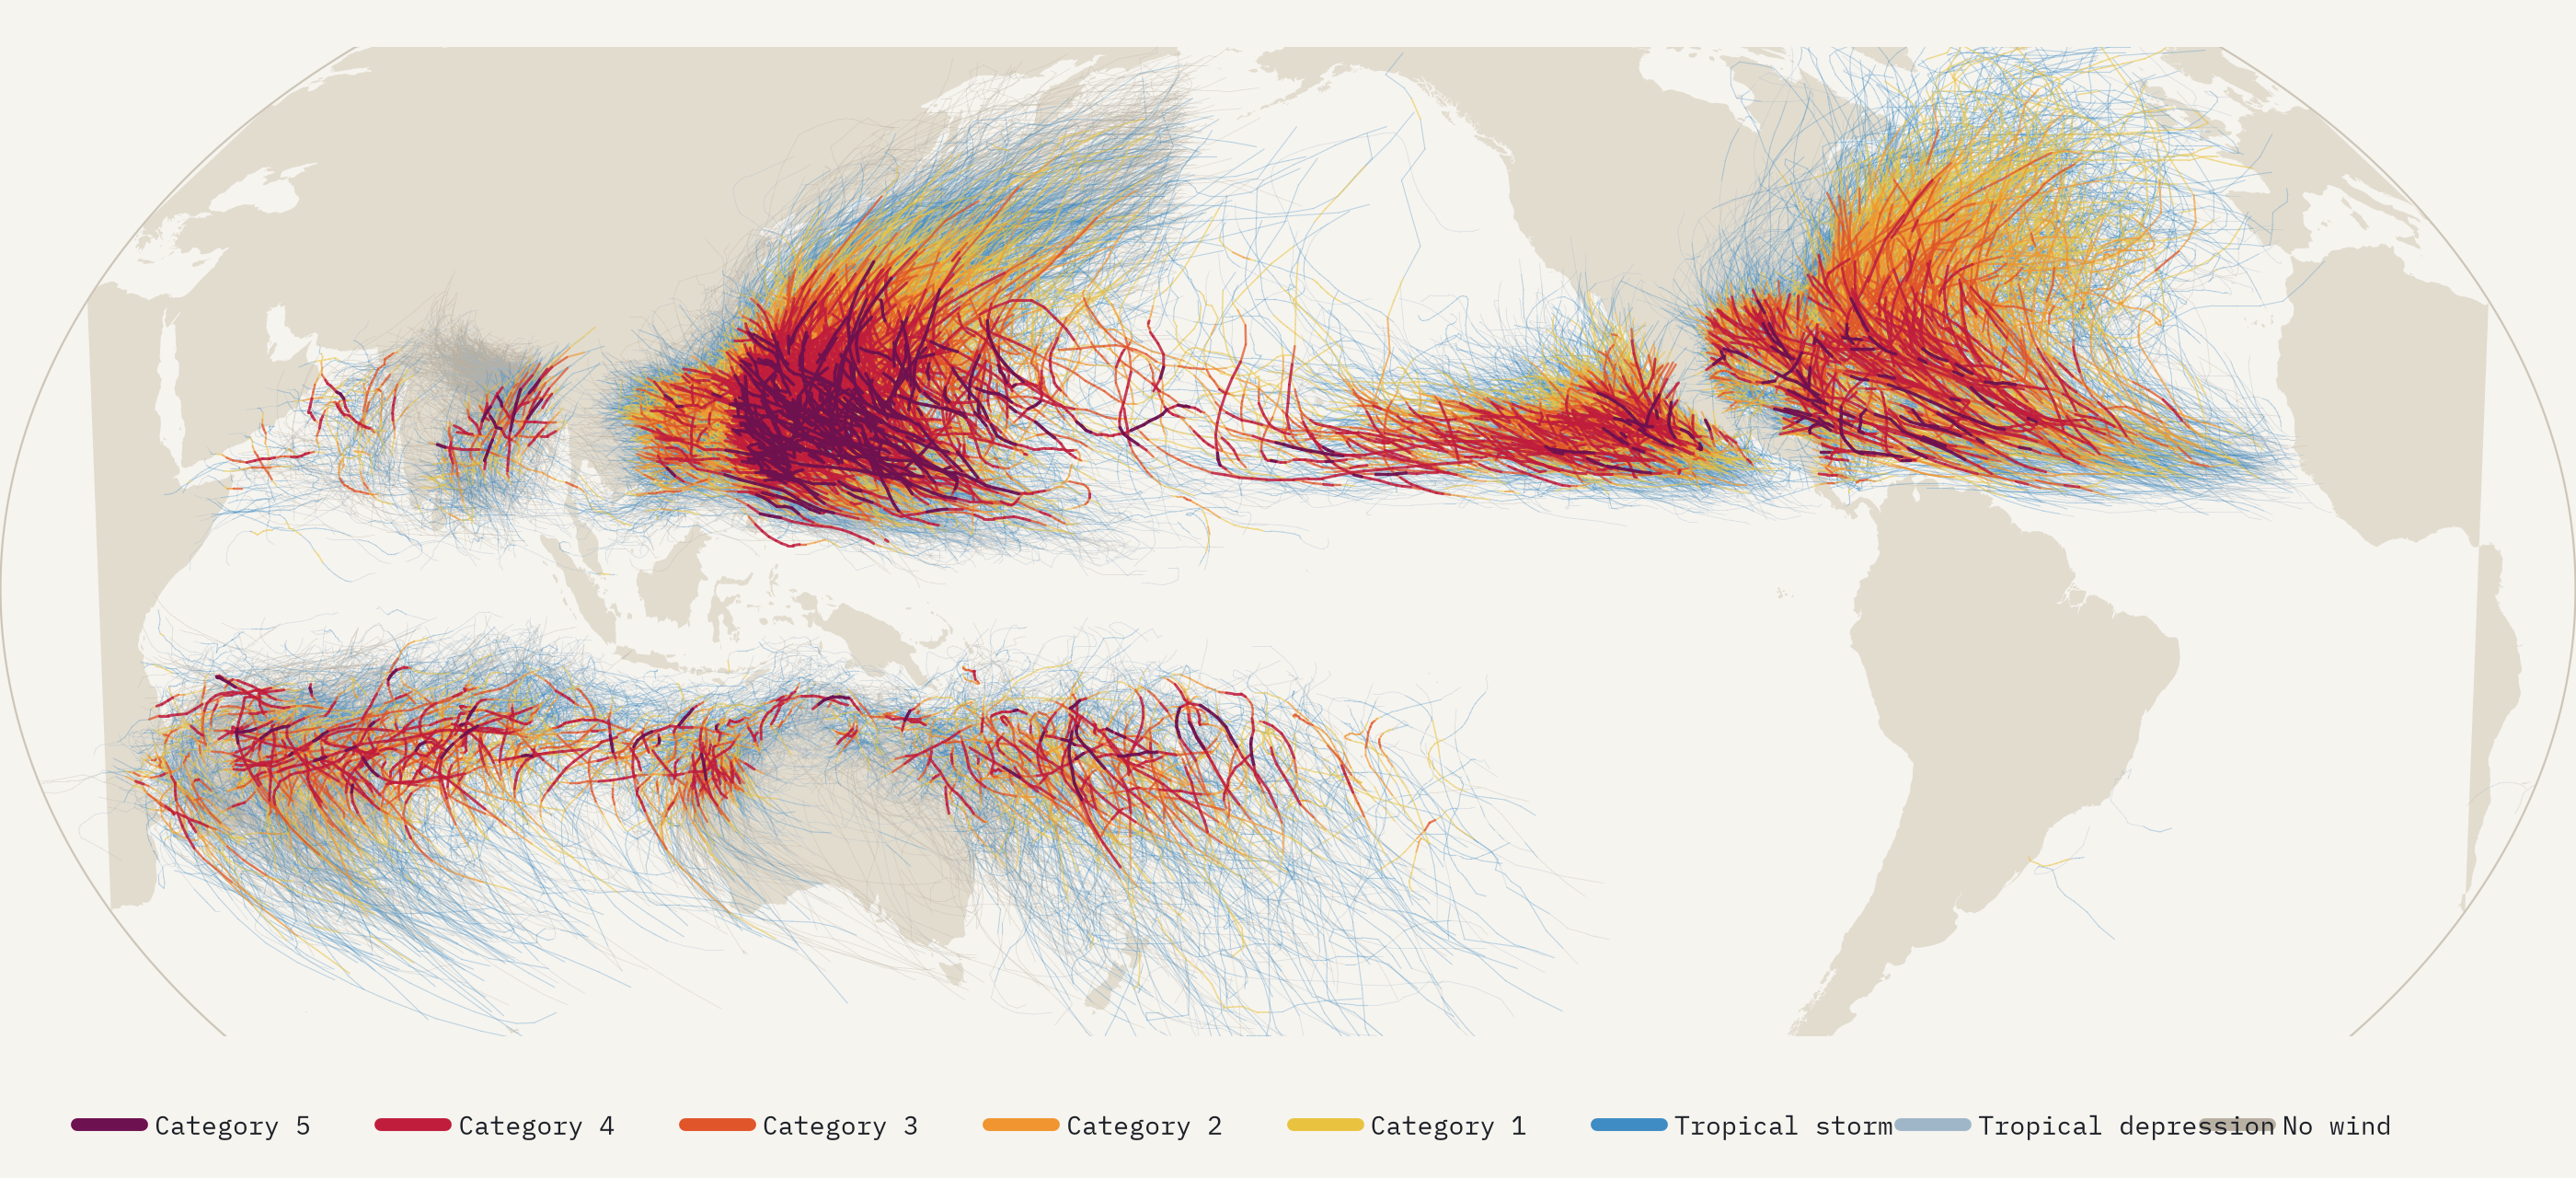
I drew every hurricane, typhoon and cyclone in NOAA’s global archive on one map, 13,186 storms since 1851, and asked three questions: where do they form, where do they hit, and are they getting stronger? The answers are clear for the first two. For the third, the honest answer depends on knowing what the old records missed.
Every few years a storm arrives that seems to break the scale, and the same question follows it: are hurricanes getting worse? It sounds like a question with a simple answer, because the storms have been tracked for so long. NOAA’s International Best Track Archive for Climate Stewardship, IBTrACS, gathers the tracks of every forecasting agency into one record: the position, wind and pressure of every tropical cyclone, every six hours, from the Atlantic hurricanes of the 1850s to this year’s typhoons. That is 352,746 positions. So I put them all on one map.
About 89 a year, and a record that used to miss them
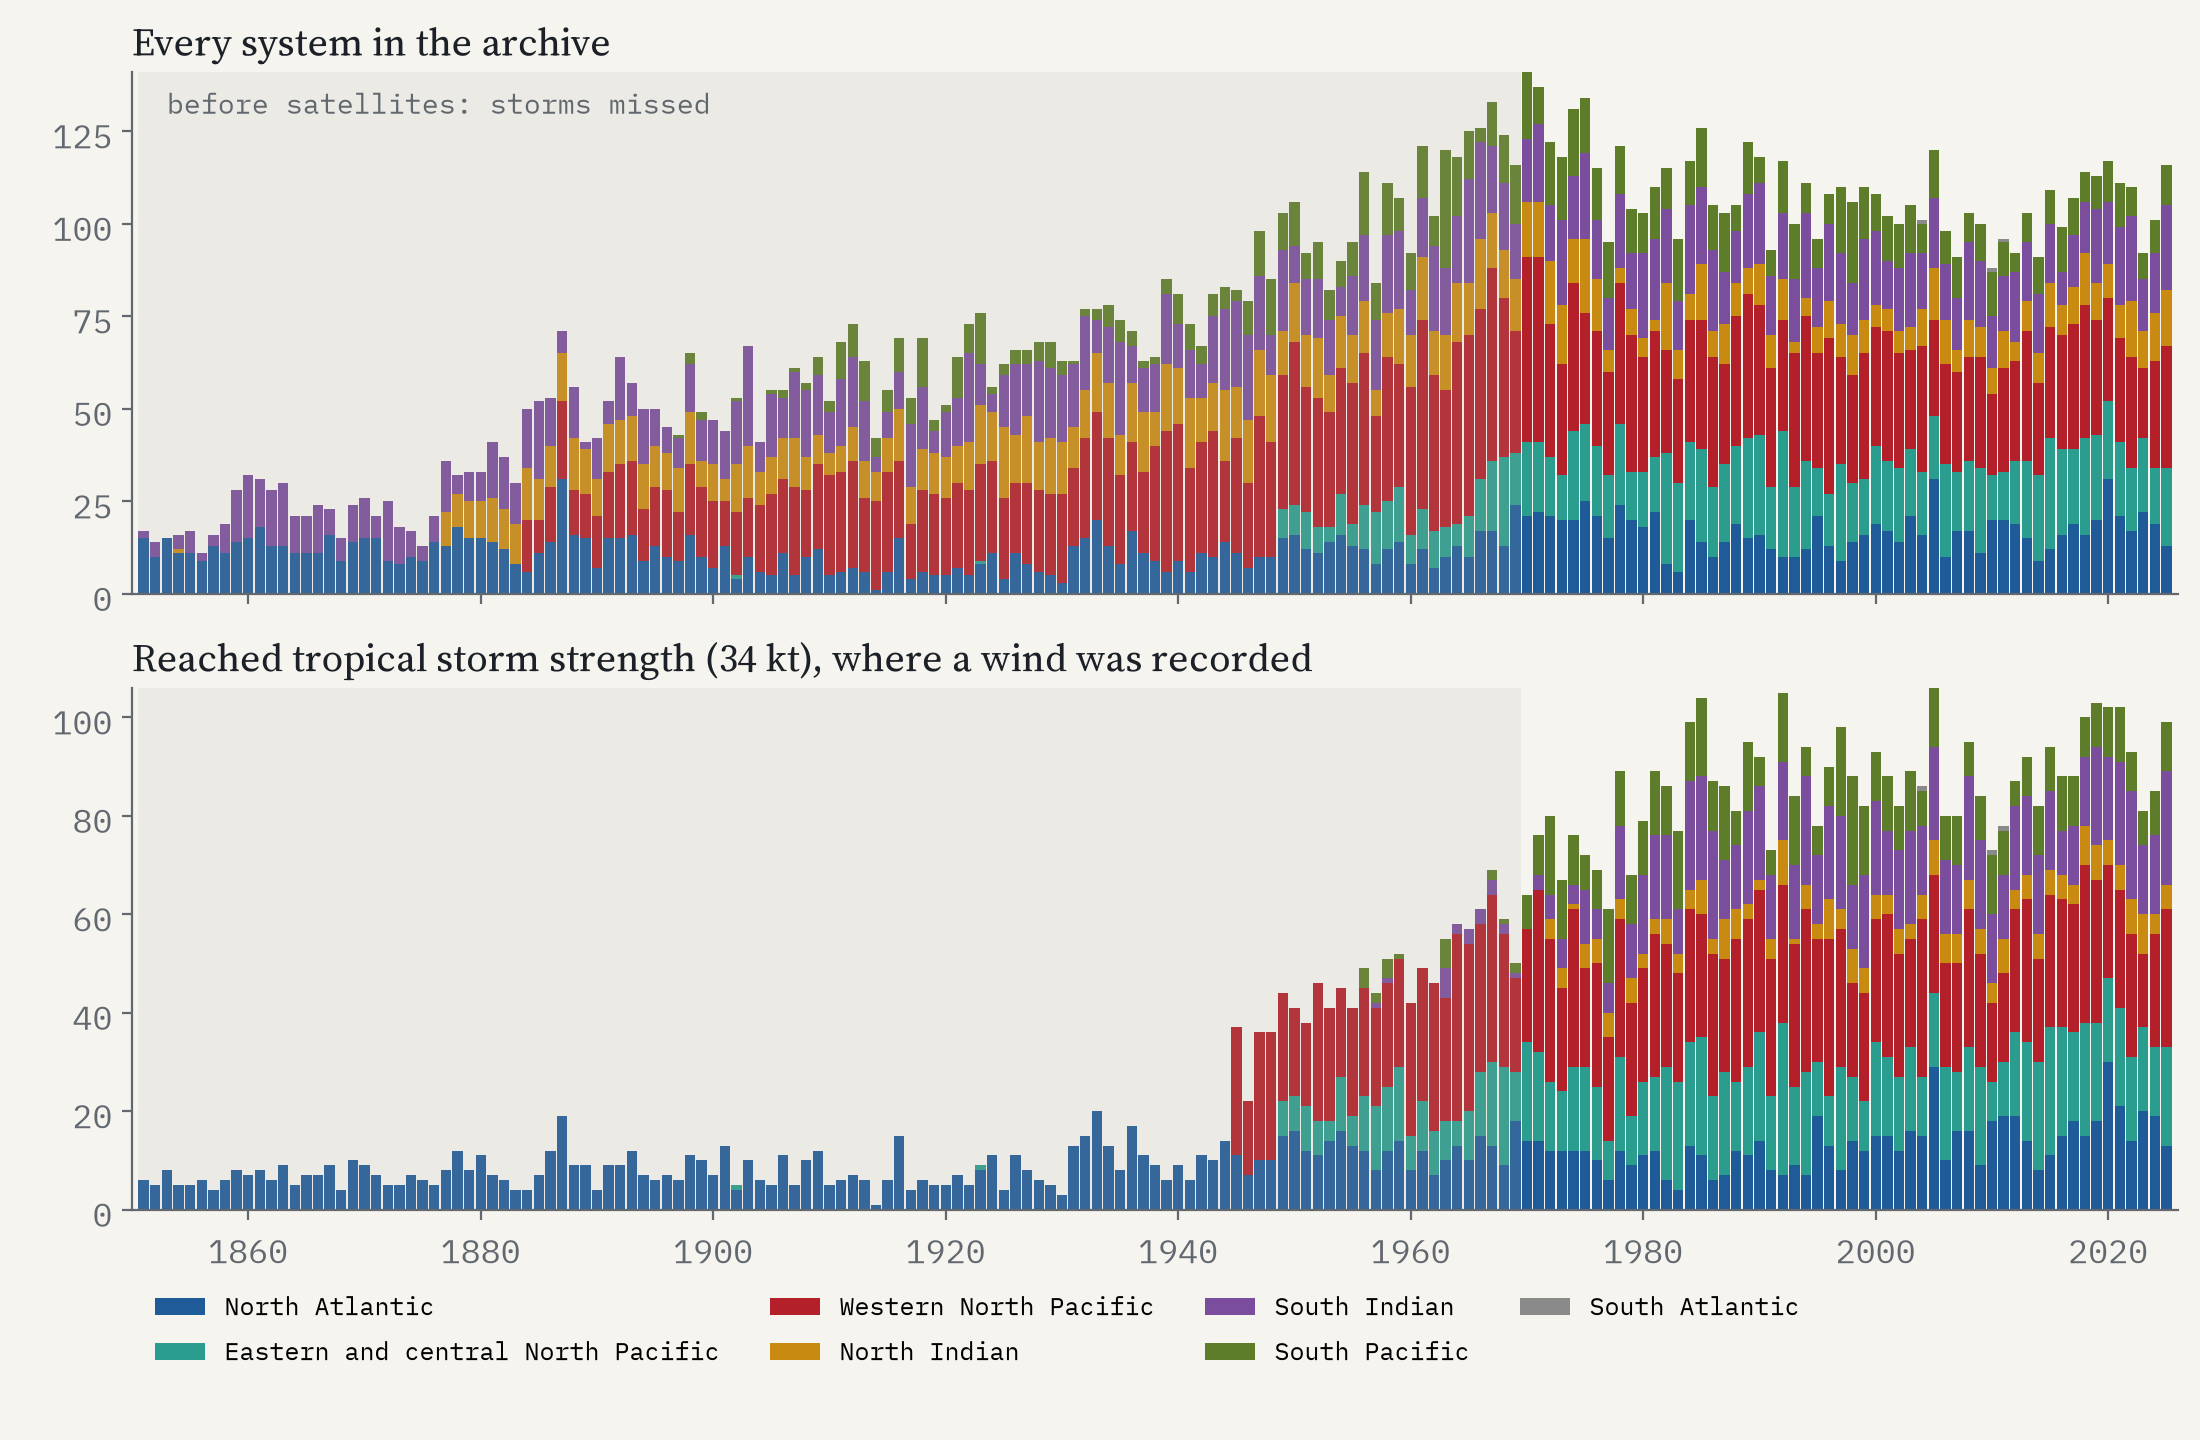
Since 1980, when satellites watched the whole tropics, about 89 storms a year have reached tropical storm strength and 47 have become hurricanes, typhoons or severe cyclones. The western Pacific, typhoon country, has 29% of them; the much-studied North Atlantic only 15%. Over those 46 seasons the number has not clearly changed.
Look further back and the storms seem to multiply, but that is mostly a story about seeing. Before satellites, a storm entered the record only if it hit land or a ship met it. In the North Atlantic, the one basin with winds back to 1851, the early record has 7.5 tropical storms a season against 13.3 in the last fifty years, and the missing ones are exactly the storms you would expect to miss: only 12% of the early storms never came within 500 km of land, against 23% now. Elsewhere the archive has tracks from the nineteenth century but no winds until the 1940s or later. So I only compare strength from 1980 on.
Where they form
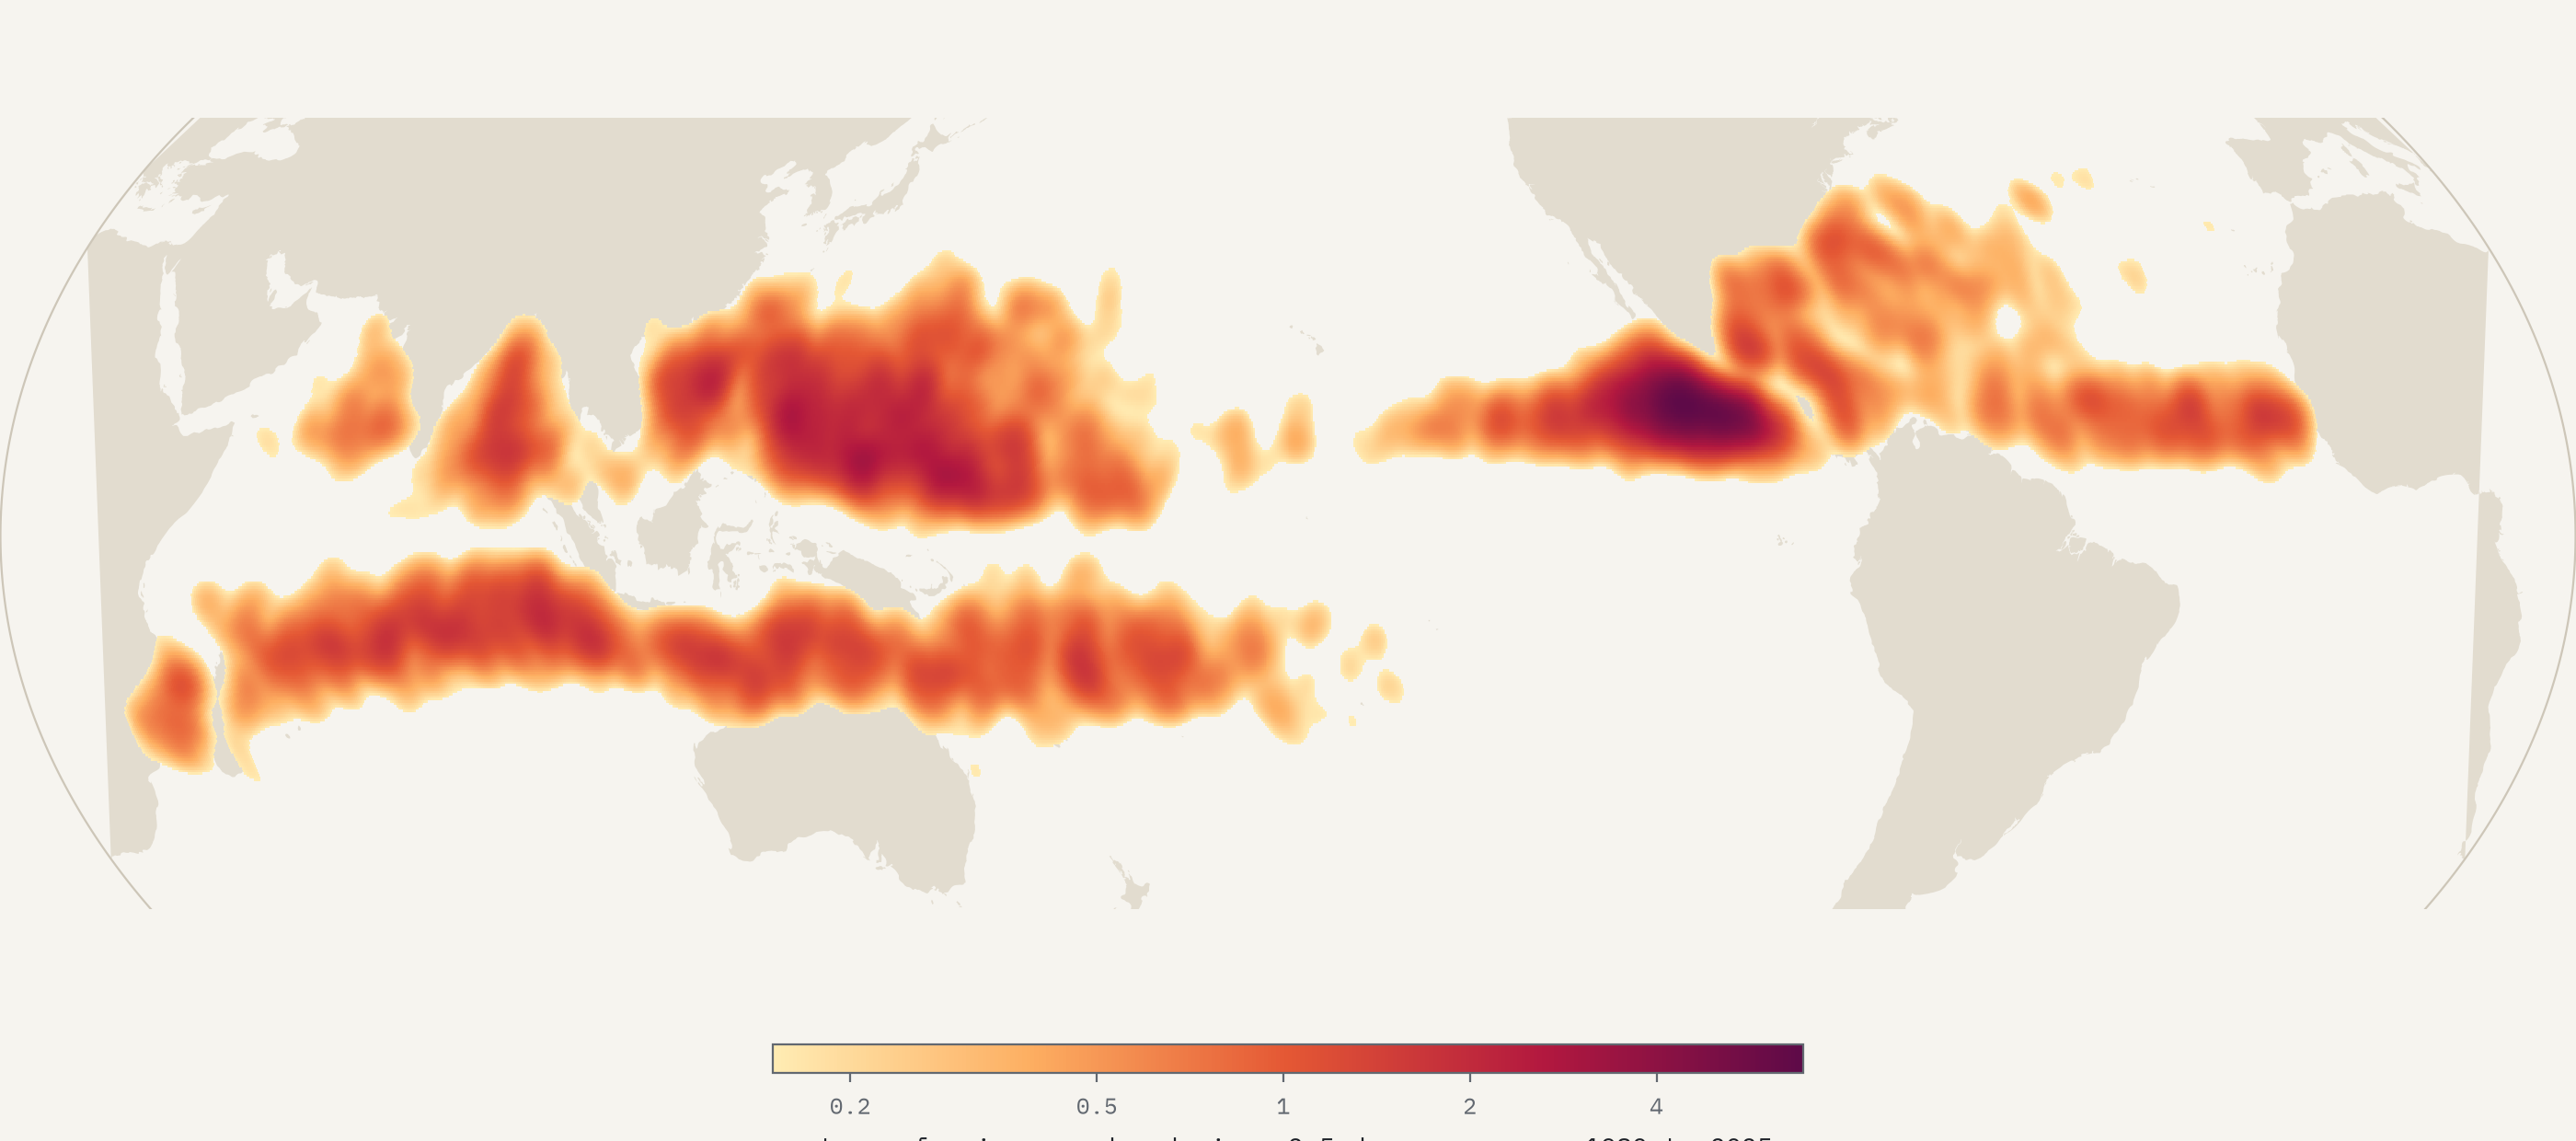
Storms are born in two belts over warm water, mostly between 5 and 20 degrees from the equator, and almost never on it: only 3.8% start within 5 degrees, where the Earth’s spin is too weak to wind them up. The busiest nursery on the planet is a patch of sea off southern Mexico, which spawns about 8 storms a decade in a single 2.5 degree square. The South Atlantic almost never makes one: 3 since 1980.
Where they hit
To count landfalls I traced every six-hourly segment of every track against the world’s coastlines. Since 1980, 40% of tropical storms have come ashore somewhere. China is hit most often, 263 storms in 46 seasons, and its southern coast, Guangdong, is the most-hit place on Earth with 118. But the Philippines takes the hardest blows: 129 storms reached it at typhoon strength and 67 at Category 3 or more, both the most of any country, because typhoons hit its eastern islands at their peak, straight off the open Pacific. The United States had 158.
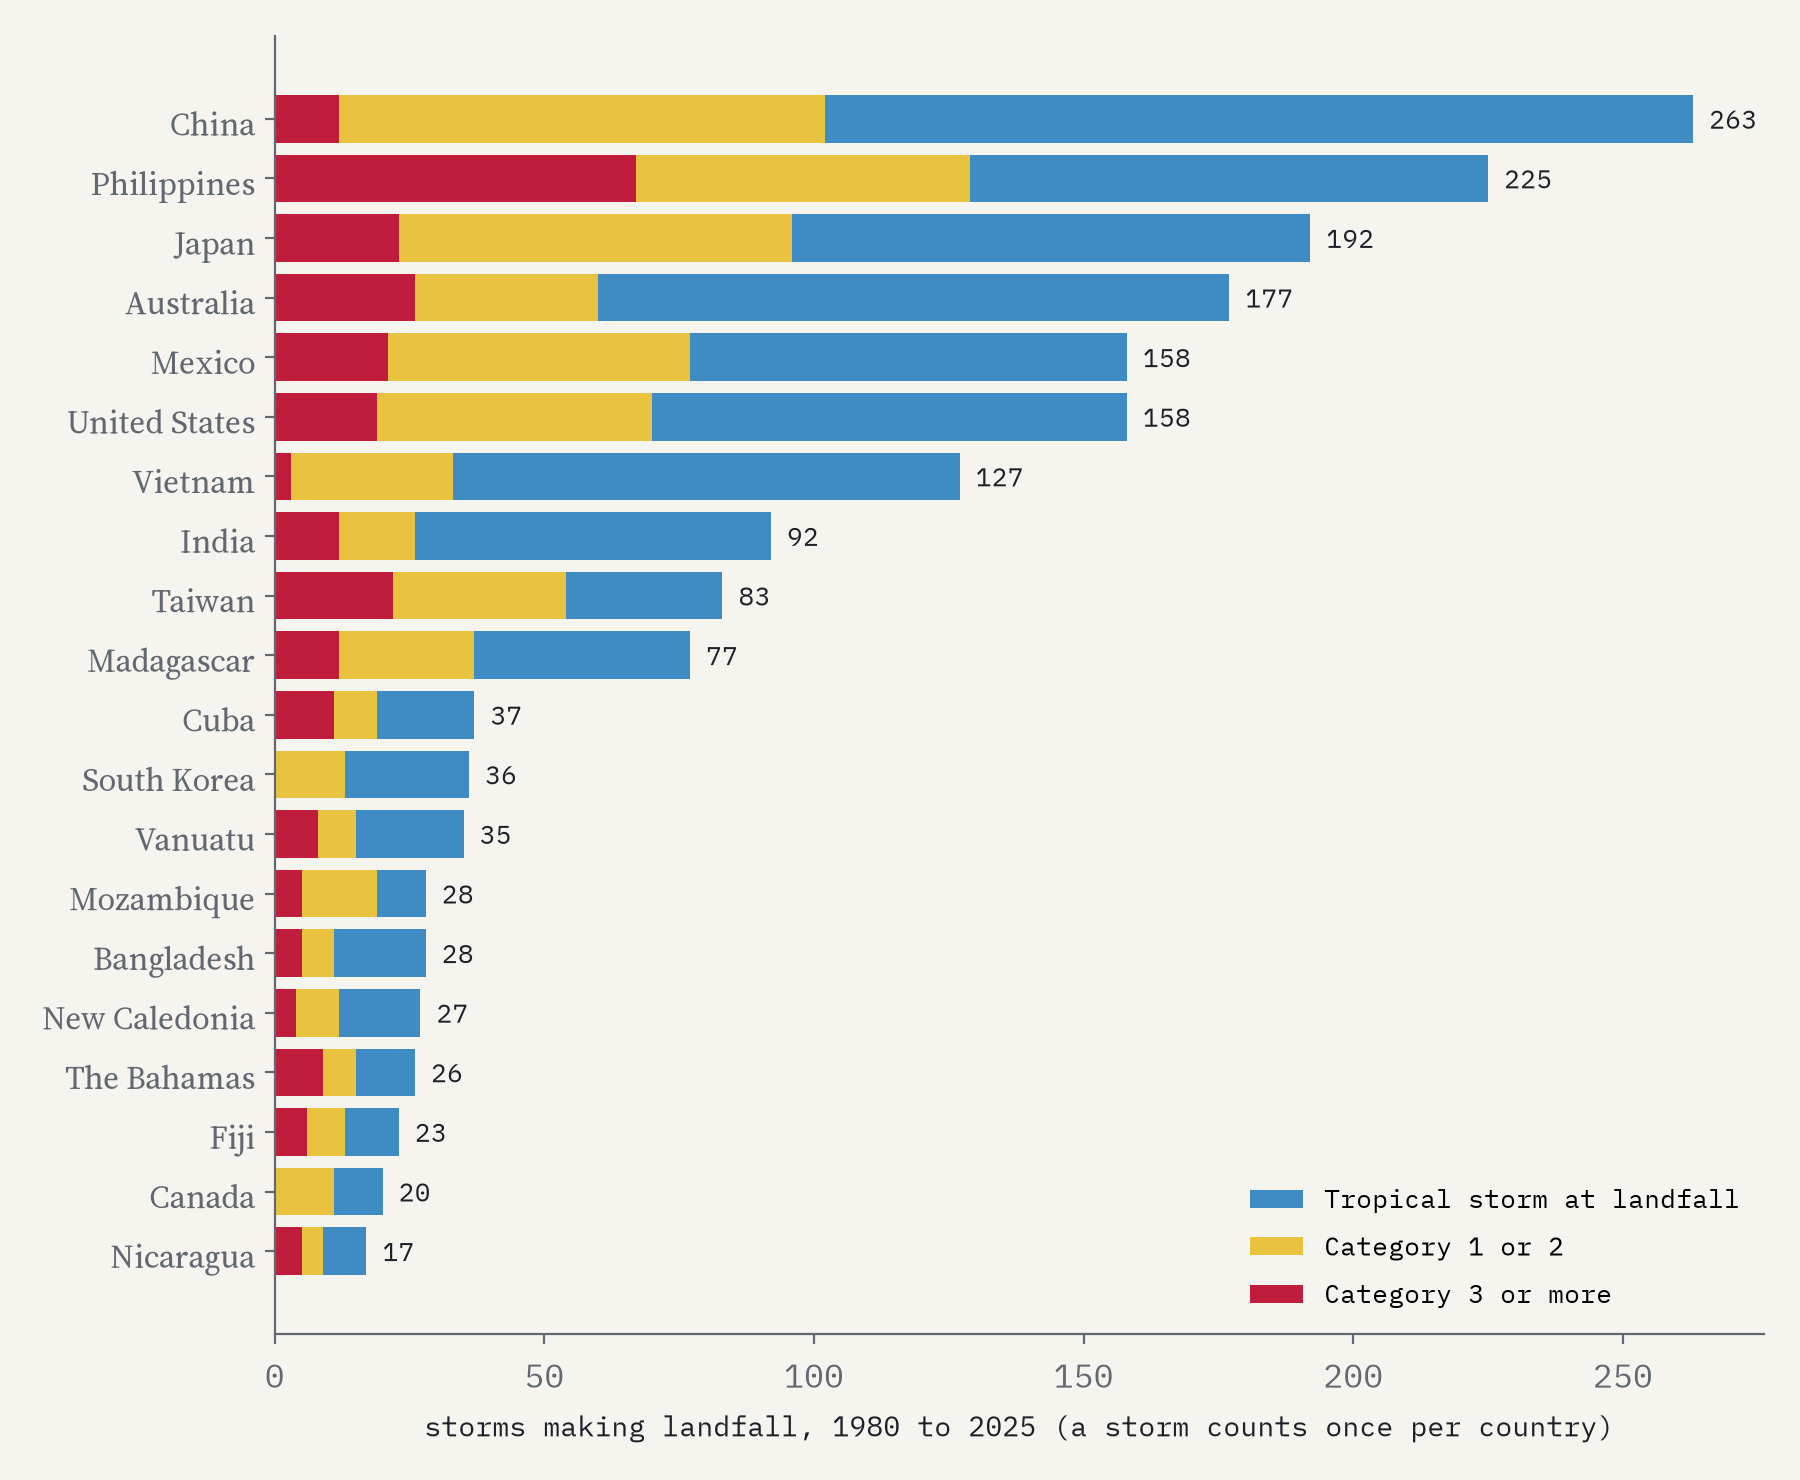
The number of storms has not changed since 1980. Where they peak, and how many reach the top of the scale, has.
Are they getting stronger?
If storms are getting stronger, more of them should reach the top of the scale. Using only the US agencies’ 1-minute winds, so that every storm is measured the same way, 12% of storms reached Category 4 or 5 in the 1980s, 21% in the 1990s, 20% in the 2000s and 23% in the 2010s. Split the satellite era in half and it is 16.8% against 21.2%, a difference chance would rarely produce. The clearest rises are in the South Pacific, the western Pacific and the South Indian Ocean; the North Atlantic shows no clear change.
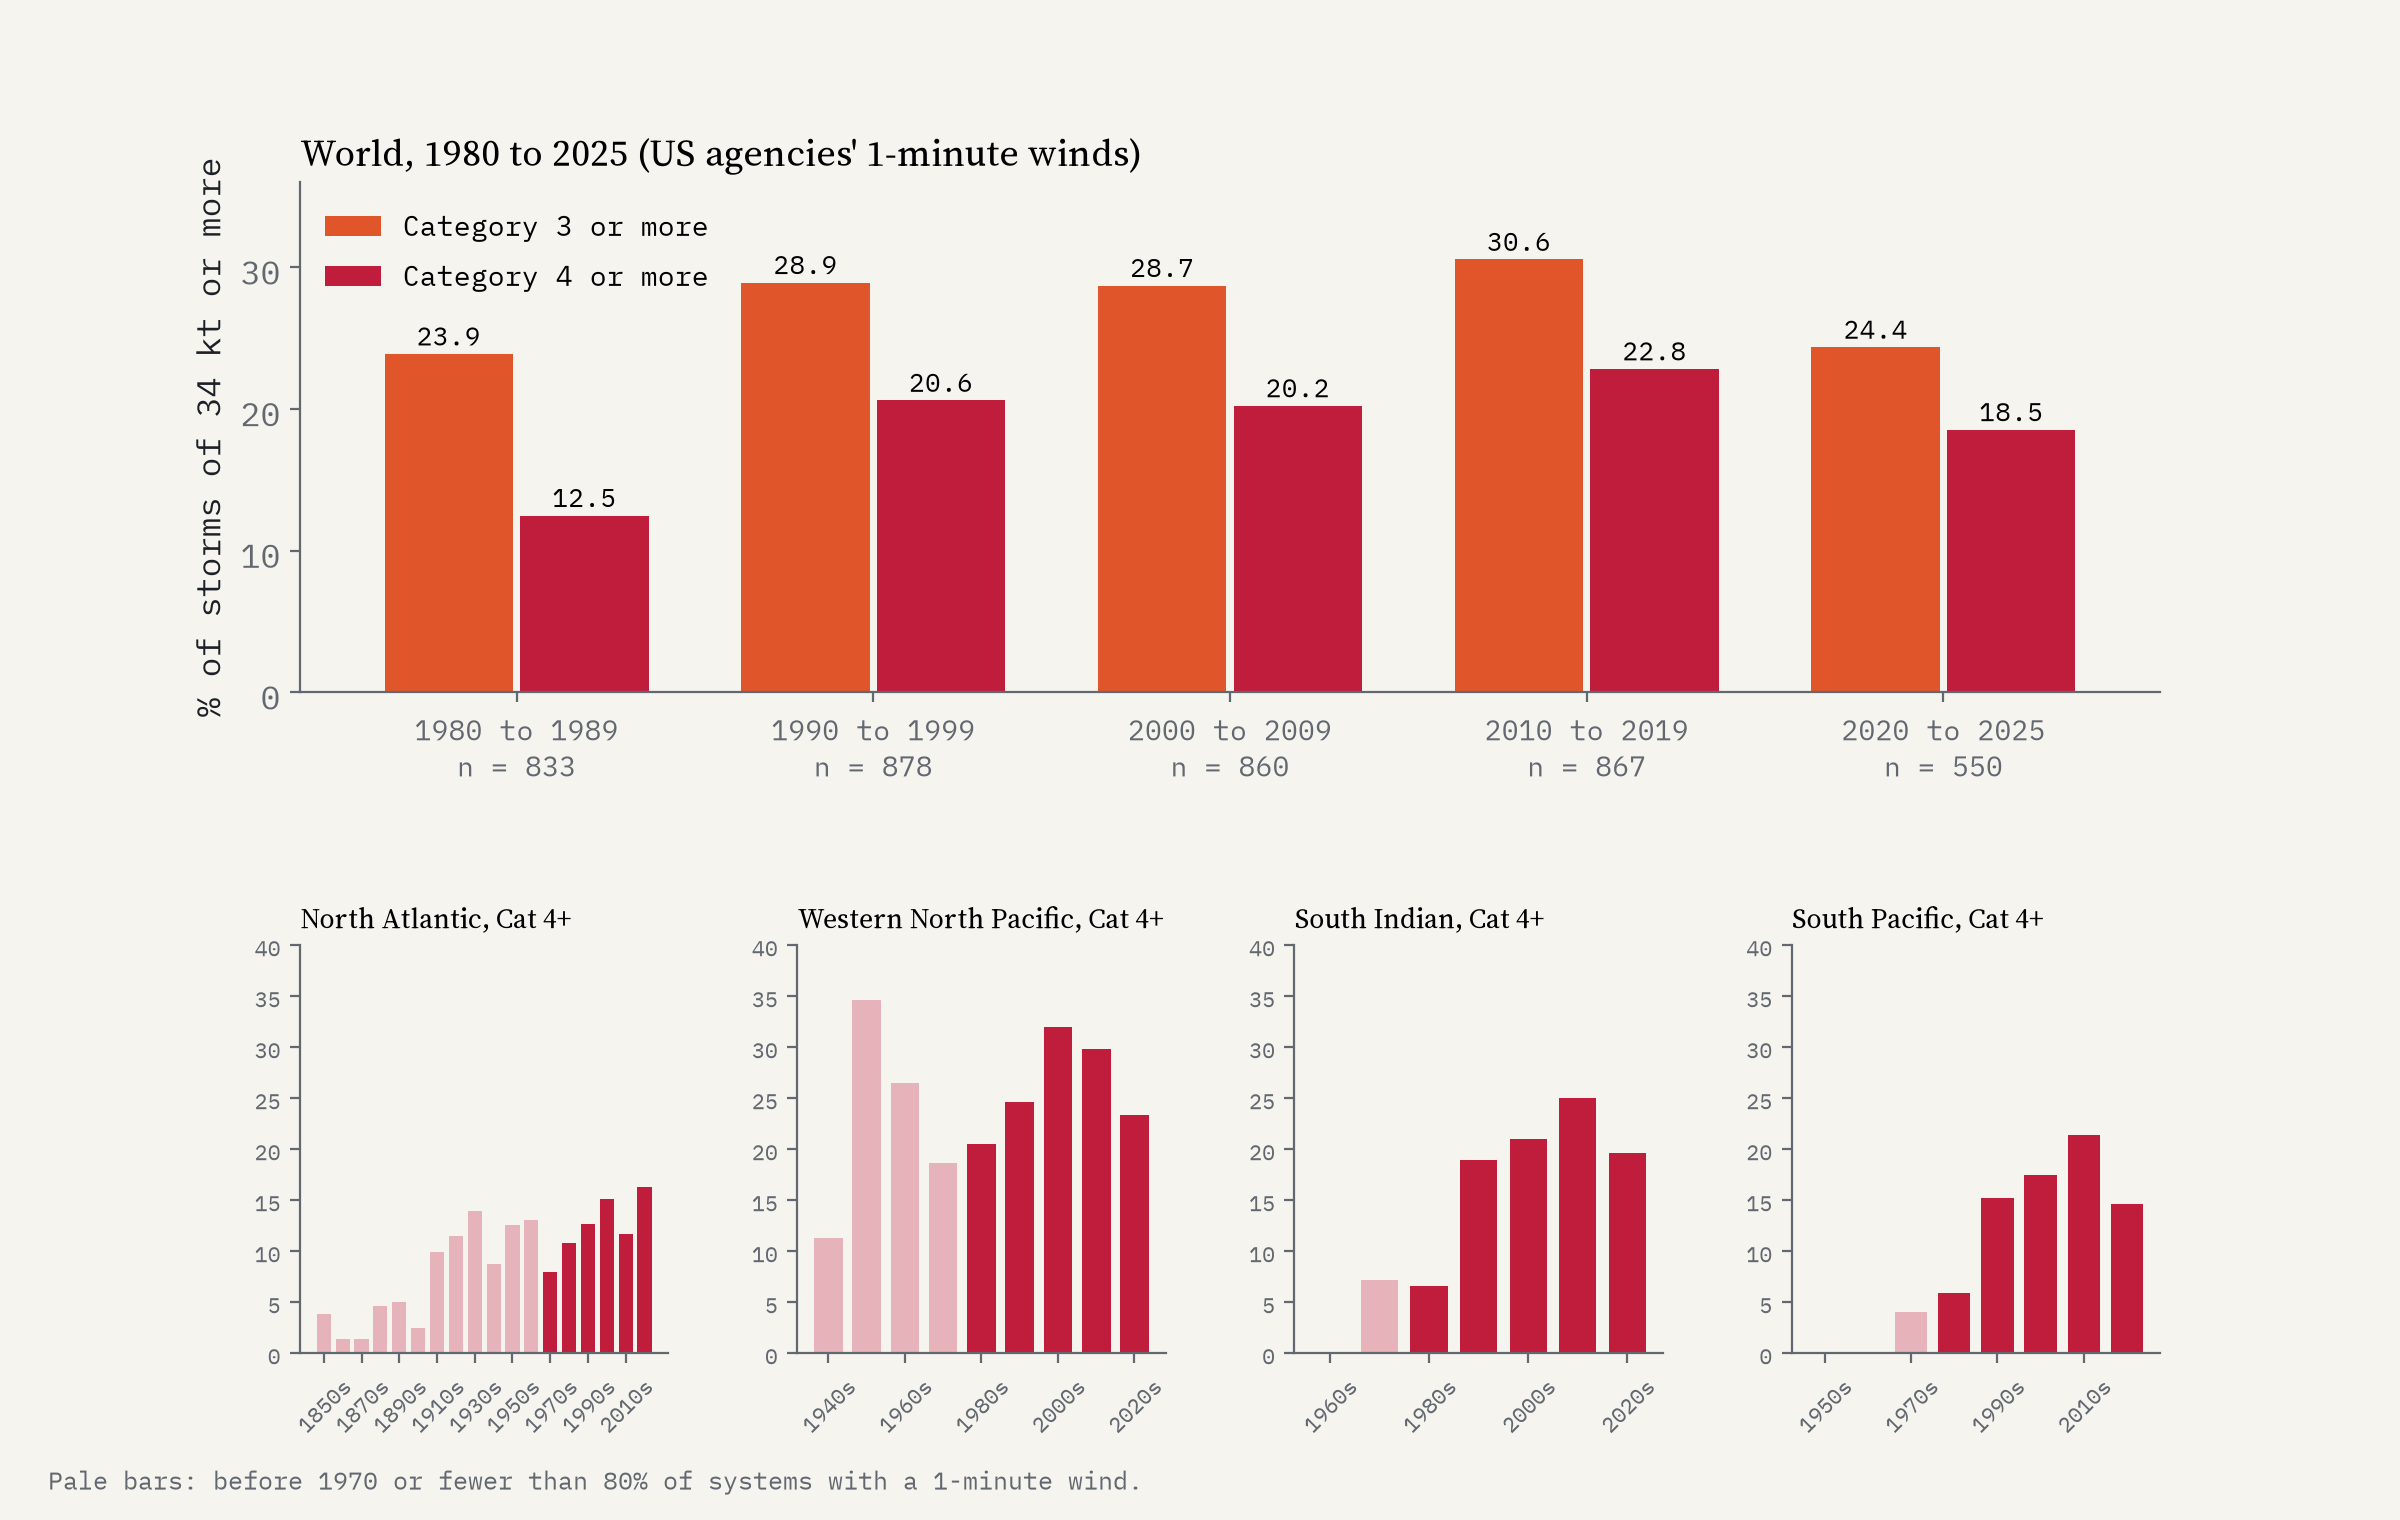
Now the caveats, which matter. Most of that rise happened between the 1980s and the 1990s, when satellite methods for estimating a storm’s strength were still maturing, so part of it may be better measurement rather than stronger storms. For Category 3 and above, the rise is too small to be sure of (26.7% against 28.4%). And the total energy of each season shows no trend at all. Wikipedia, summarising a 2020 study by Kossin and colleagues, reports a global increase in the proportion of major storms from 1979 to 2017; the raw record agrees in direction, clearly for Category 4 and 5, less clearly below that. It does not say there are more storms.
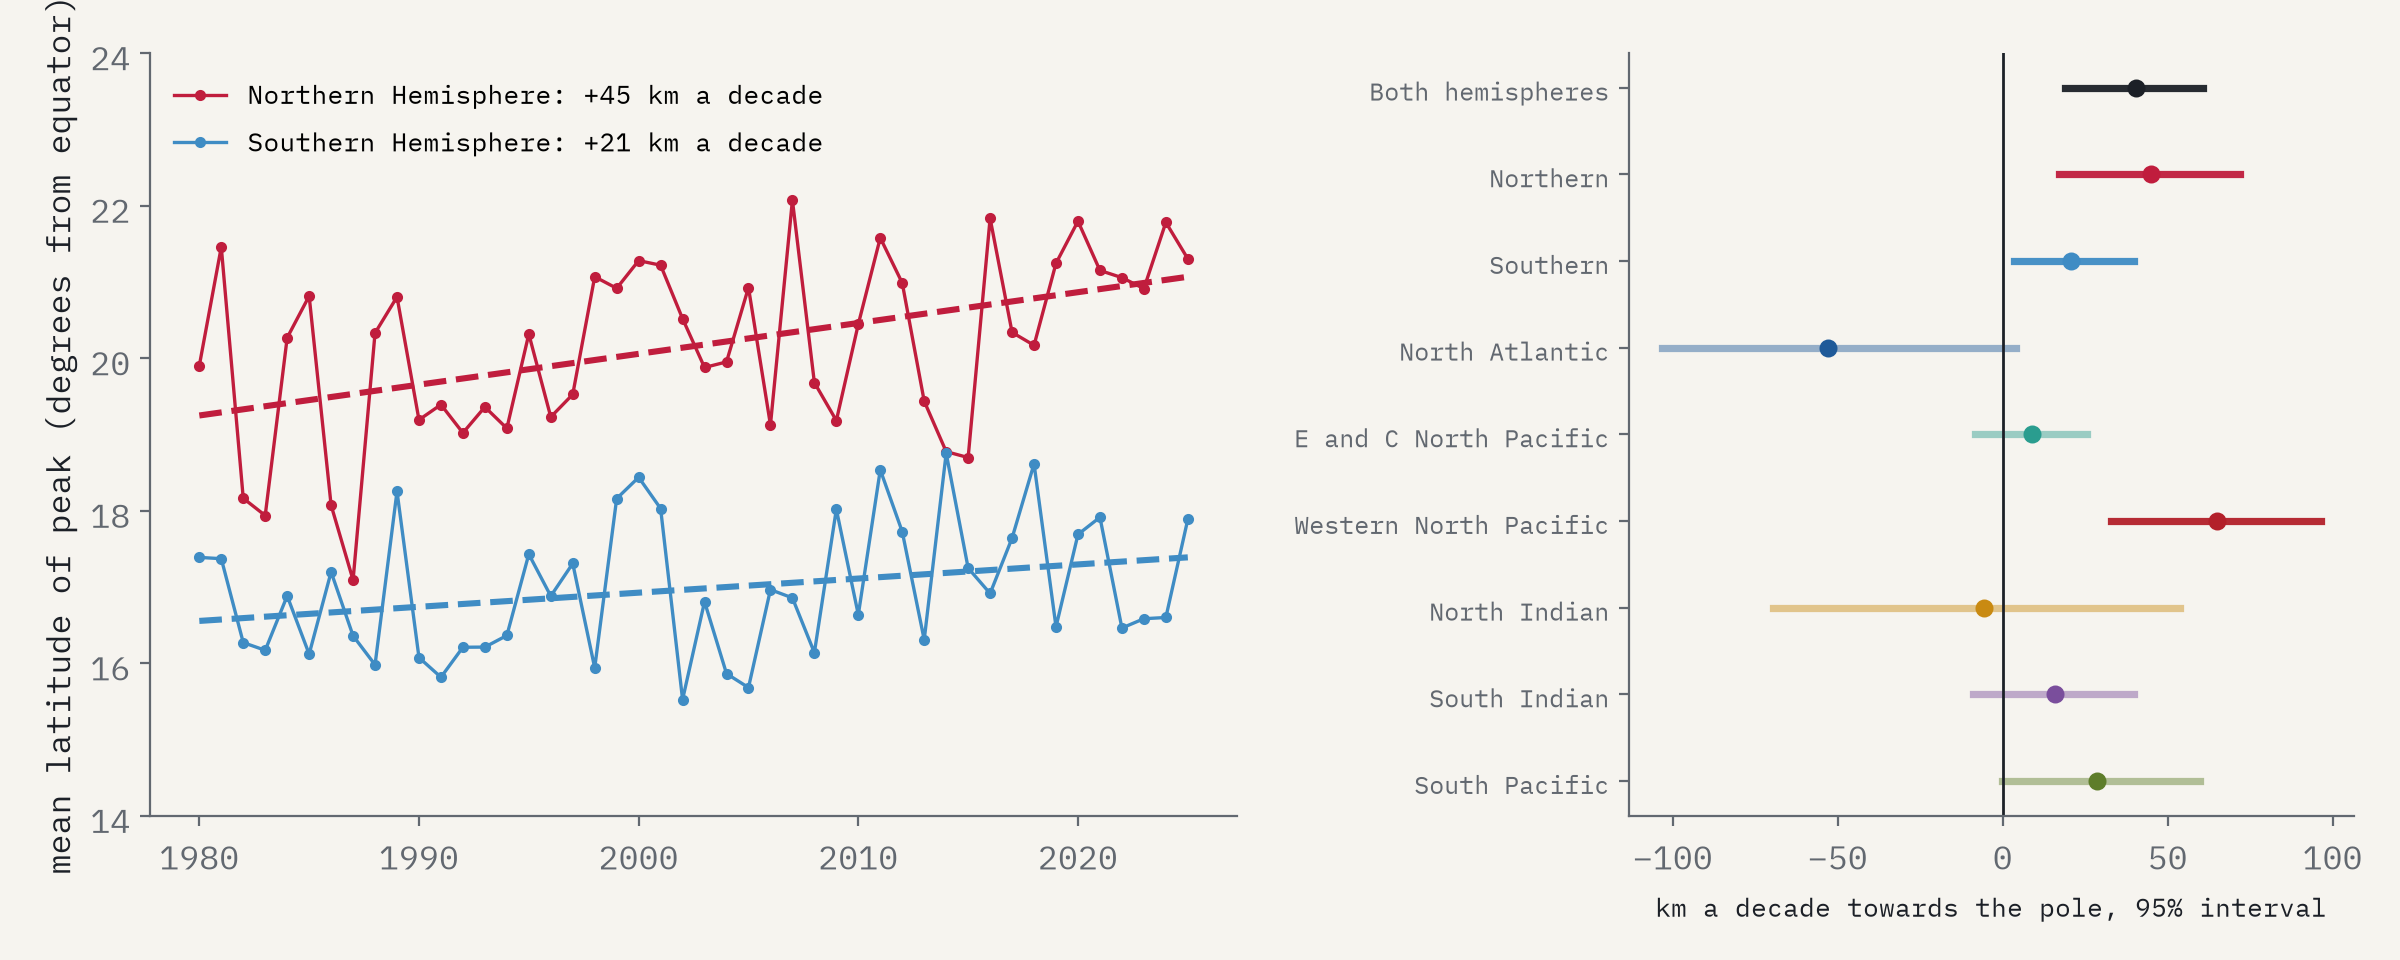
The other change is where storms peak. In the Northern Hemisphere the average latitude of each storm’s strongest moment has moved 45 km a decade towards the pole since 1980, in the Southern Hemisphere about 21 km. Almost all of it is the western Pacific, where typhoons now peak closer to Japan, Korea and China; Atlantic hurricanes, if anything, have moved the other way.
How I did this
I used IBTrACS version 4 (revision v04r01), all basins, at six-hourly positions, keeping one track per storm. Strength is the 1-minute wind of the US agencies, which the Saffir-Simpson scale is defined on; where it is missing the map uses the regional agency’s wind. Landfalls come from intersecting every track segment with Natural Earth’s coastlines, with winds interpolated between positions, so a storm that peaks right at the coast can read a category low. Trends use 1980 to 2025, with bootstrap intervals. None of this separates natural cycles such as El Niño from long-term change, and none of it attributes anything to climate change. The interactive map lets you play every season since 1851, filter by basin and strength, and click any track for its name, peak wind and the countries it hit.
Notes and sources
- Knapp, K. R., Kruk, M. C., Levinson, D. H., Diamond, H. J. and Neumann, C. J. (2010) The International Best Track Archive for Climate Stewardship (IBTrACS): unifying tropical cyclone best track data. Bulletin of the American Meteorological Society 91, 363 to 376. Data: IBTrACS v04r01, NOAA National Centers for Environmental Information (Gahtan et al. 2024). NOAA data, no copyright restrictions.
- Wikipedia contributors, Tropical cyclone and Saffir-Simpson scale (CC BY-SA 4.0), for the scale and background, including Kossin, Knapp, Olander and Velden (2020) and Kossin, Emanuel and Vecchi (2014).
- Natural Earth coastlines, countries and provinces (public domain). Base map tiles on the interactive page © Esri.
- I wrote the text, with drafting and editing assistance from Claude (Anthropic), which also helped prepare the analysis code. I reviewed and checked all text and results.

