
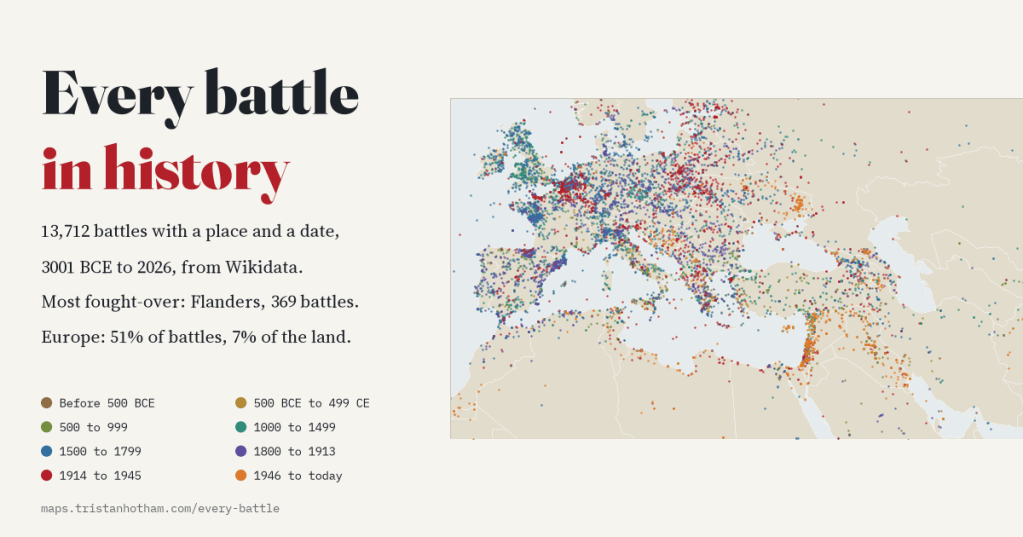
Wikidata knows of 20,202 battles. I mapped the 13,712 that have both a place and a date, from a legendary clash in 3001 BCE to the fighting of 2026, to see where war happened century by century, which places have been fought over again and again, and how much the famous “every battle in history” map is really a map of who wrote things down.
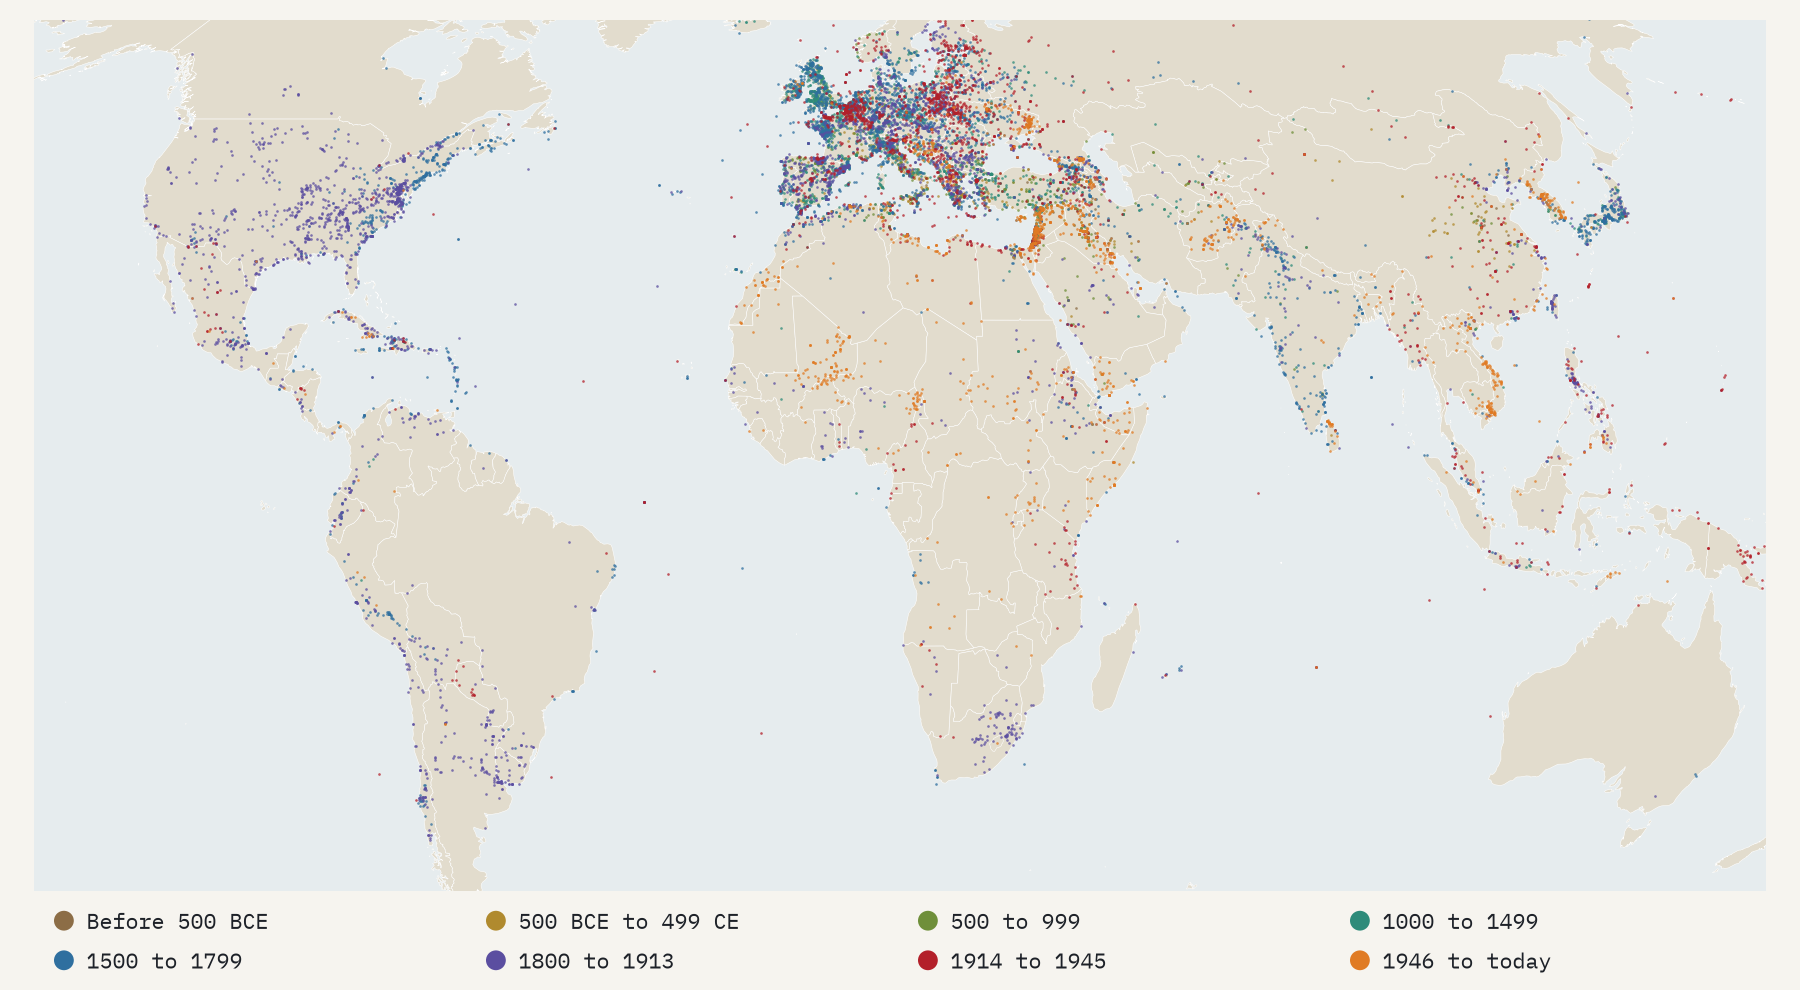
You have probably seen the map. Someone downloads every battle from Wikidata, plots them as glowing dots, and posts it: Europe ablaze, the Mediterranean outlined in fire, the eastern United States lit up by the Civil War, and great stretches of Africa and Asia oddly quiet. It is a beautiful image, and it is almost never dated, explained or questioned. So I made it again, properly, and then asked what it can and cannot tell us.
The raw material is every Wikidata item that is an instance of “battle” or one of its many subclasses: 20,202 items. 14,768 have coordinates, 15,874 have a date, and 13,712 have both. Those are the dots.
Five thousand years, mostly the last five hundred
The record goes back a long way. The oldest item, the Battle of Banquan, a battle of Chinese legend, is placed in 3001 BCE, and 672 battles are dated before 1 CE. But almost all of the record is recent: 77% of dated battles happened after 1500 and 52% after 1800. The 19th century has the most, 3,714, just ahead of the 20th with 3,630. The single busiest year is 1944, with 319 battles.
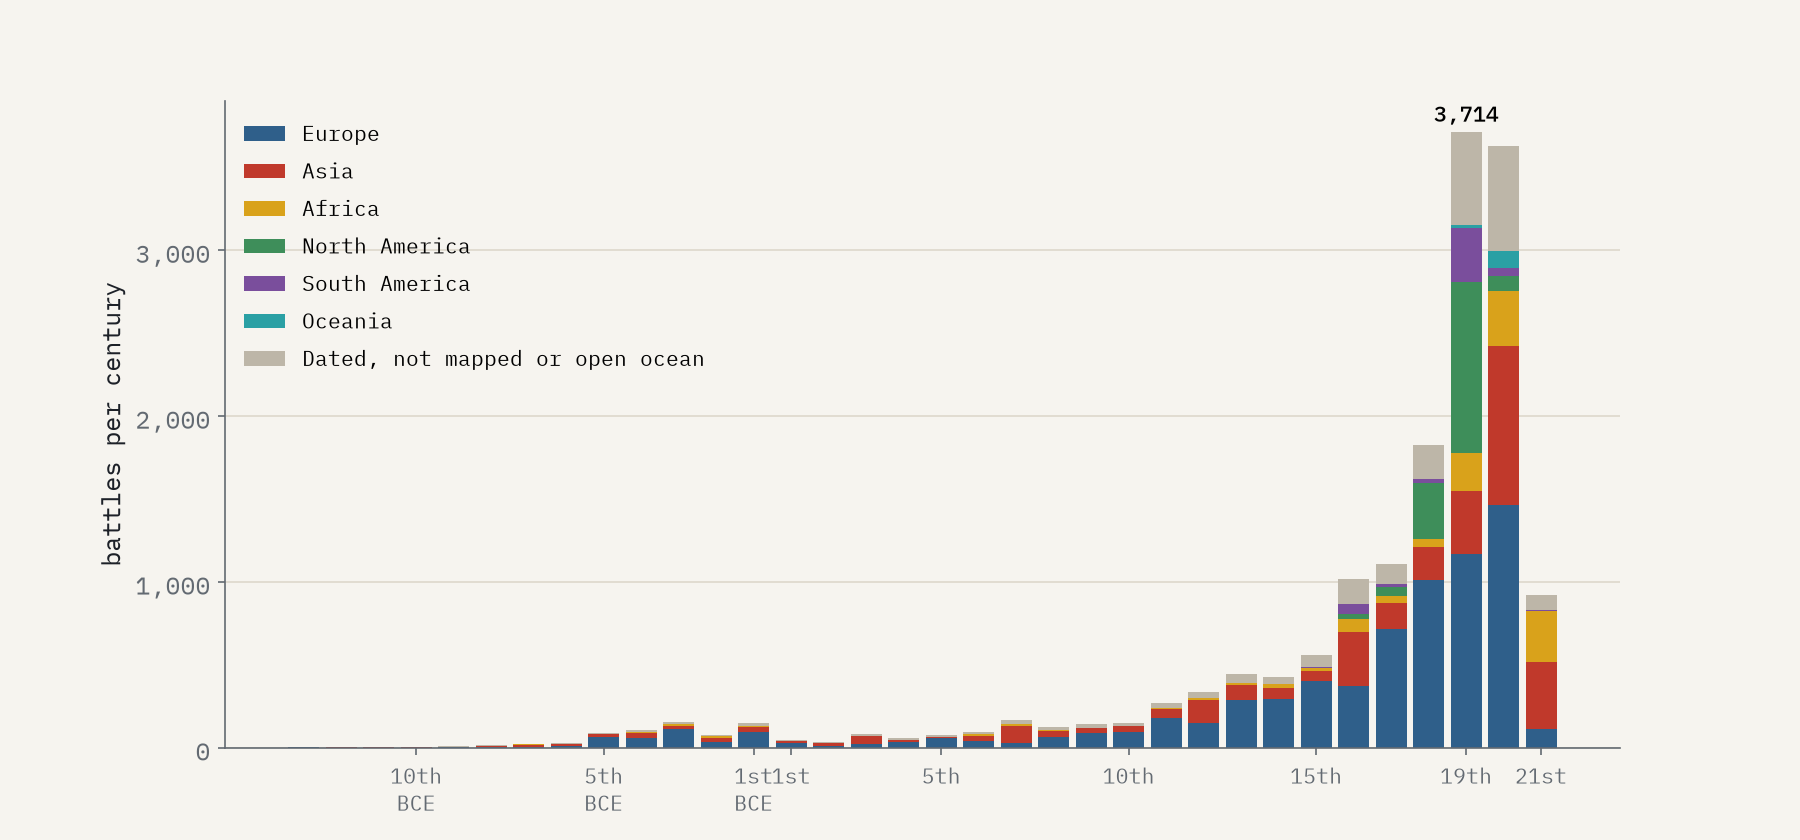
Counted per year, the 21st century is as busy as the 19th: 35.4 battles a year since 2001, against 37.1 in the 19th century. That does not mean the world is as warlike as it was in the age of Napoleon. It means that today’s wars, in Syria, Iraq, the Sahel and Ukraine, are written up on Wikipedia battle by battle, as they happen.
The centre of war
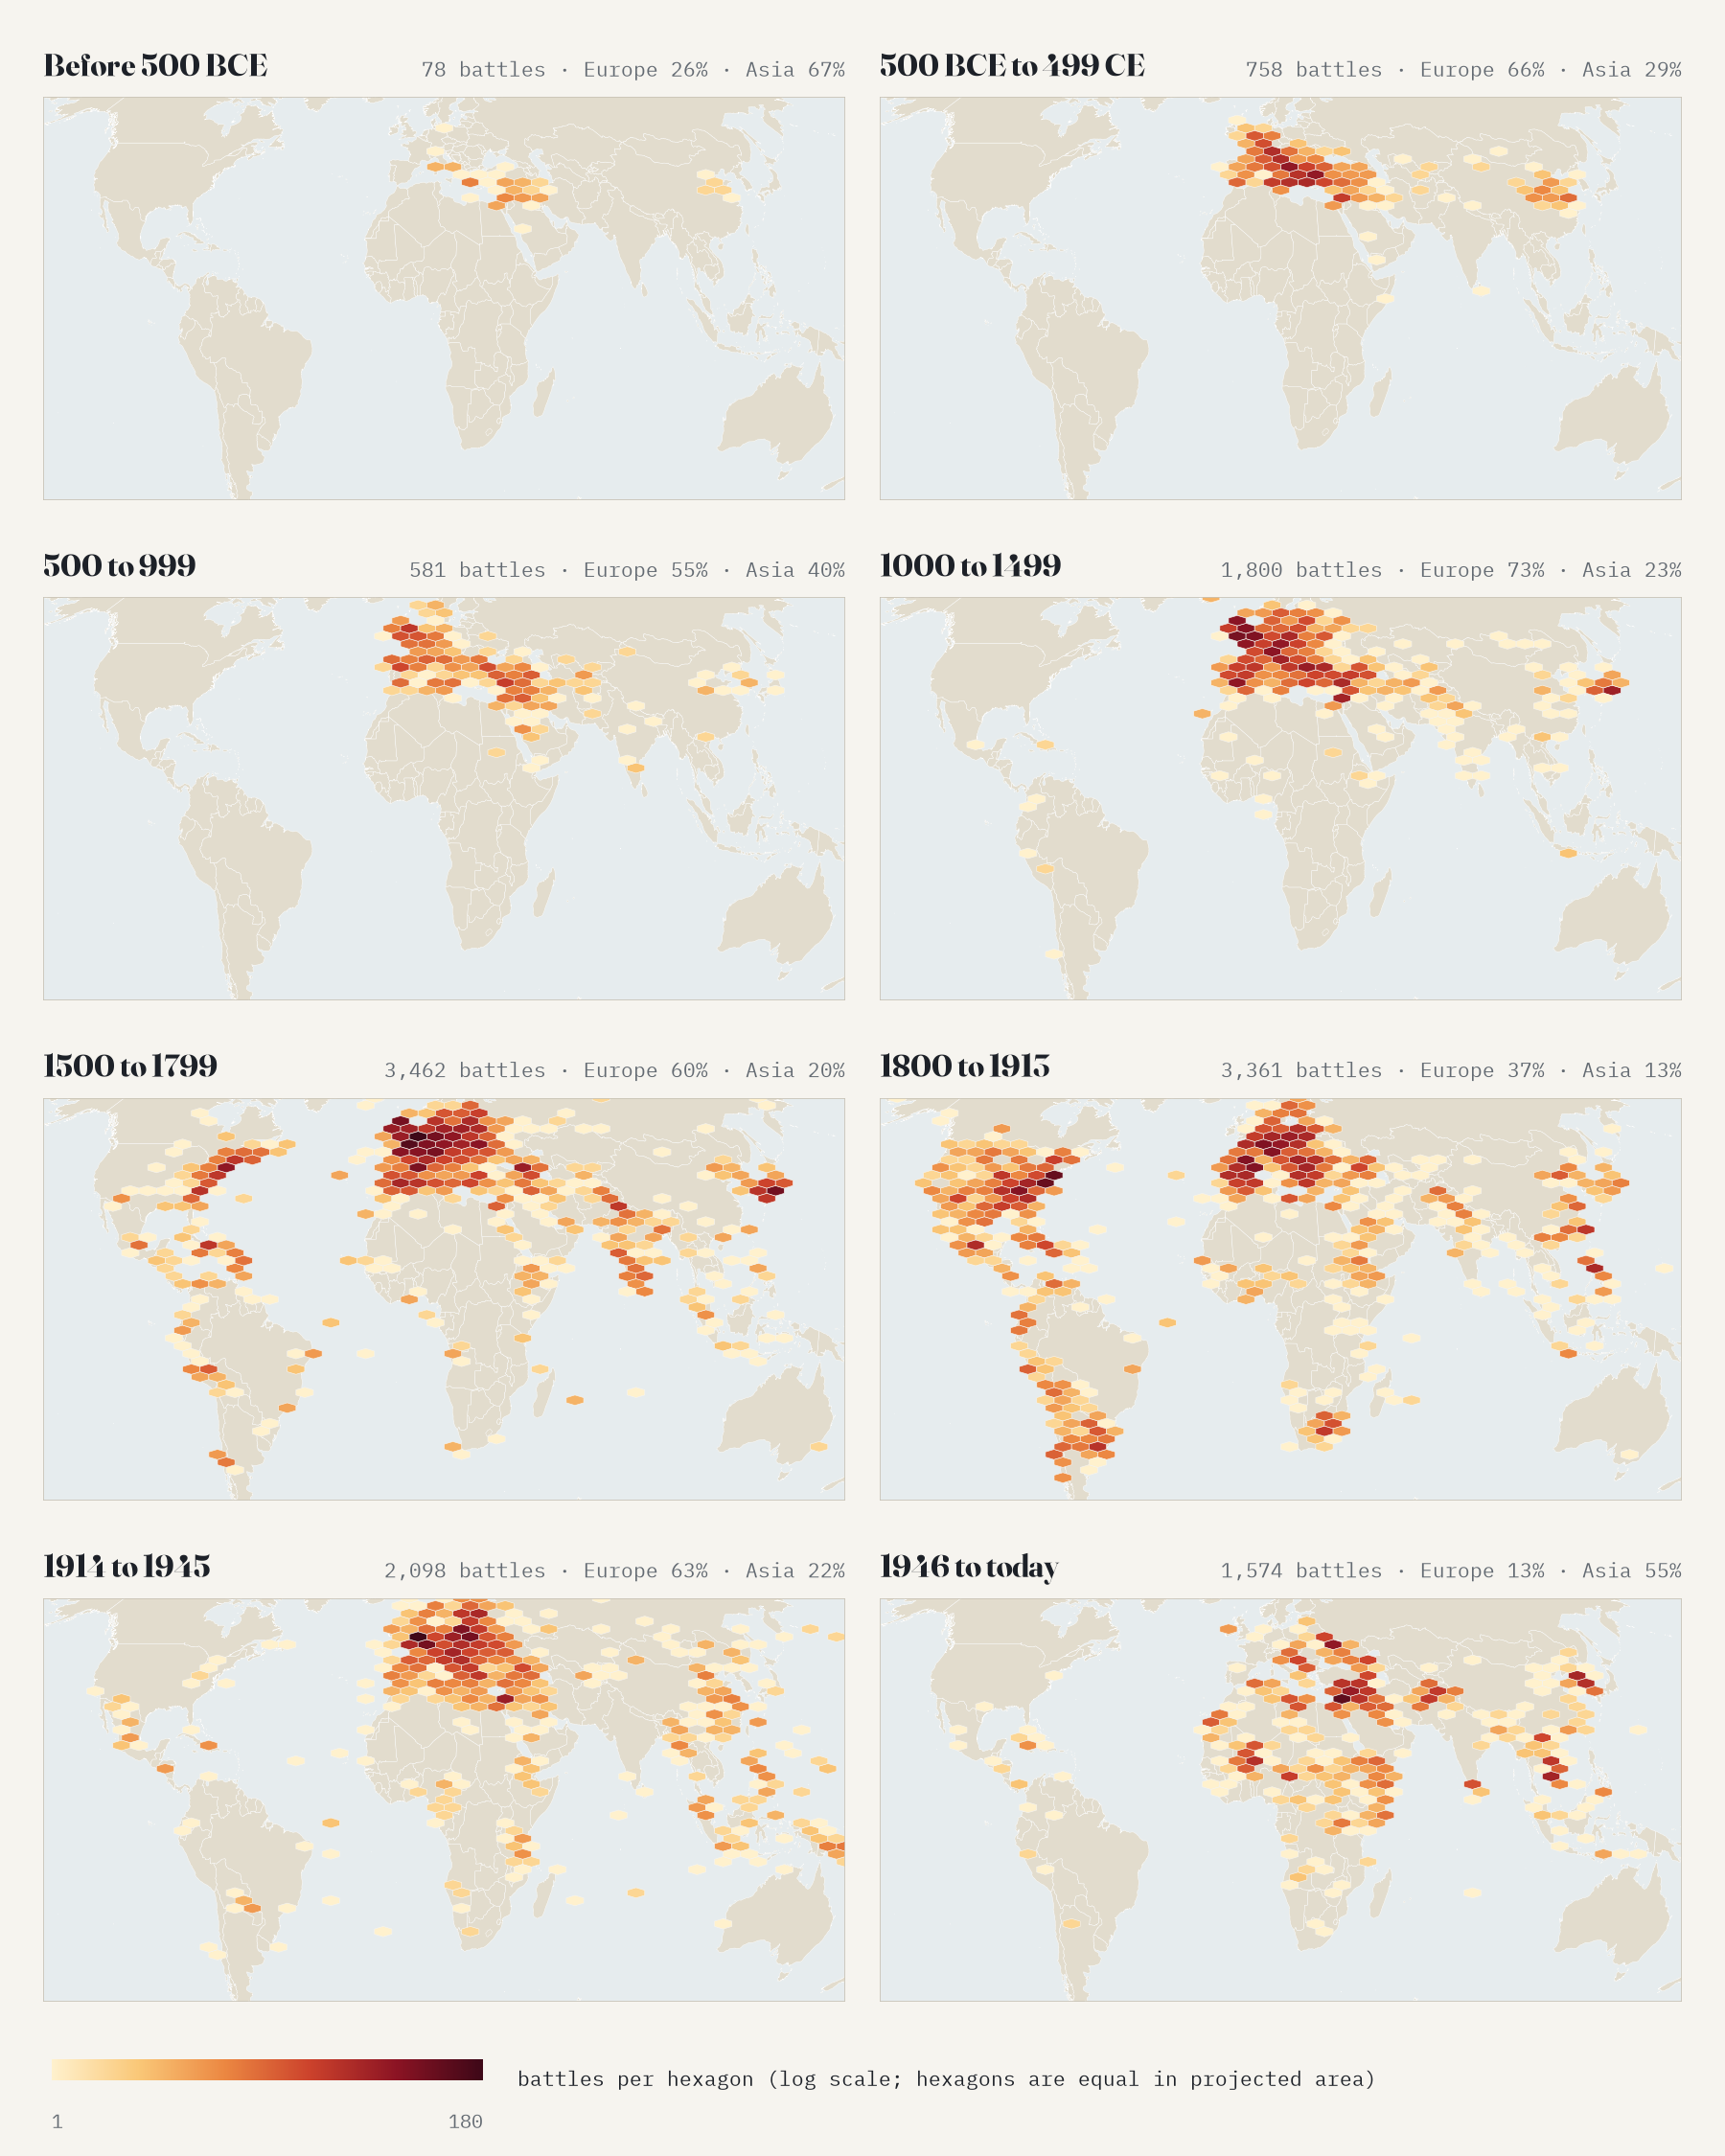
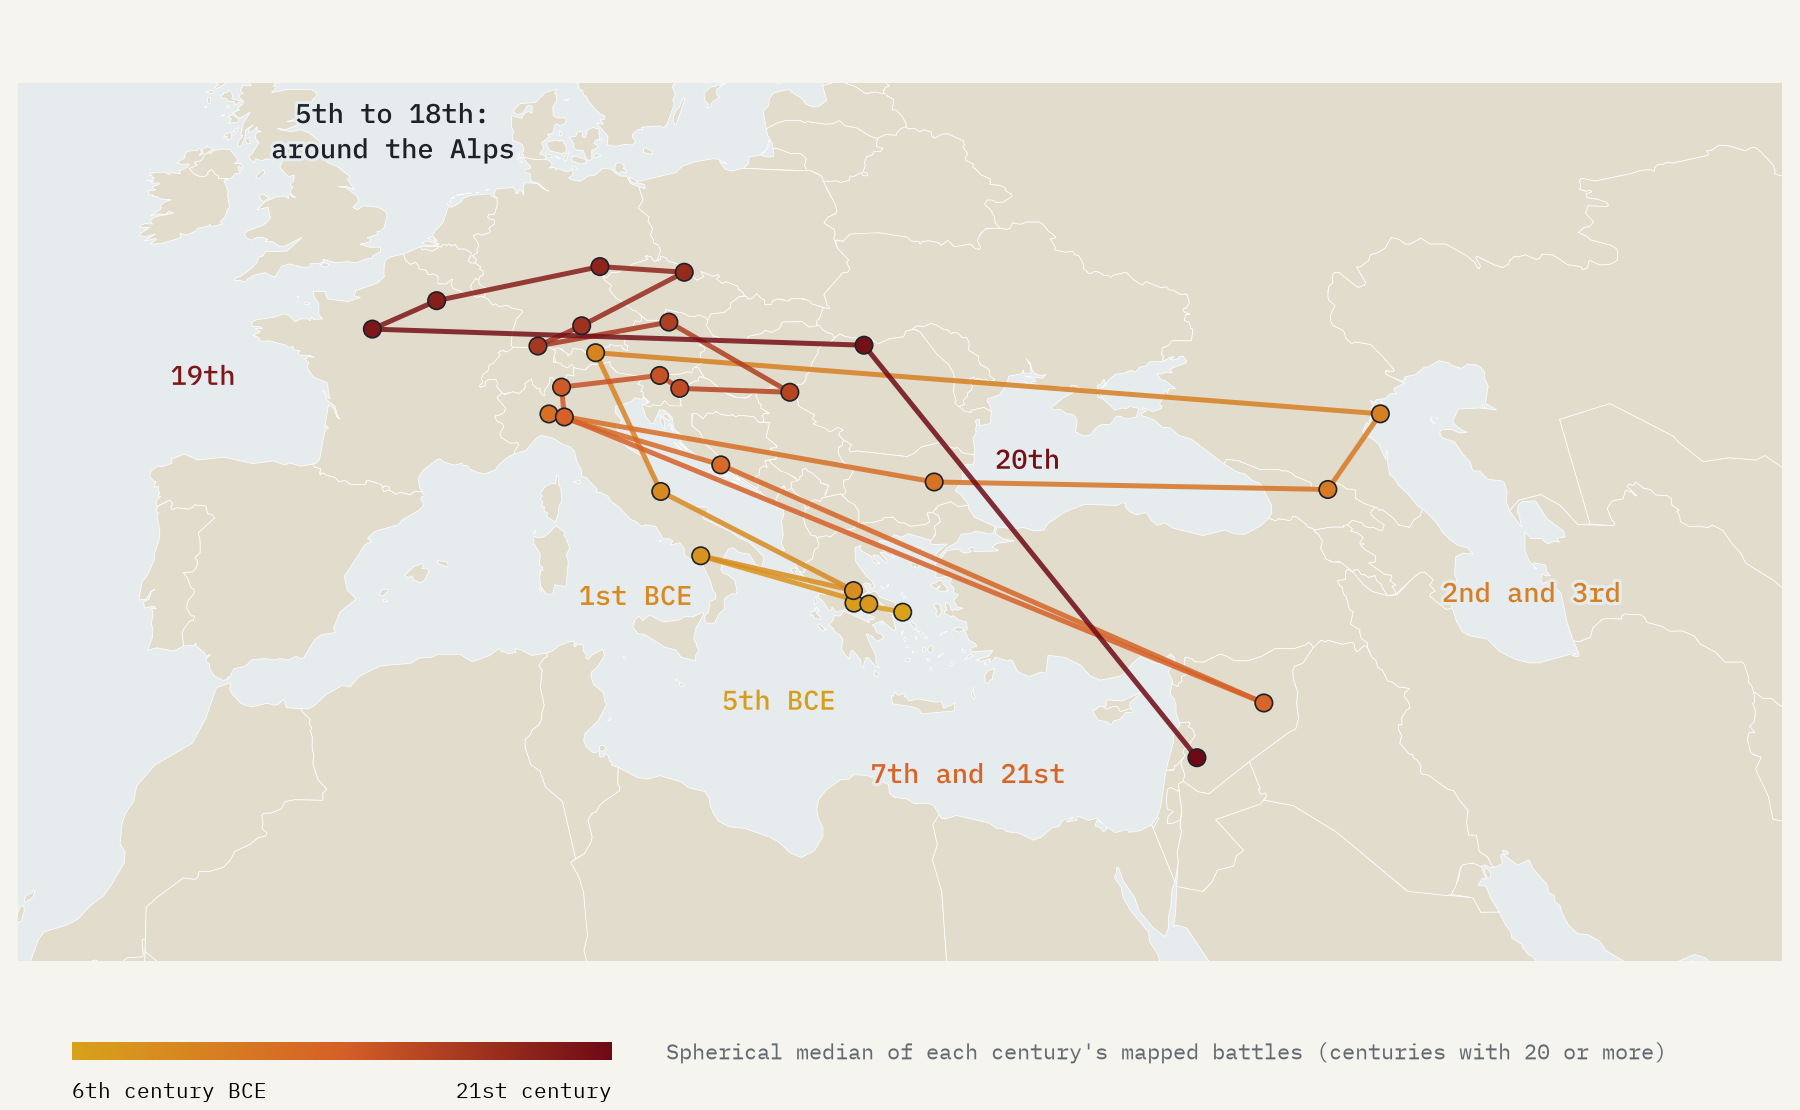
Where is the middle of the world’s recorded fighting? For each century I found the point on the globe closest, on average, to all of its battles. It sits in Greece in the age of Marathon and the Peloponnesian War and moves to Italy with Rome. Then, from the 5th century to the 19th, in every century but one it stays within 800 km of the middle of the Alps. The exceptions are revealing: in the 2nd and 3rd centuries it jumps east towards the Caucasus, because the record holds more battles from Han and Three Kingdoms China than from Rome, and in the 7th it moves to Syria with the Arab conquests. In the 21st century it has left Europe altogether, for Syria.
The most fought-over places on Earth
To compare places fairly I counted battles on a grid of equal-area hexagons, each about the size of Cyprus, and in regions of seven hexagons, about twice the size of Belgium. The winner will not surprise anyone who knows European history: Flanders, Artois and Brabant, with 369 battles across 17 centuries, from Caesar’s war against the Belgae and the Battle of the Golden Spurs to Waterloo and the battles of Ypres. Belgium has more battles for its size than any country larger than 20,000 km²: 63.4 for every 10,000 km².
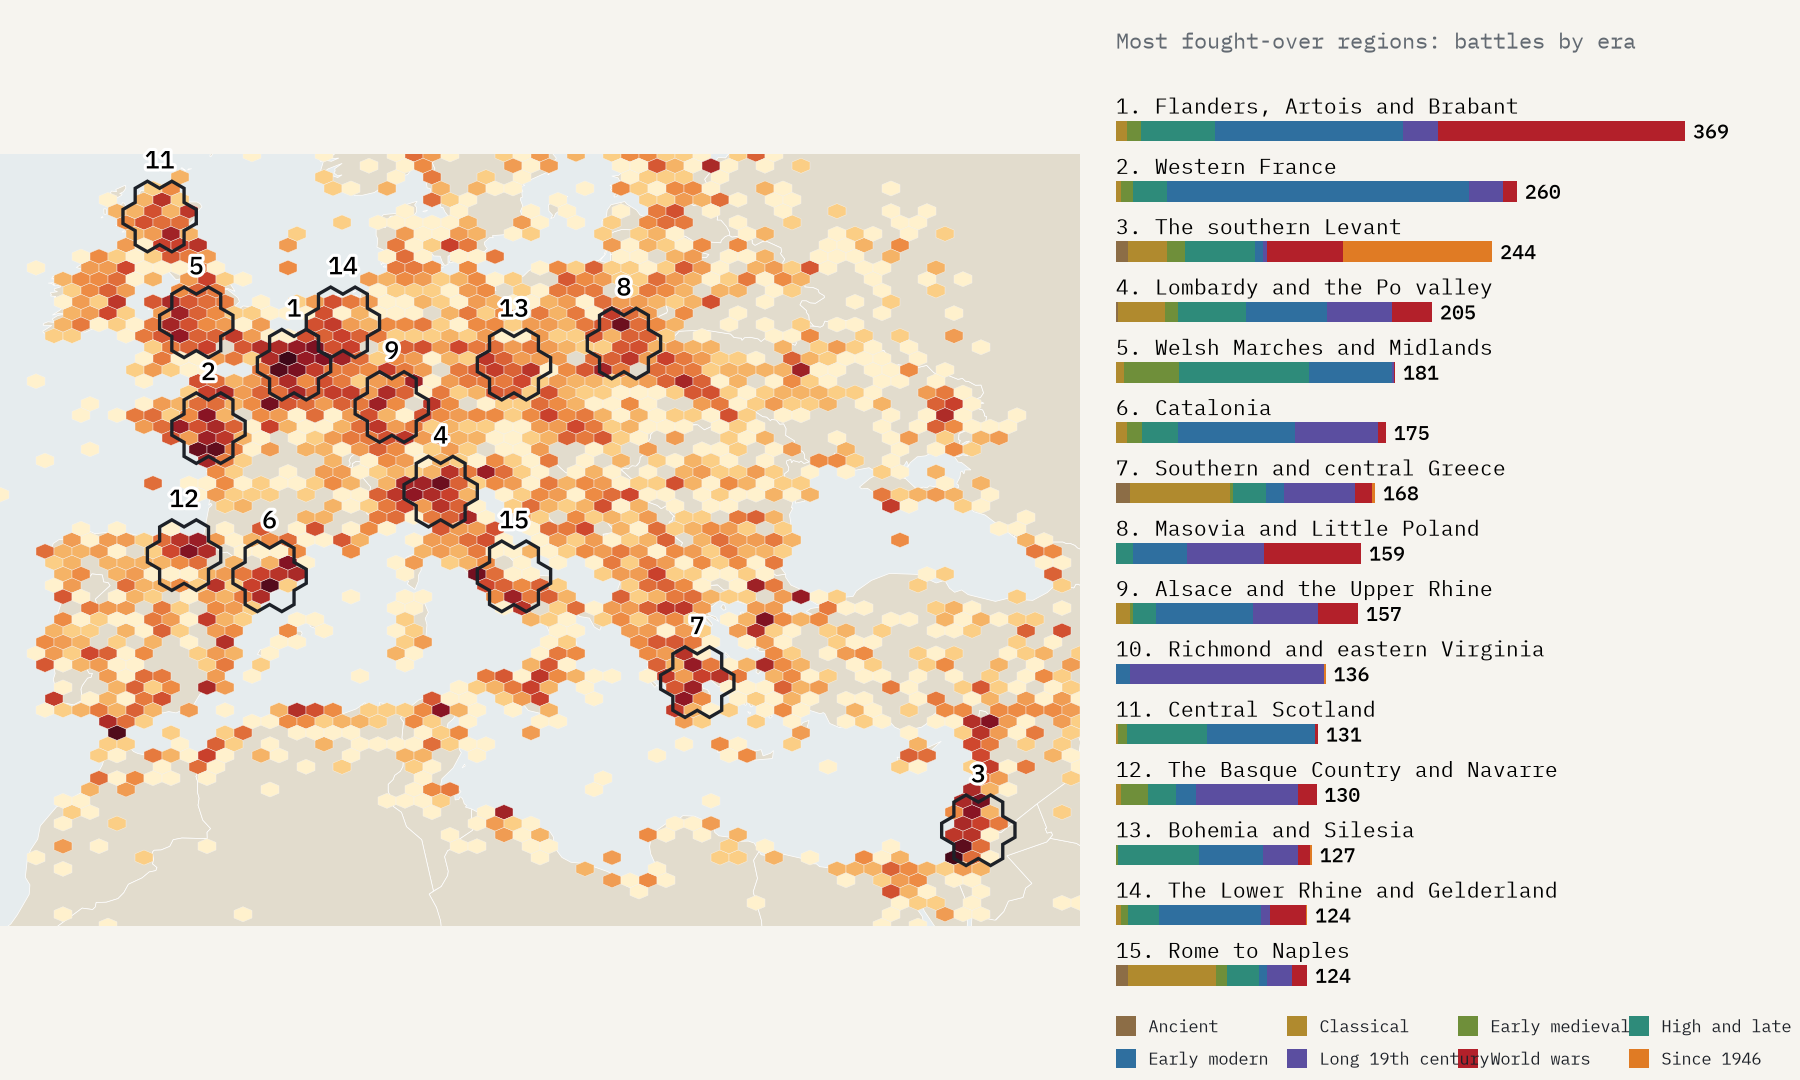
Counted by how long rather than how often, the Levant and Italy win. The hexagon around Jerusalem, Gaza and the coastal plain has battles in 16 different centuries, from 1025 BCE to 2025. Milan and Pavia have 16, and Rome 15. These are corridors between powers, and places worth holding, and they have been fought over for as long as there have been records.
The map of every battle is a map of war, but it is also a map of whose wars got written down, and in which language.
A map of who wrote things down
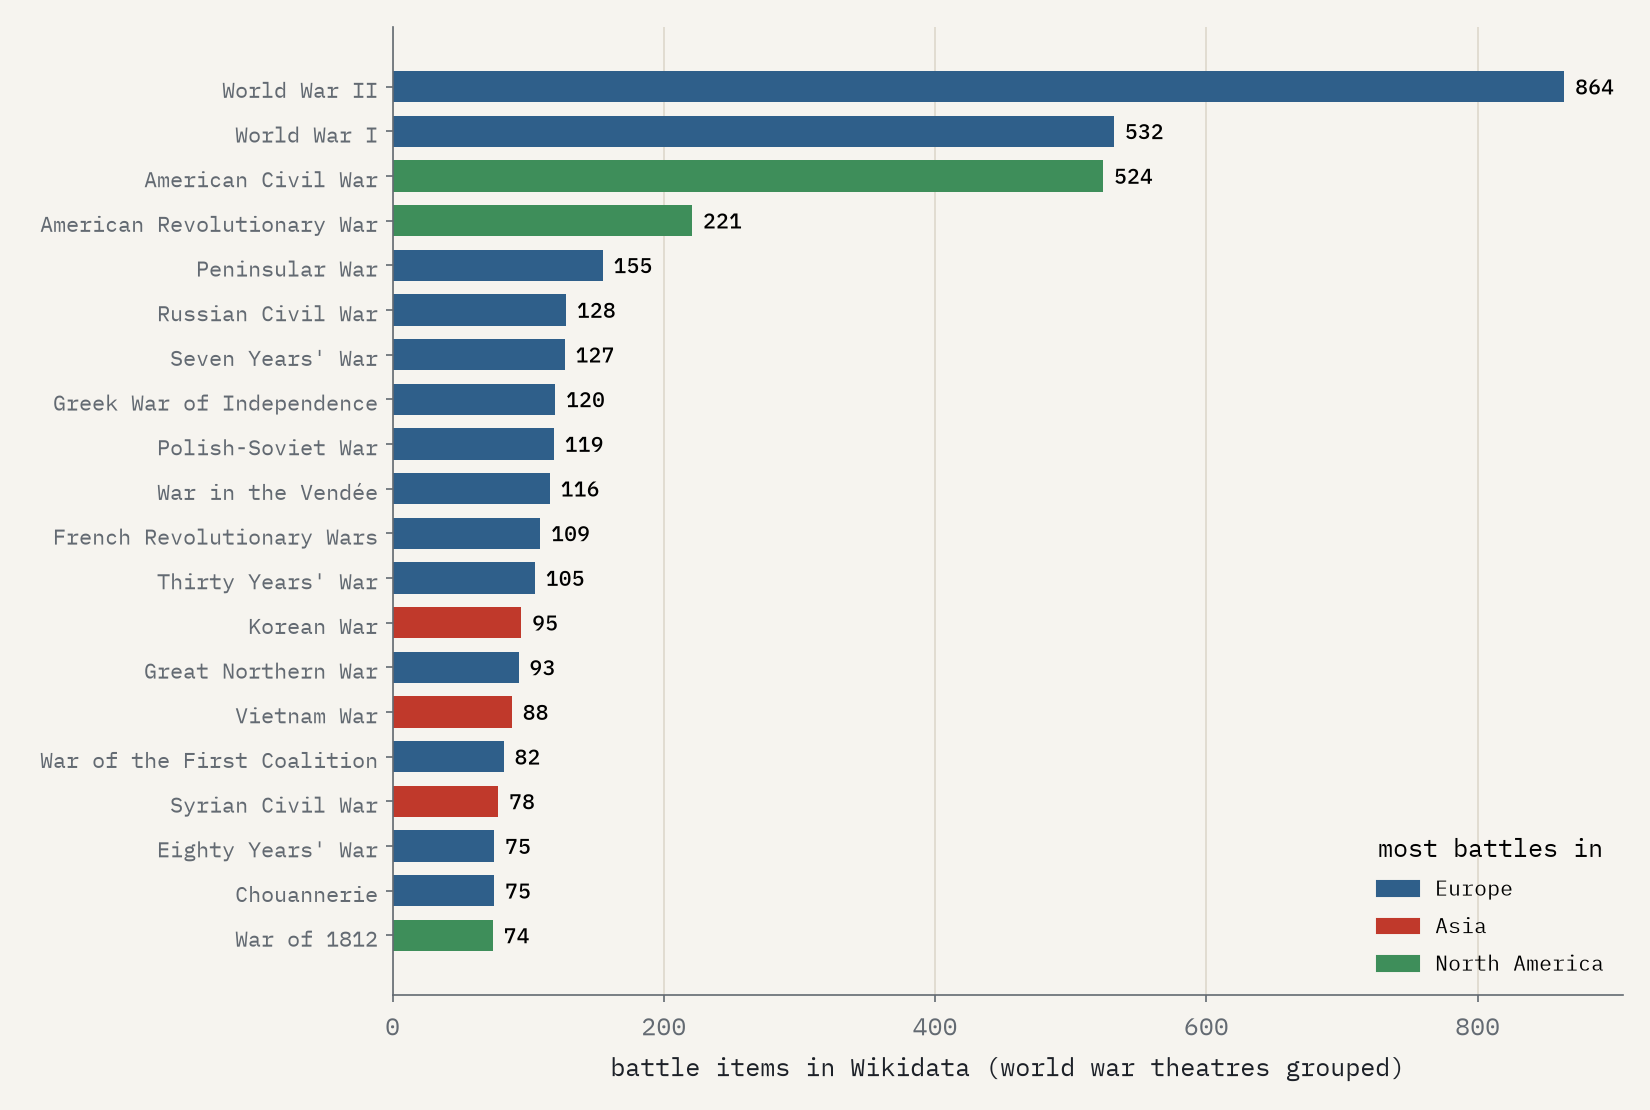
The second most fought-over region on the map is western France, from the Vendée to Normandy, with 260 battles. 68% of them come from the War in the Vendée and the Chouannerie of the 1790s, which between them have 191 battle items in Wikidata, more than the Thirty Years’ War. They were savage wars, but they are on the map in such detail because French Wikipedia editors have written up every skirmish. The best-recorded wars tell the same story: the Second World War has 864 battle items and the American Civil War 524, while no war in China, India or Africa makes the top 25.
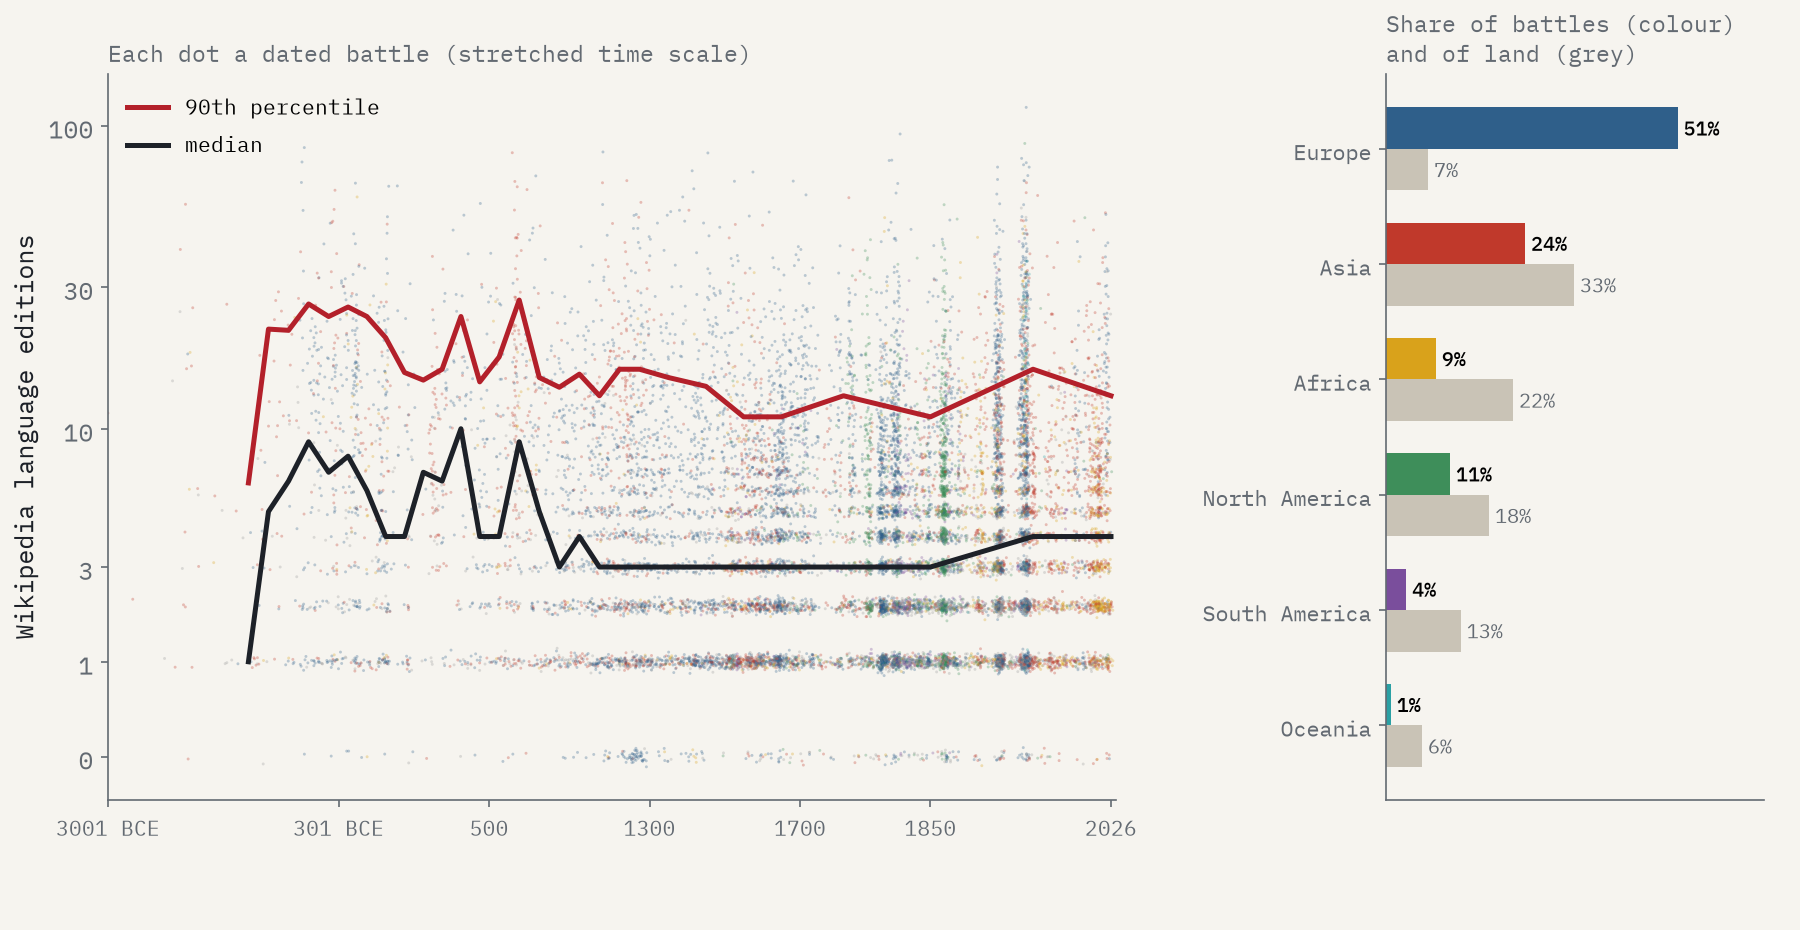
Overall, Europe has 51% of the mapped battles on 7% of the world’s land. Some of that is real: Europe was crowded, divided and constantly at war. But much of it is the record. And the thing called “battle” is slippery: only 79% of the items are actually called a battle in English, the rest being sieges, skirmishes, raids, massacres and operations, while famous fights such as Operation Barbarossa and the Siege of Leningrad are missing because they are typed as something else. Of the 709 entries in Wikipedia’s list of battles by casualties, I could match only 551 to a Wikidata battle.
How I did this
I took every Wikidata item that is an instance of battle or any of its subclasses, through the QLever endpoint, and reduced the query’s 23,069 rows to 20,202 items. Each item’s point is its own coordinates, or failing that its location’s; its year is its point in time, or failing that its start time, with BCE years converted from Wikidata’s astronomical numbering. Countries and continents come from Natural Earth. Hexagons are on an equal-area grid in the Equal Earth projection, and the centre of war is the spherical geometric median of each century’s battles. I grouped the theatres and campaigns of the two world wars into the wars, and matched Wikipedia’s list of battles by casualties to Wikidata by name and year. These are records, not a census of war: the map is heavily European and modern, generous to some wars and silent on others.
Notes and sources
- Wikidata contributors: items that are instances of battle (Q178561) and its subclasses, via the QLever SPARQL endpoint. CC0.
- Wikipedia contributors, List of battles by casualties, English Wikipedia. CC BY-SA 4.0; the matched table is shared under the same licence.
- Natural Earth outlines and places (public domain). Base map tiles on the interactive page © Esri.
- I wrote the text, with drafting and editing assistance from Claude (Anthropic), which also helped prepare the analysis code. I reviewed and checked all text and results.

