
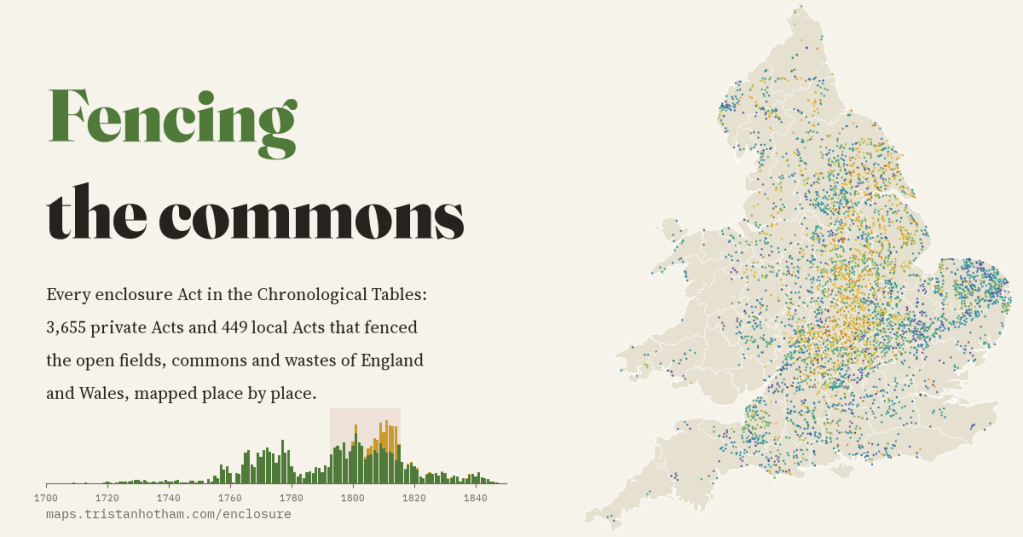
Between the 1750s and the 1830s Parliament passed thousands of Acts that fenced off England’s open fields and commons. I took every one listed in the official chronological tables, 4,104 of them, and put the parishes they name on a map, year by year.
Picture a Midland village around 1750. There are no hedged fields. Instead two or three huge open fields stretch away from the houses, each divided into long narrow strips, and every farmer’s strips are scattered across all of them. Beyond the fields lie the commons and wastes: rough grazing, heath, marsh and wood, where villagers with common rights could keep a cow or geese, cut turf and gather fuel. A century later almost all of it had gone, replaced by the patchwork of hedged fields that people now think of as timeless English countryside.
Much of that change was made by Act of Parliament. Where the landowners of a parish could not all agree to enclose, the big proprietors could petition for a private Act, which appointed commissioners to survey the parish, extinguish common rights and share the land out. The legislation.gov.uk website publishes Parliament’s own list of these Acts, its Chronological Tables of Private and of Local Acts. I extracted every title that mentions inclosure, the old spelling: 3,655 private Acts and 449 local Acts that enclosed land in England and Wales. Then I split them into the 5,375 parishes and townships they name and found 4,259 of them on the map.
Two waves
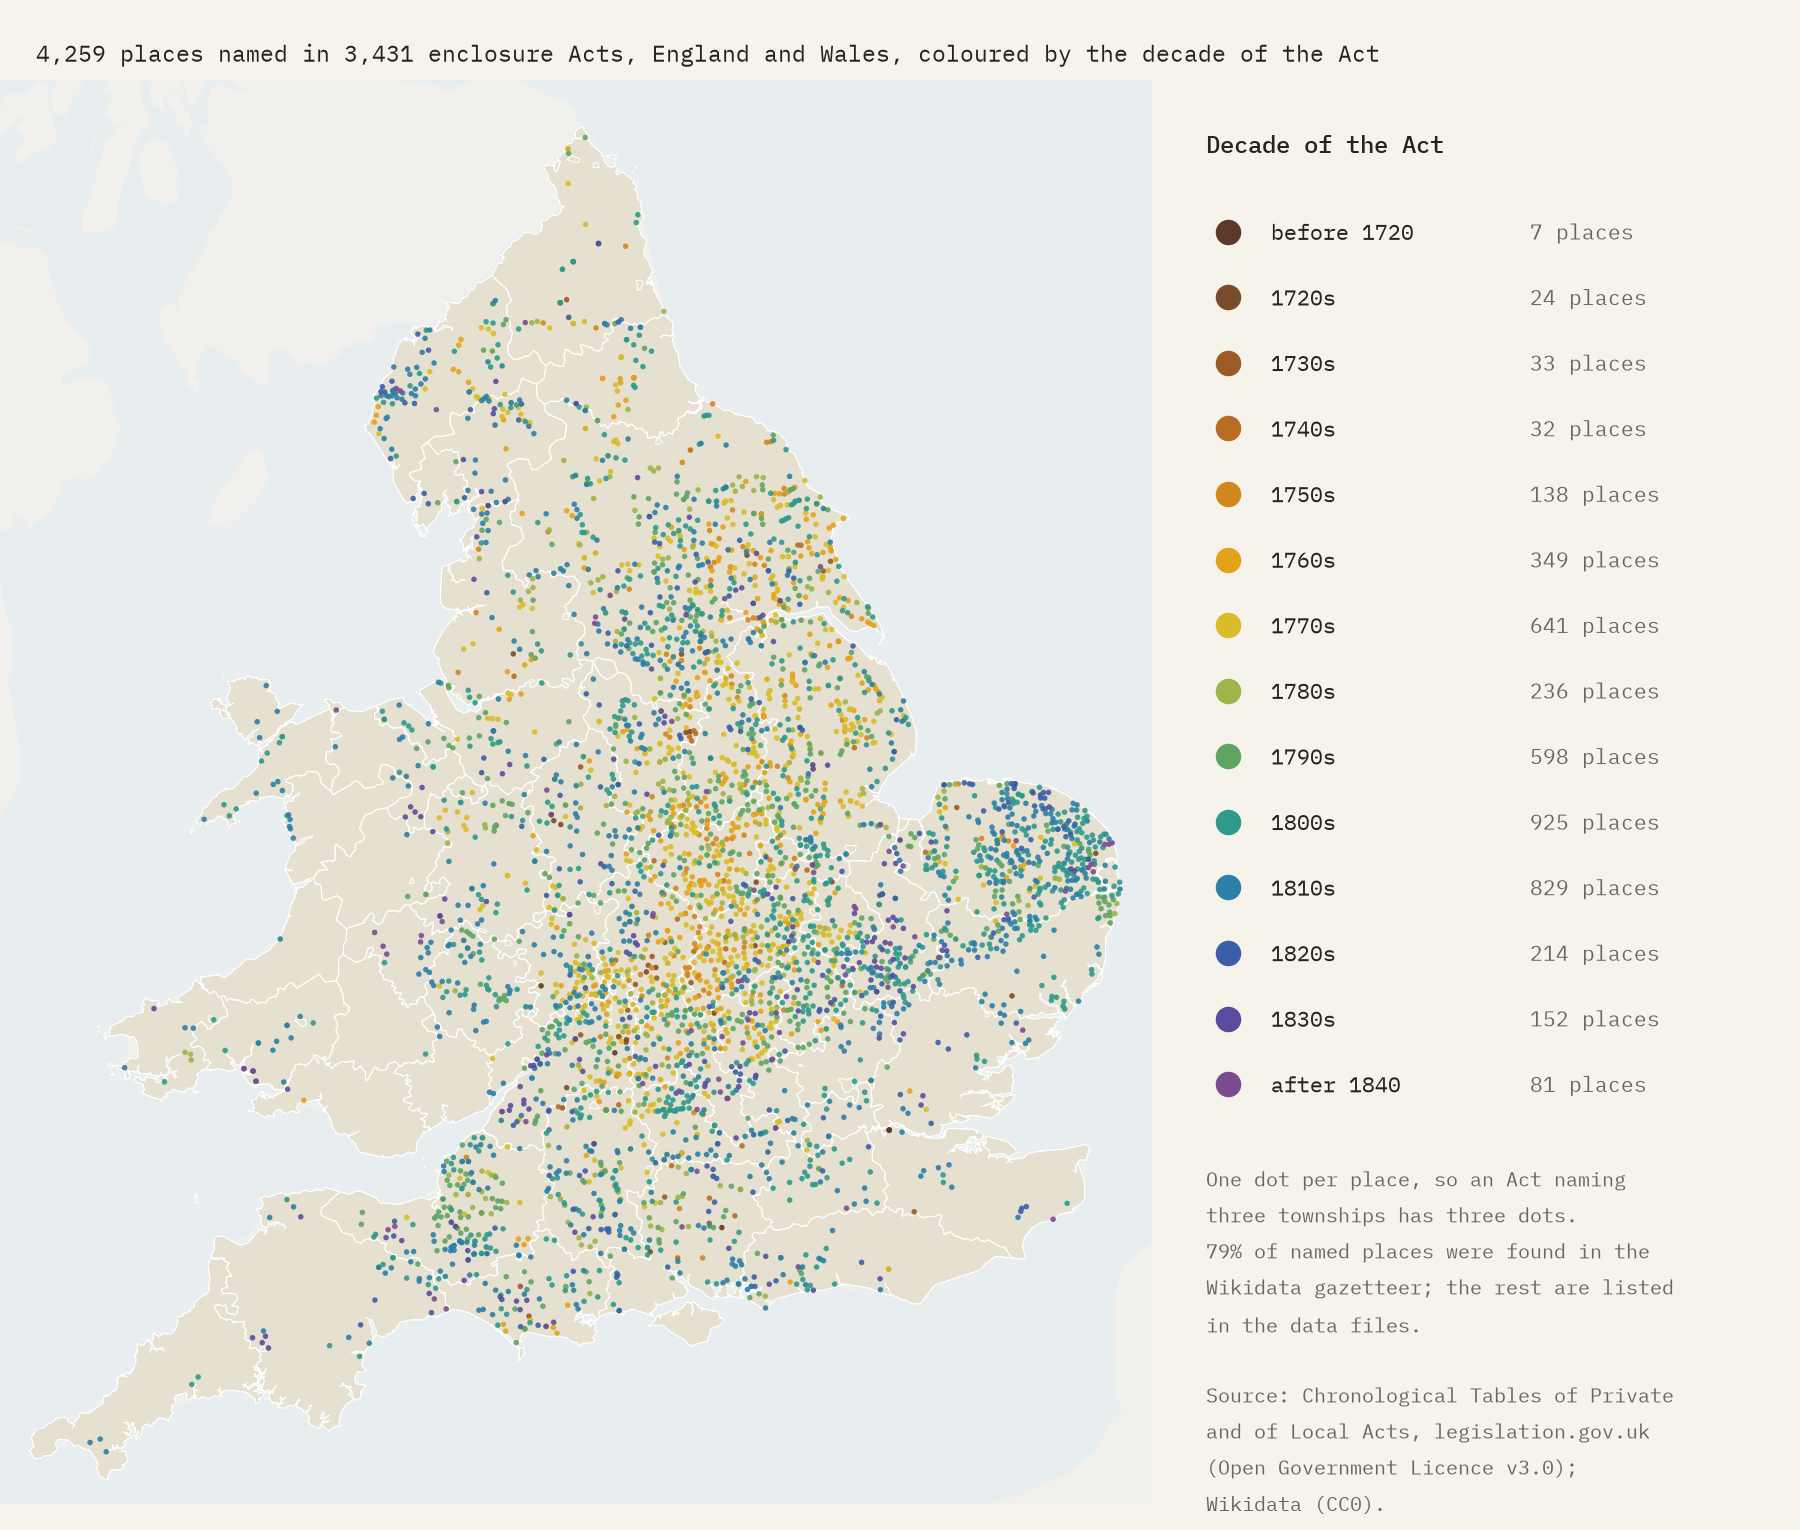
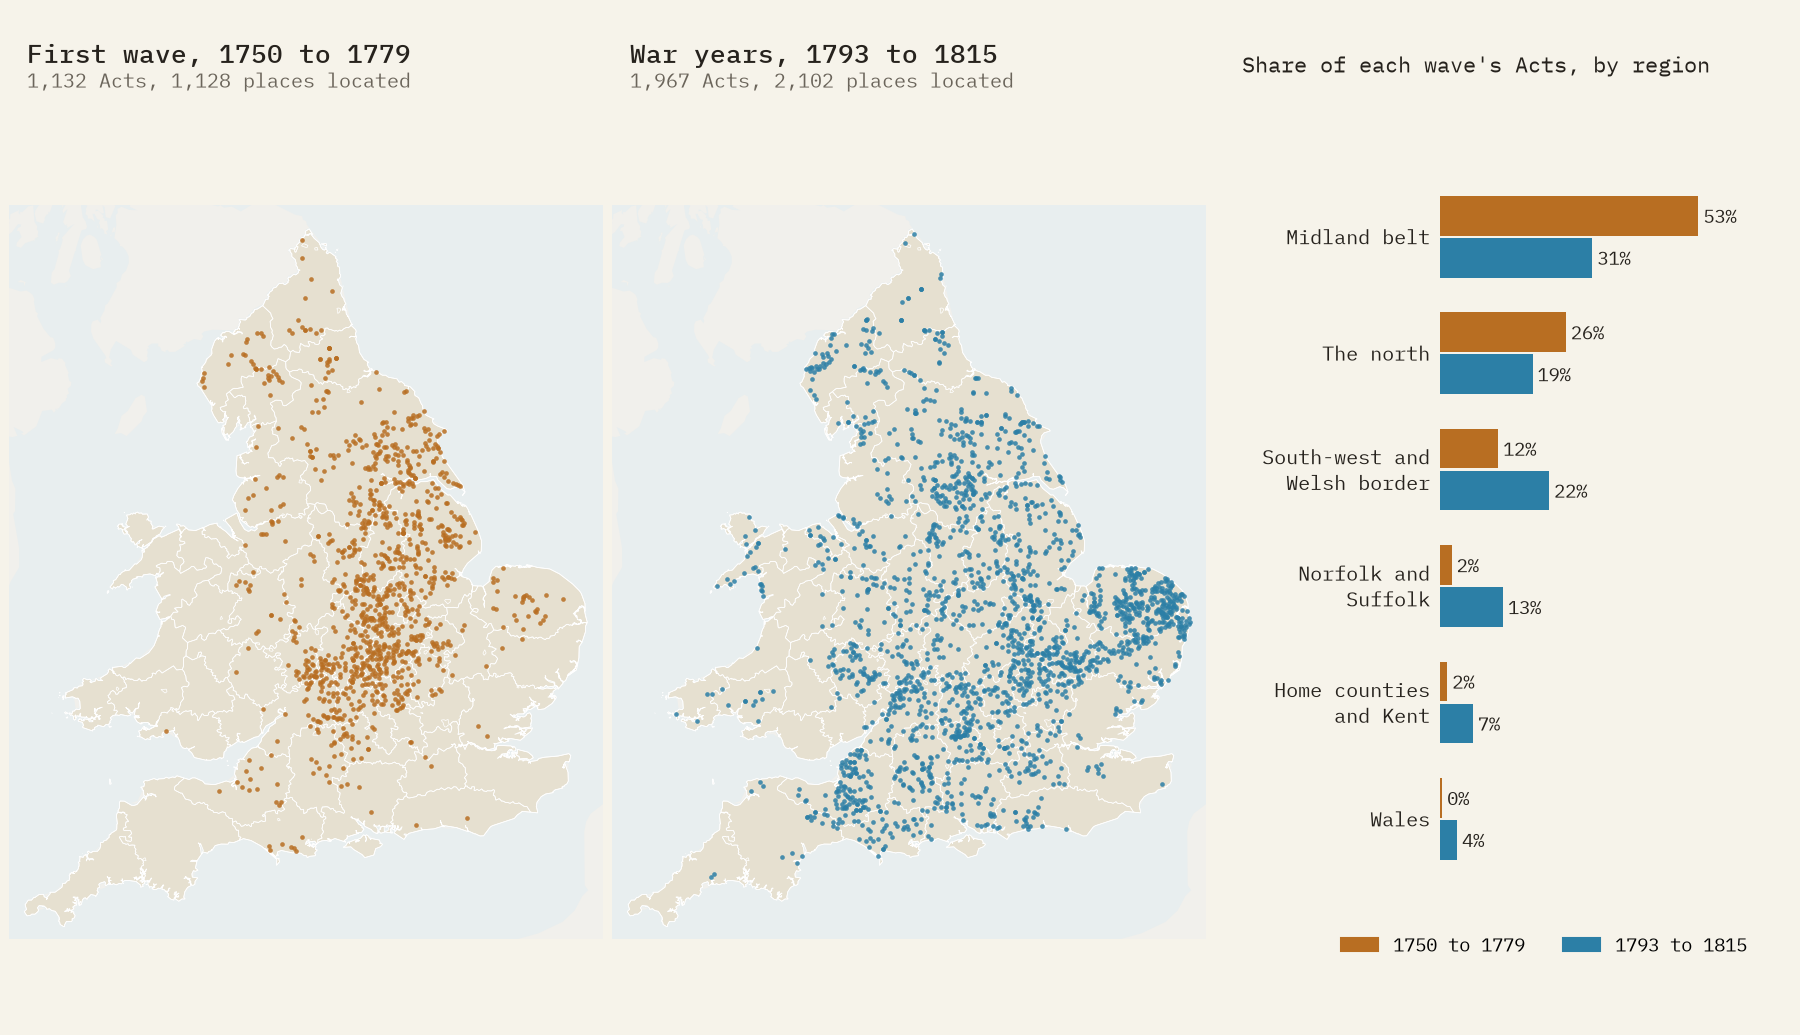
Enclosure by Act came in two great waves. The first built up in the 1750s and peaked in the 1760s and 1770s: 985 private Acts in twenty years, with 87 in 1777 alone. The 1780s were quieter. Then came the wars with Revolutionary and Napoleonic France, from 1793 to 1815. Harvests failed, imports were disrupted and wheat prices soared, and suddenly it paid to plough up commons and rearrange open fields. In those 23 years Parliament passed 1,967 enclosure Acts, 48% of all those in the tables, with a peak of 125 in 1811. When peace came, the boom stopped dead: 114 Acts in 1814, 43 in 1816.
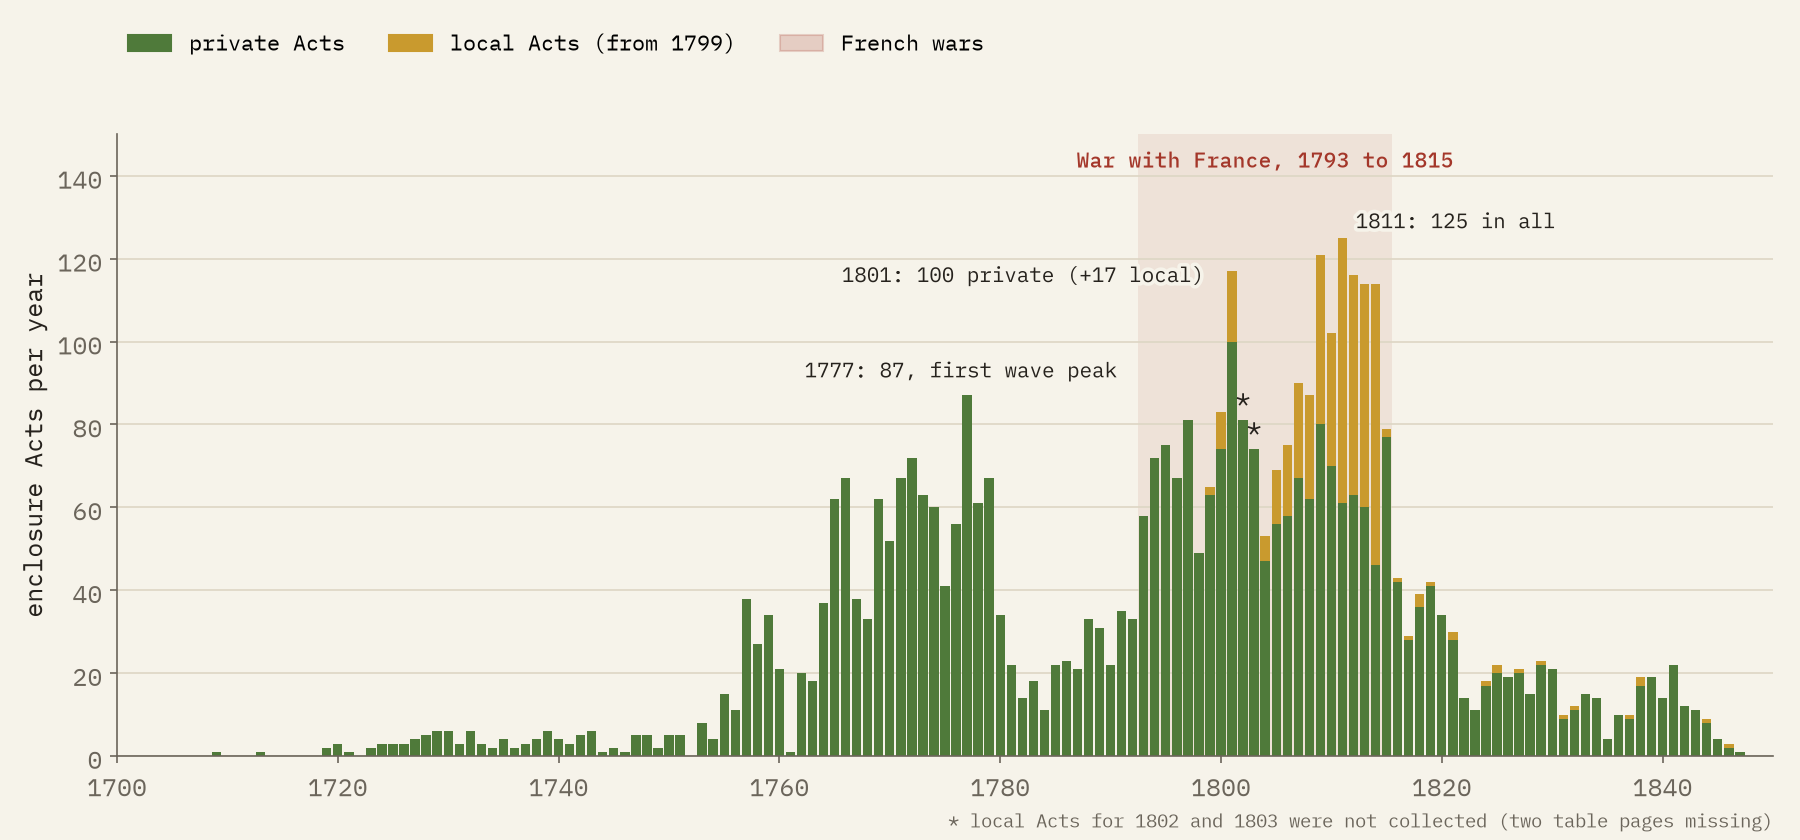
There is a twist in the records. From 1799 more and more enclosure Acts were listed in the table of local Acts instead of the private one: in 1811 to 1814 about half of them. Look at the private Acts alone and the second wave seems to peak in 1801 and fade. Add the two tables together and it keeps rising until 1811.
48% of all the enclosure Acts in the tables were passed in the 23 years of war with France.
The Midland belt
Enclosure by Act was above all a Midland business. Northamptonshire had more Acts for its size than any other county: 193 private Acts, 7.5 for every 100 square kilometres. Leicestershire, Rutland, Huntingdonshire, Nottinghamshire and Warwickshire follow. Twelve Midland and East Midland counties, about a fifth of England by area, account for 39% of its private enclosure Acts. This was the heartland of the open-field system, where it had survived longest.
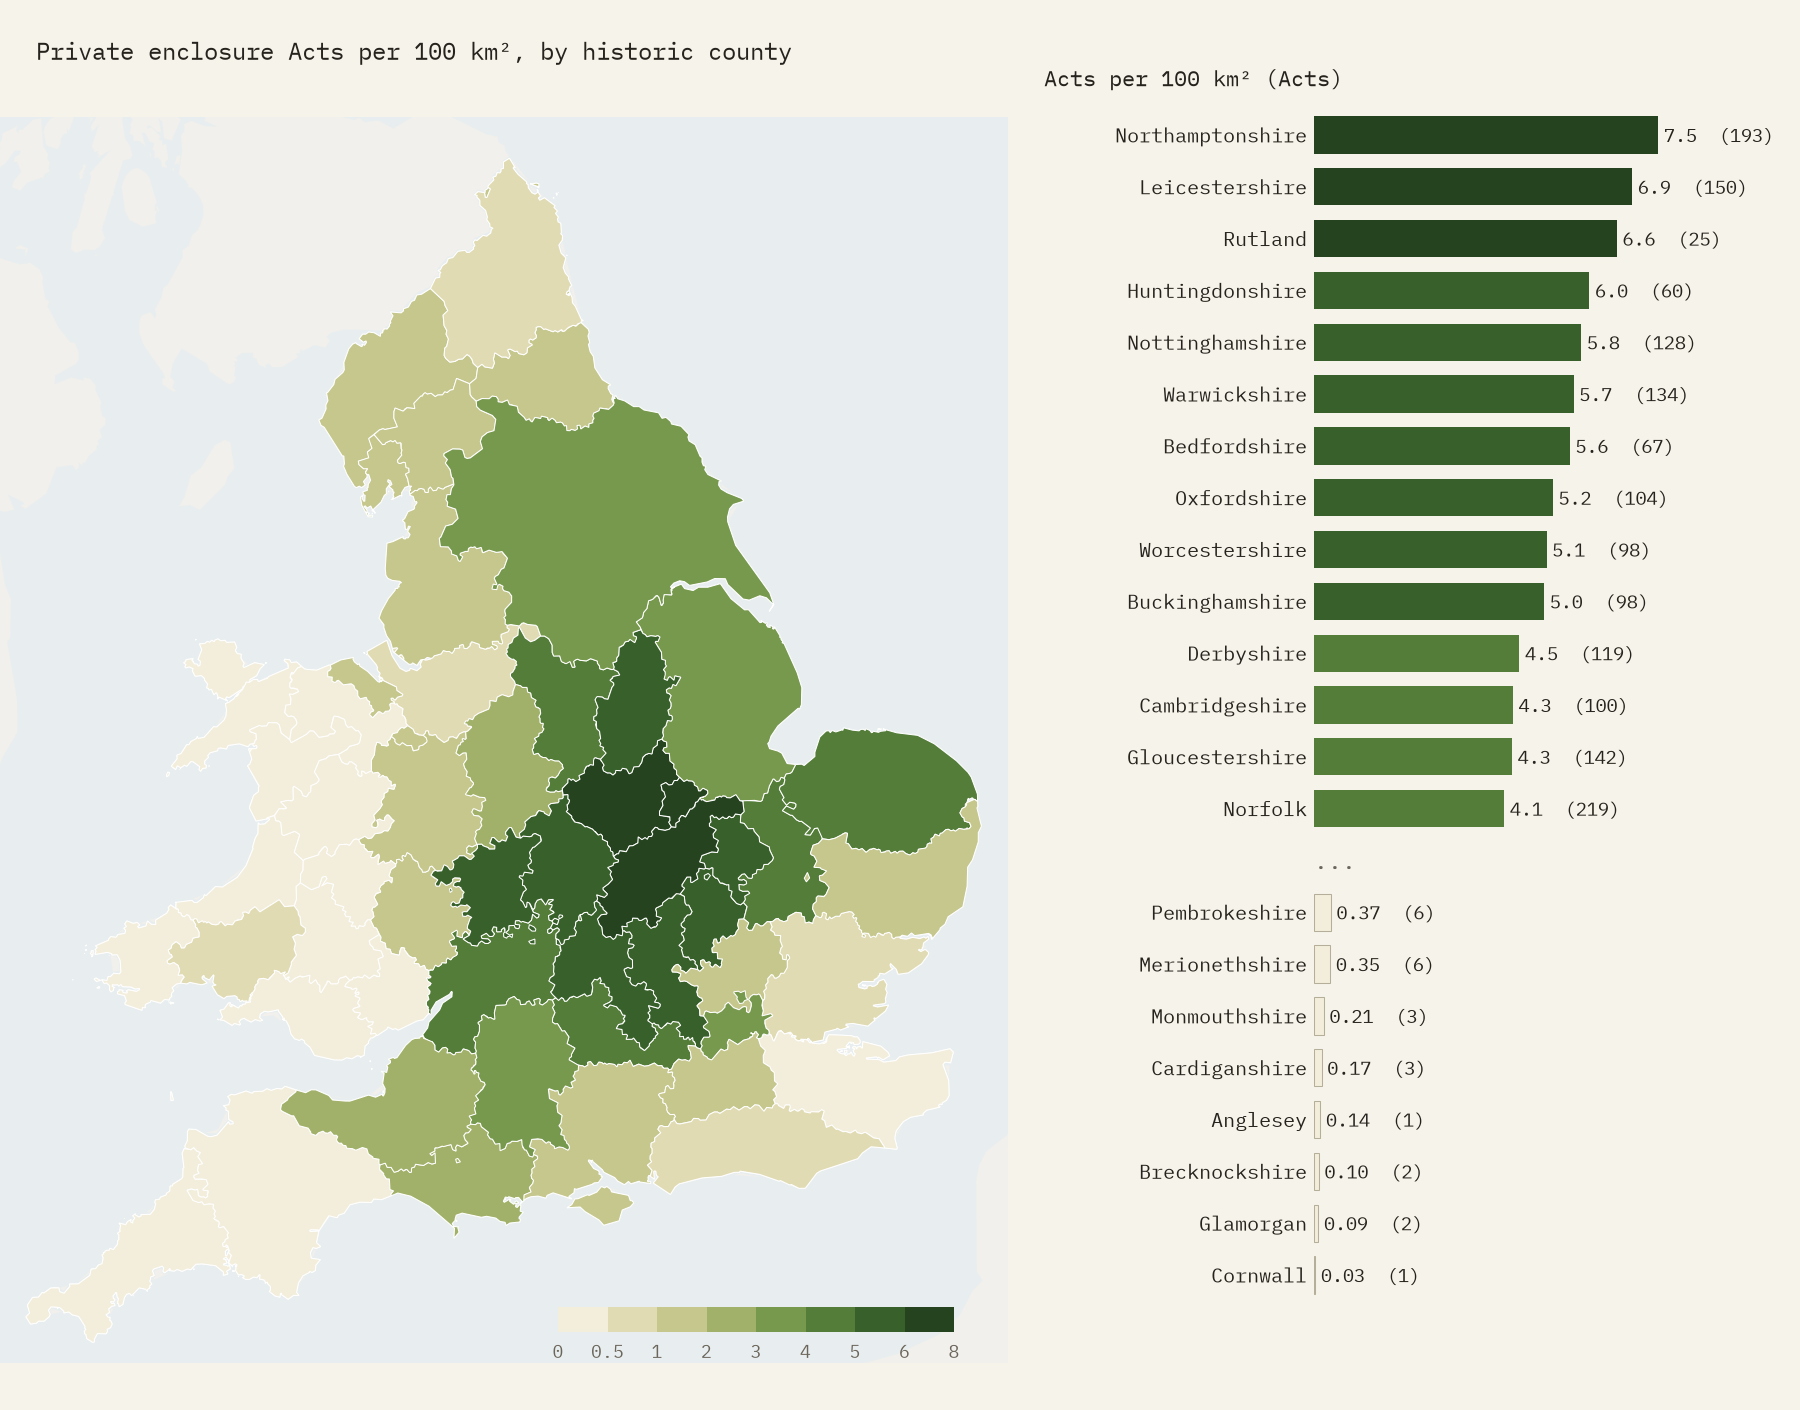
At the other end of the list are counties that hardly needed Parliament, because they had been enclosed piece by piece or by private agreement long before, or had never had much open field. Kent had 15 private enclosure Acts, Devon 26, and Cornwall exactly 1. Yorkshire had the most of any county by number, 544, but it is enormous; for its size it sits in the middle of the table.
The second wave went somewhere new
The war-years boom was not a repeat of the first wave. In 1750 to 1779 more than half the Acts were for the Midland belt; in the war years, under a third. The new ground was elsewhere. Norfolk and Suffolk went from 2% of all Acts to 13%, the south-west and the Welsh border from 12% to 22%, and Wales, almost untouched before, began to enclose its hill commons. Norfolk, with its light sandy heaths, ended up with 261 Acts, 68% of them in the war years. The north, by contrast, did not grow its share.
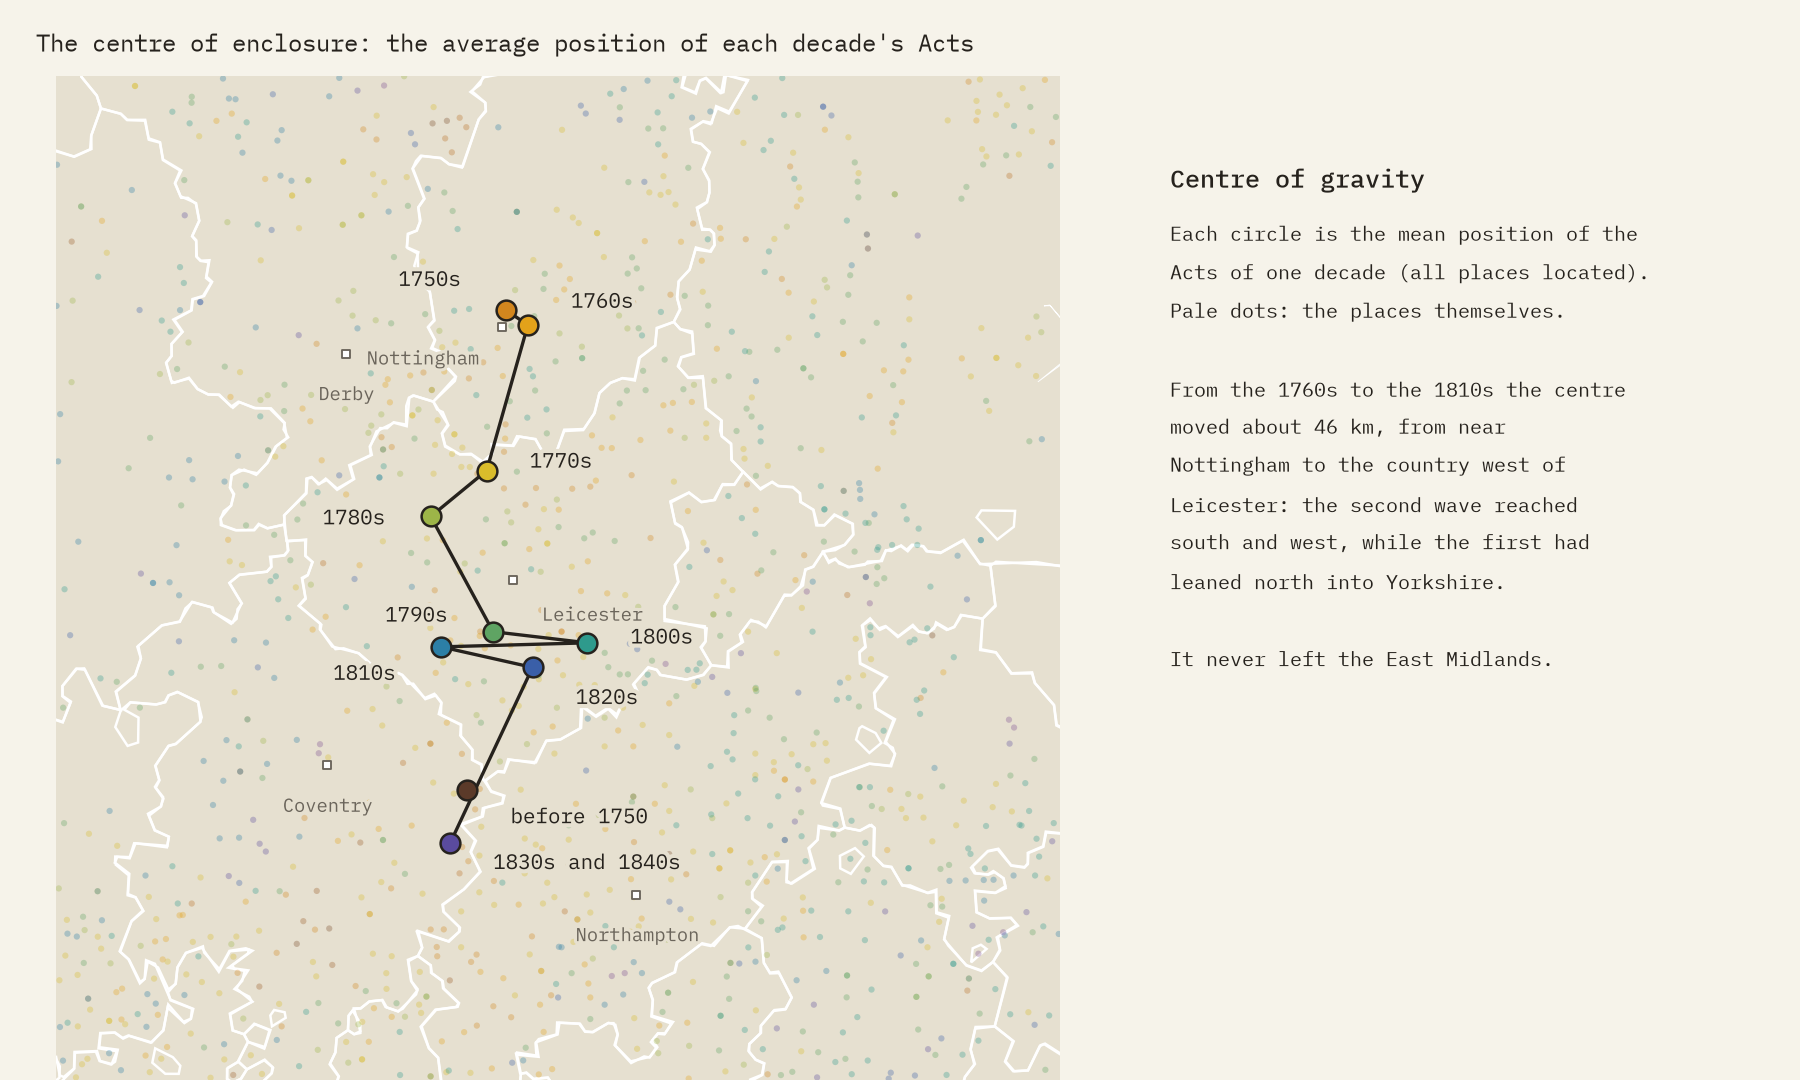
Average the position of each decade’s Acts and you get a centre of gravity that wanders, but never far. In the 1760s it sat on the edge of Nottingham, pulled north by Yorkshire and Lincolnshire. By the 1810s it had moved about 46 km, to the country west of Leicester. It never left the East Midlands.
Odd ones
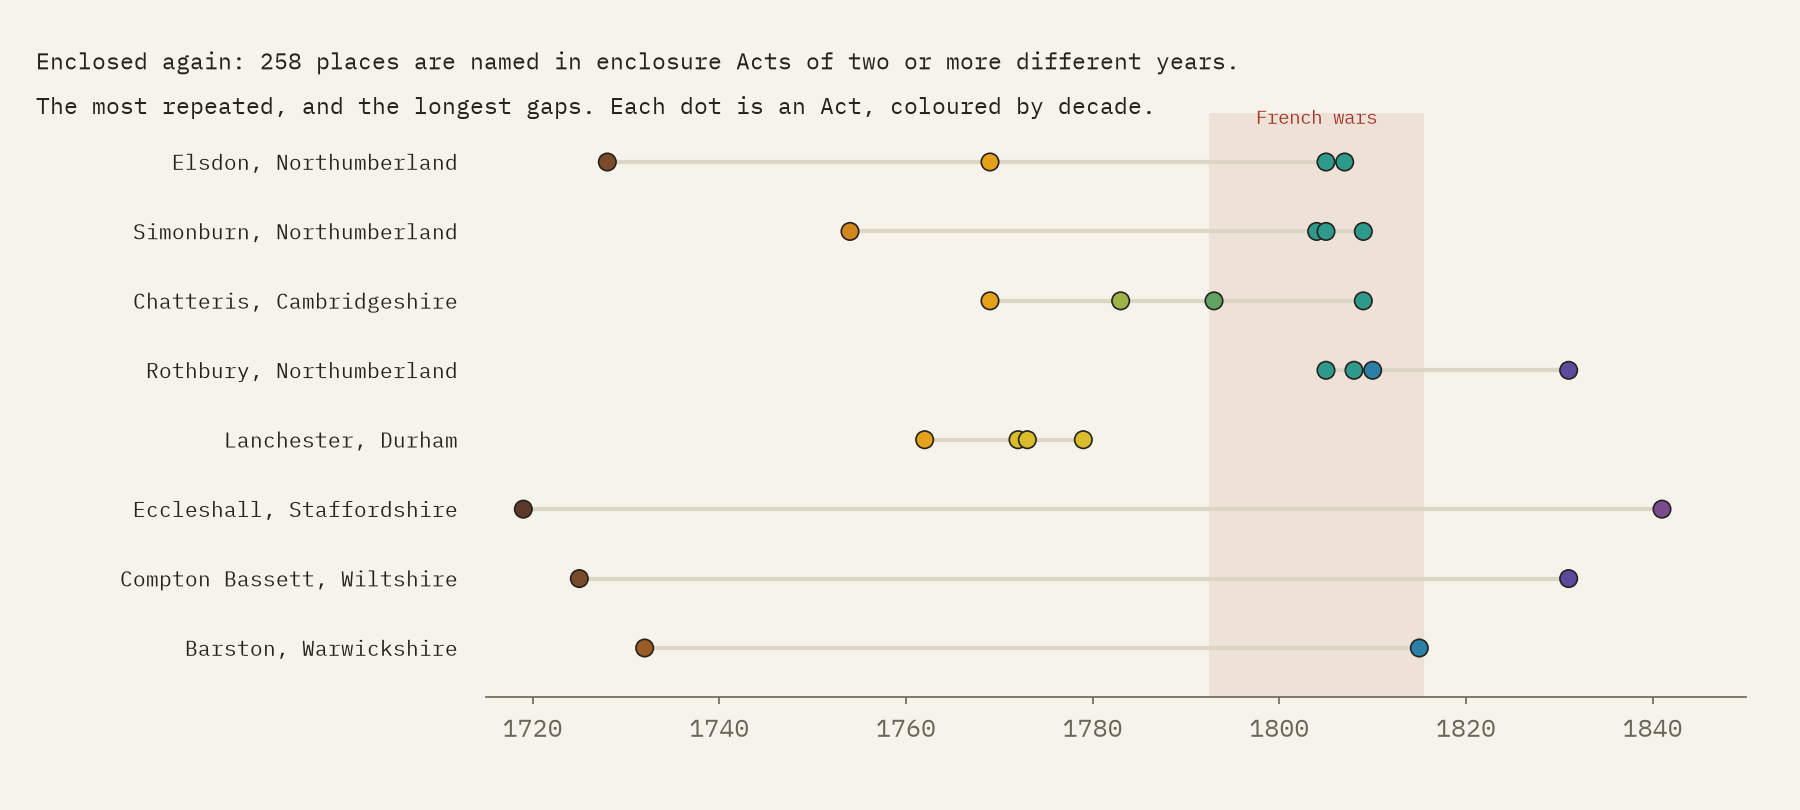
The very first title in the tables that mentions enclosure is from 1562, under Elizabeth I: an Act for draining and enclosing Plumstead Marsh, on the Thames below London. The biggest is a 1811 Act naming 10 places around Shenstone in Staffordshire. And some places come up again and again. 258 are named in enclosure Acts of two or more different years, usually because a parish enclosed its open fields first and its commons later. Elsdon in Northumberland appears in four, from 1728 to 1807. At Eccleshall in Staffordshire, a heath was enclosed in 1719 and the parish again in 1841, 122 years later.
Who won, who lost
Historians have argued about enclosure for over a century, and both sides have a point. Enclosed land could be drained, consolidated and farmed with new crops and rotations, and studies such as J. D. Chambers and G. E. Mingay’s The Agricultural Revolution and Michael Turner’s English Parliamentary Enclosure found that output and rents rose where it happened. Robert Allen’s Enclosure and the Yeoman argued that the gains were smaller than claimed and went mostly to landlords. On the other side, the Hammonds’ The Village Labourer and J. M. Neeson’s Commoners showed what the poor lost: the right to graze a cow, gather fuel and glean, which had kept many families afloat. Those who could prove a legal claim got land; many cottagers got nothing, or a scrap too small to use. More food from the same land, and much of it taken from the people with least: both can be true.
How I did this
The source is legislation.gov.uk’s Chronological Tables of Private and of Local Acts (Open Government Licence). I rejoined titles split over two rows, dropped the notes recording later repeals, dated each Act by its parliamentary session, and kept every title mentioning inclosure, setting aside amendments and Acts for Ireland. Places were matched to a Wikidata gazetteer within the county the title names, allowing for old spellings; 79% were found, and nothing else was guessed. Two pages of the local table, for 1802 to 1803 and for 1841, could not be collected. This counts Acts as the tables list them, not every enclosure: the figure of more than 5,000 English enclosure Acts that historians usually quote includes Acts and awards these tables do not itemise, and much enclosure happened by agreement without any Act. County shapes are rebuilt from the gazetteer. The paper sets out every step.
Notes and sources
- legislation.gov.uk, Chronological Table of Private and Personal Acts and Chronological Table of Local Acts. Crown copyright, Open Government Licence v3.0.
- Wikidata places with coordinates and historic county (CC0).
- W. E. Tate, A Domesday of English Enclosure Acts and Awards (1978); M. Turner, English Parliamentary Enclosure (1980); J. D. Chambers and G. E. Mingay, The Agricultural Revolution 1750 to 1880 (1966); R. C. Allen, Enclosure and the Yeoman (1992); J. L. and B. Hammond, The Village Labourer (1911); J. M. Neeson, Commoners (1993).
- I wrote the text, with drafting and editing assistance from Claude (Anthropic), which also helped prepare the analysis code. I reviewed and checked all text and results.

