
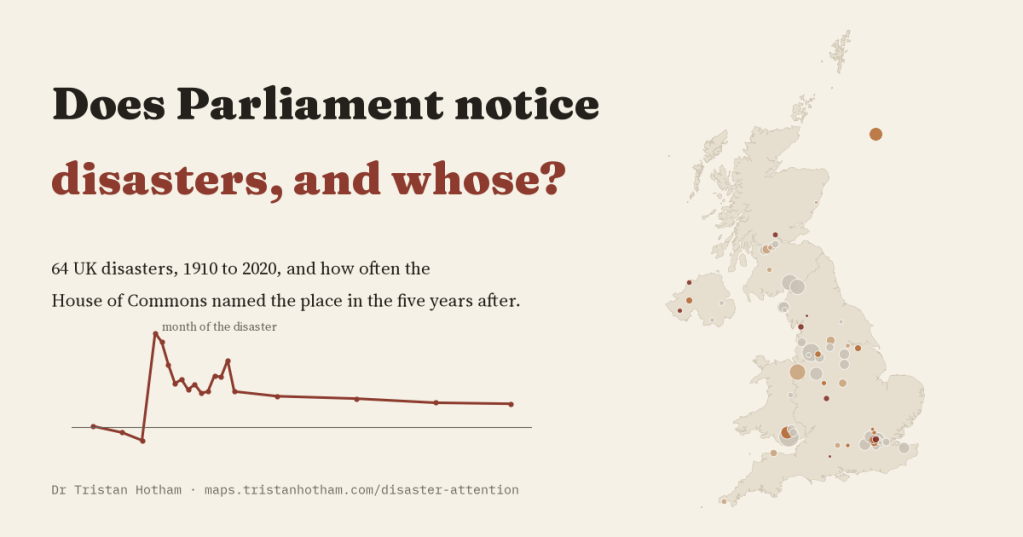
When a disaster takes lives, the name of the place often becomes known across the country. I counted, month by month, how often the House of Commons named the places of 64 UK disasters between 1910 and 2020. Parliament notices at once. Most of that attention fades within the year, and the number of people who died explains surprisingly little of it.
Aberfan, Lockerbie, Dunblane, Grenfell. Some place names now carry the memory of the people who died there. Political scientists call disasters “focusing events”: sudden events that draw the attention of the public and of governments to a problem. I wanted to see what that looks like in the House of Commons, over a long period and with a common measure. How much more often is a place named after a disaster? For how long? And does it depend on how many people died, or on where the disaster happened?
I built a list of 64 disasters in the UK from 1910 to 2020, in which 4,346 people died: pit explosions, rail and air crashes, fires and explosions, crowd crushes, bombings and shootings, a flood and an outbreak of typhoid. For each I counted the Commons speeches each month that named the place, from two years before to five years after, using Parliament’s own Hansard search. I wrote down how I would analyse it before I ran any of the models.
Noticed at once
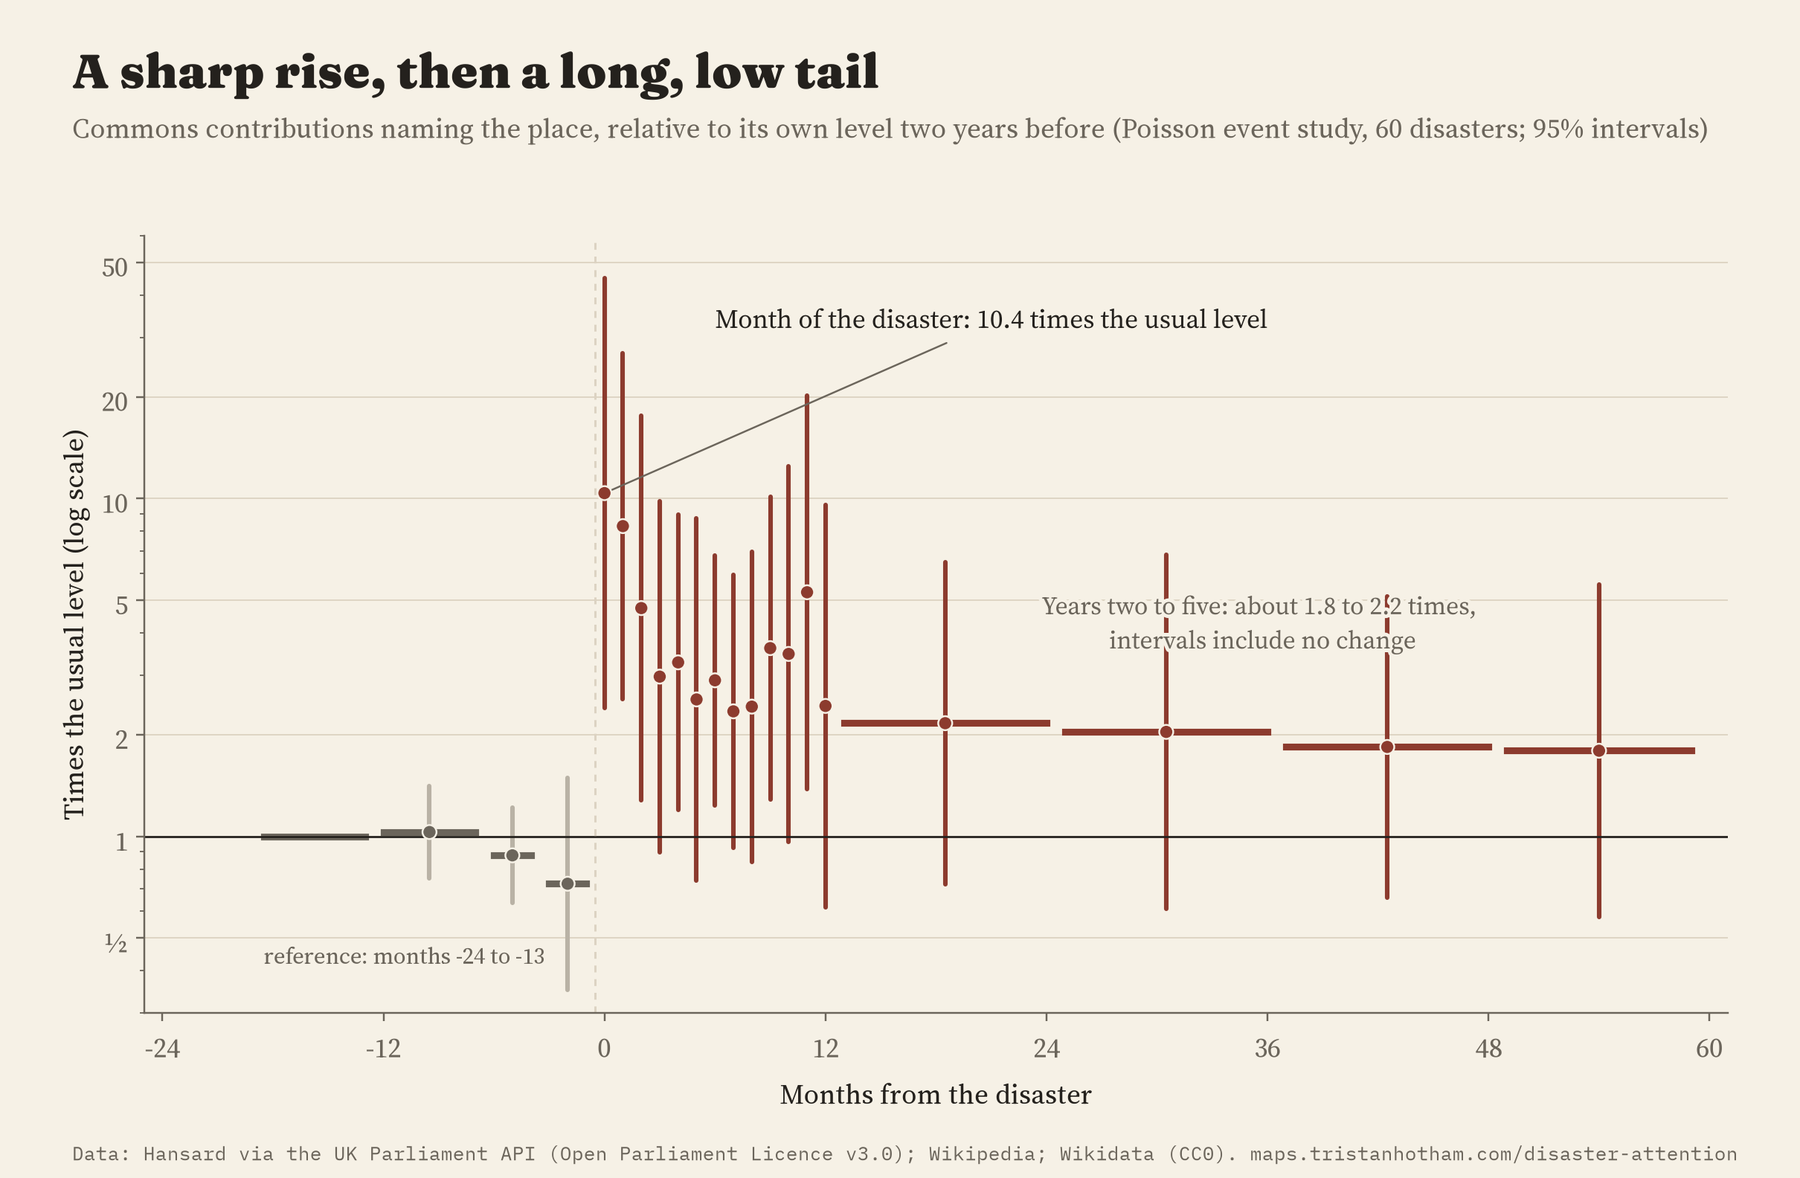
In the month of a disaster, speeches naming the place rose to 10.4 times their usual level, and to 8.3 times the month after. Within a few months the rise had fallen to two to five times the usual level, and from the second year to the fifth it sat at about two times, too uncertain to tell apart from no change. In the two years before each disaster, there was no sign of anything building up.
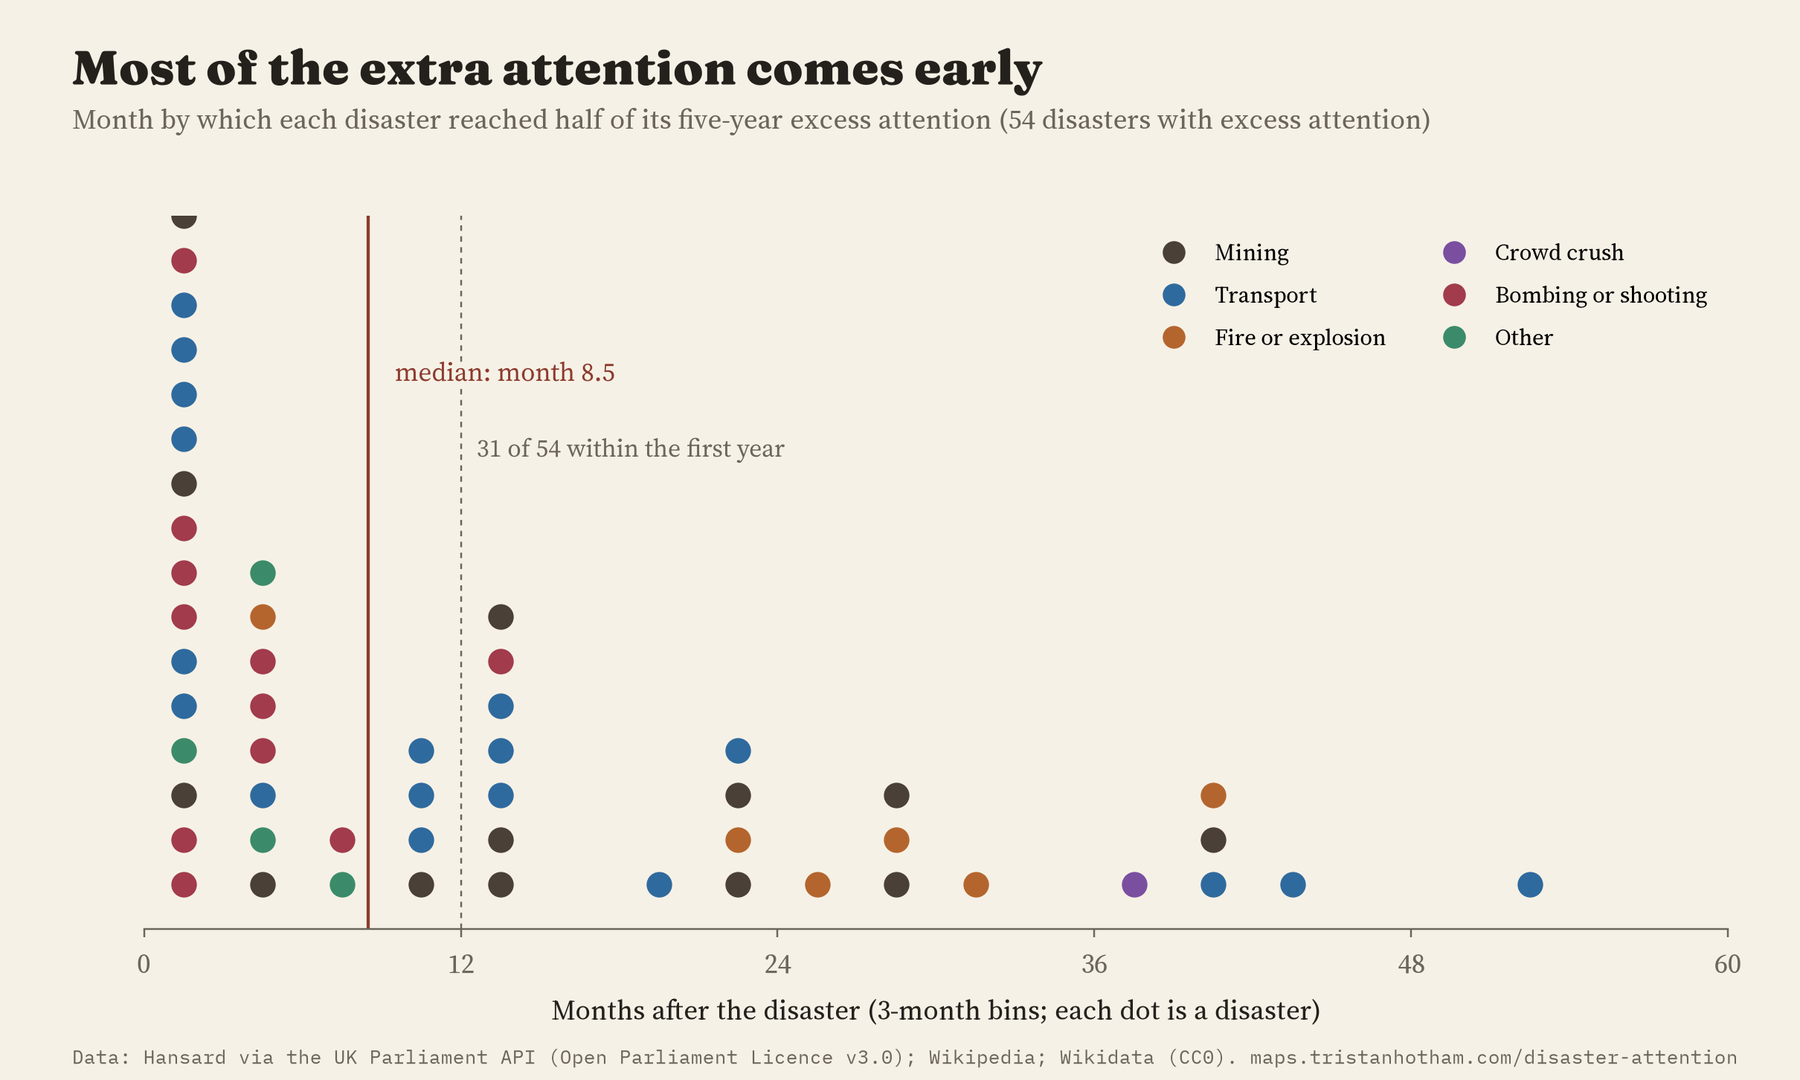
I also asked, for each disaster, how long it took to reach half of all the extra attention it would get in five years. The typical answer was 8.5 months. For 31 of the 54 disasters with any extra attention, half had come within the first year.
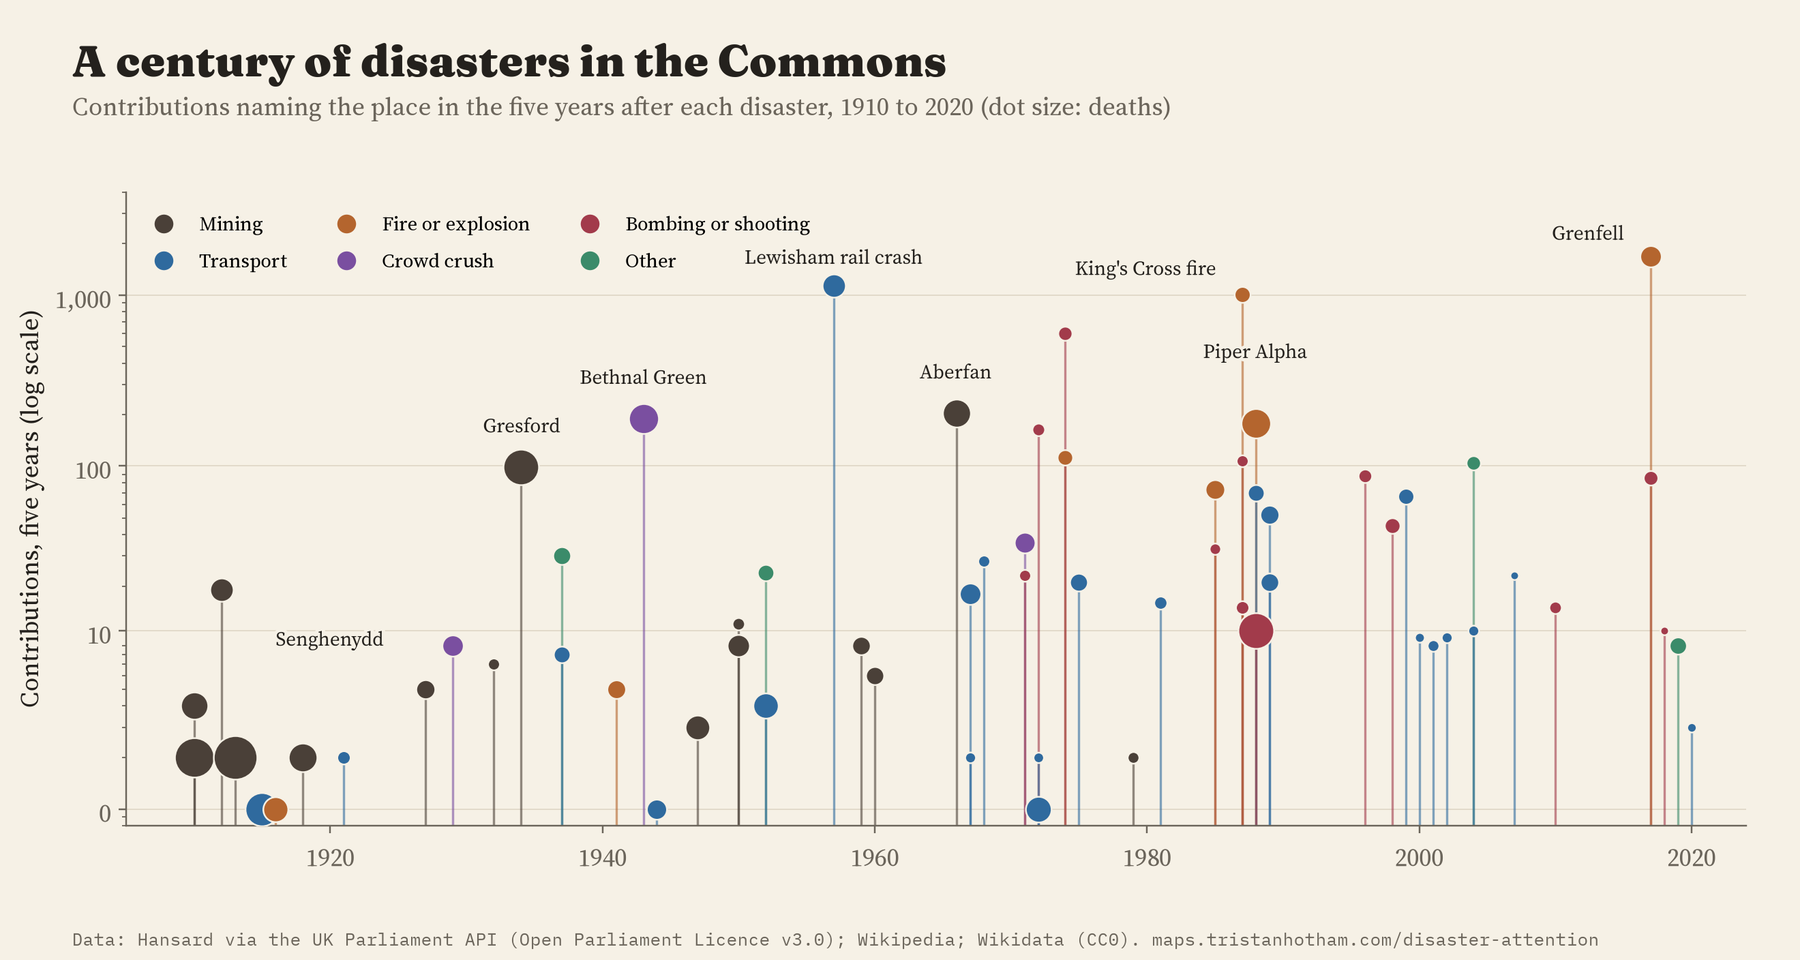
A few disasters held Parliament’s attention for much longer. Grenfell Tower took 23 months to reach half of its five-year total, Piper Alpha 28 and the Gresford colliery disaster of 1934 29. Each was followed by a public inquiry, and MPs kept coming back to them. The data cannot say whether the inquiry caused the attention, but long tails and long aftermaths go together.
The death toll explains little
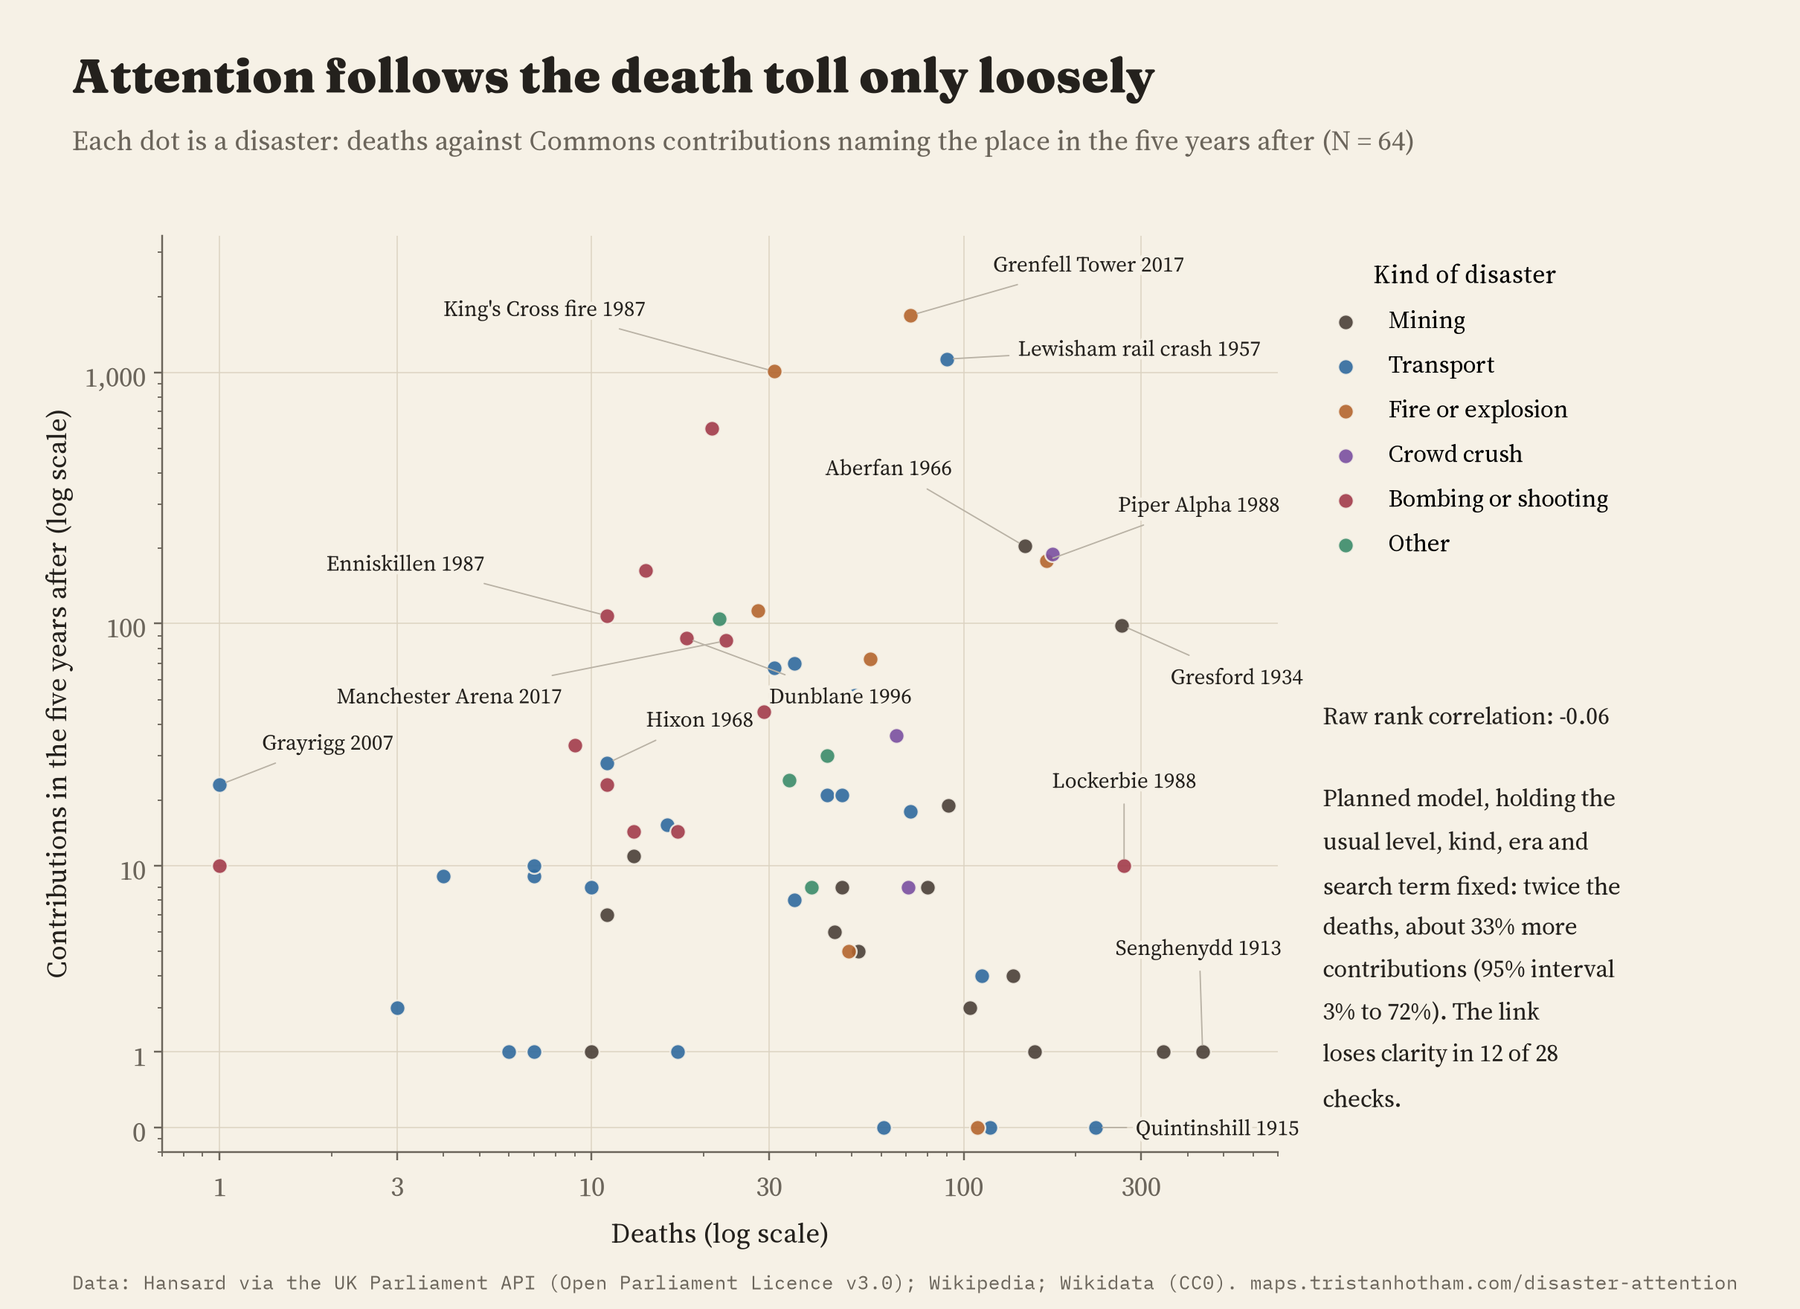
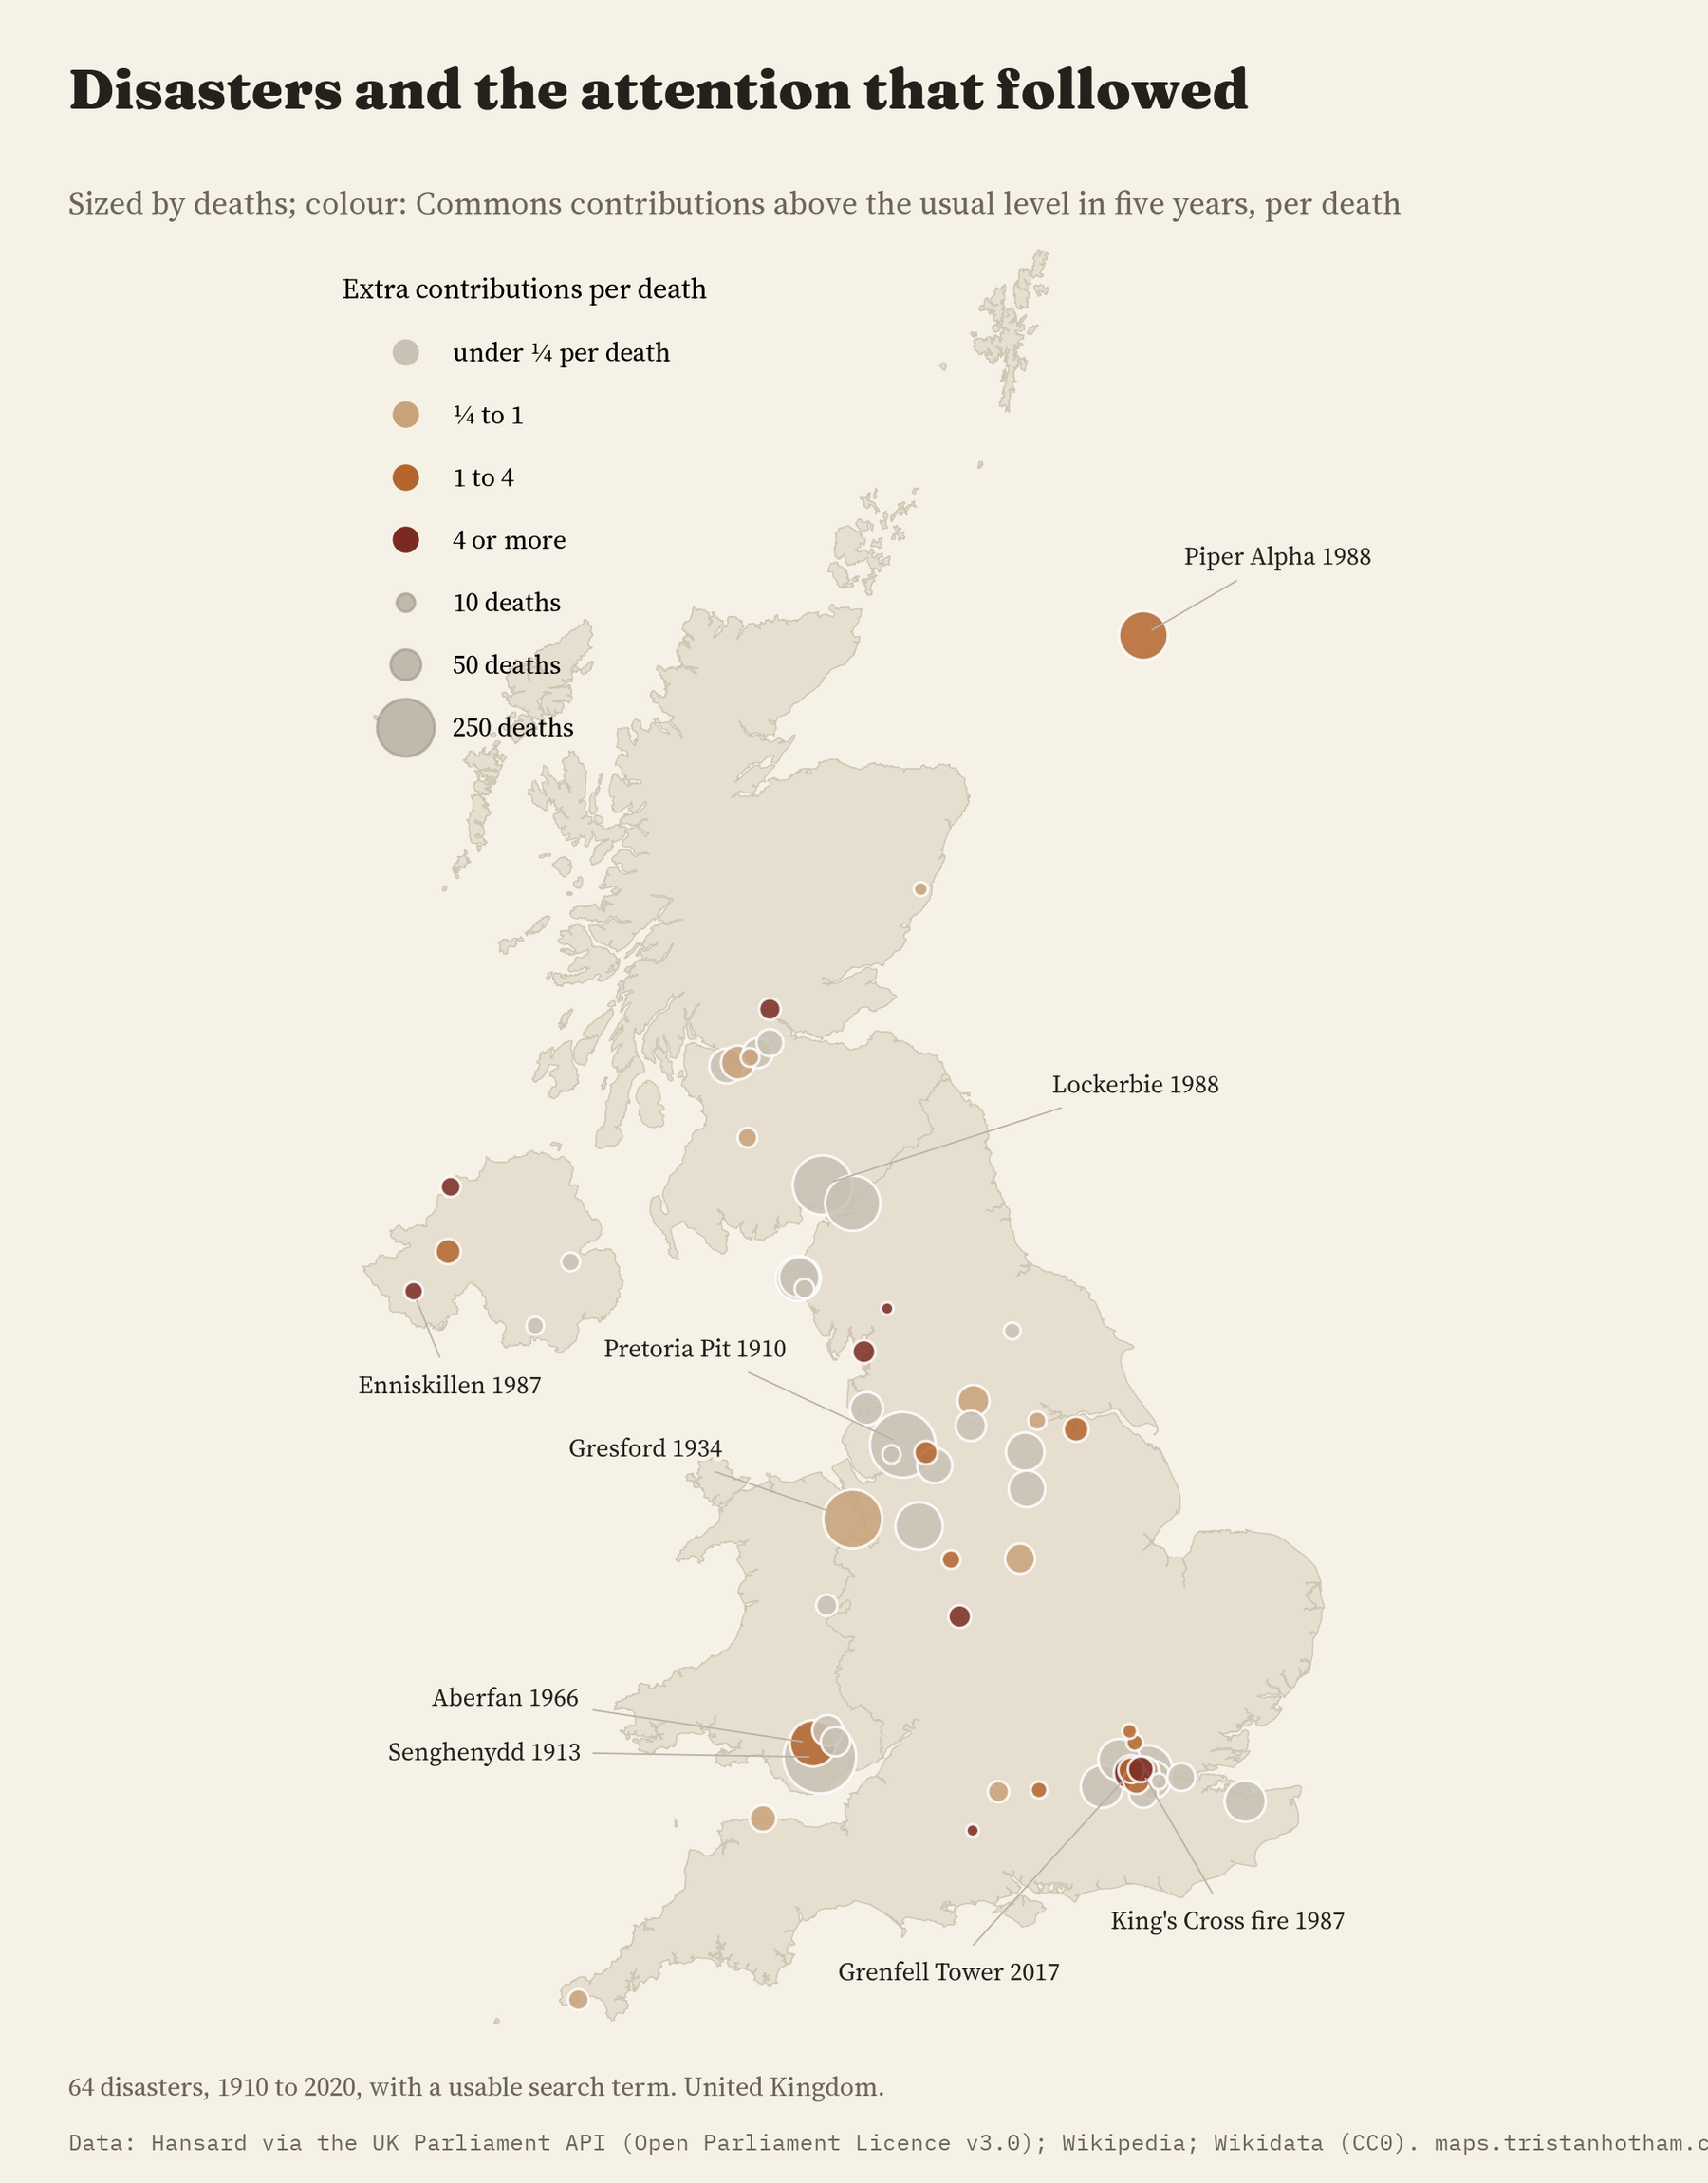
I expected disasters with more deaths to get more attention. Across all 64, there is almost no link at all (a rank correlation of -0.06). Some of the disasters with the most deaths left almost no trace in the searchable record. The explosion at Senghenydd in 1913, in which 439 people died, matches 1 contribution in the five years after; Quintinshill in 1915, with 226 deaths, matches 0. Part of that is the record itself: the oldest volumes of Hansard are harder to search, and reporting in wartime was restricted. At the other end, the Grayrigg derailment of 2007, in which one person died, came up in 22 contributions.
My planned model compares disasters with the same usual level of mentions, the same kind and the same era. In that model, twice the deaths goes with about 33% more attention over five years. That is far less than double, and it is not a firm result: the range includes no link in 12 of the 28 checks I planned, and when I shuffled the death tolls at random, a link at least as strong turned up in about 7% of tries. What the data do show clearly is that attention does not grow anything like in proportion to the number of lives lost.
After those first results, I found usable search words for 22 more disasters that I had to leave out at first, among them the Easington Colliery disaster of 1951, the explosions at Chilwell and Fauld and the Droppin Well bombing at Ballykelly. I added them under the same rules and ran the same models again. Because I did this after seeing the first results, I report both versions. With all 86 disasters, twice the deaths goes with about 44% more attention, and the shuffle test now finds a link that strong in under 1% of tries. So the link is a little clearer with the fuller list, but it is still not firm: the range includes no link in 10 of the 28 checks. The rise in the month of a disaster (11.1 times) hardly changes, and the fading holds up: half the extra attention came within a median of 5.5 months.
Parliament notices a disaster at once. How many people died explains surprisingly little of what follows.
Whose disaster?
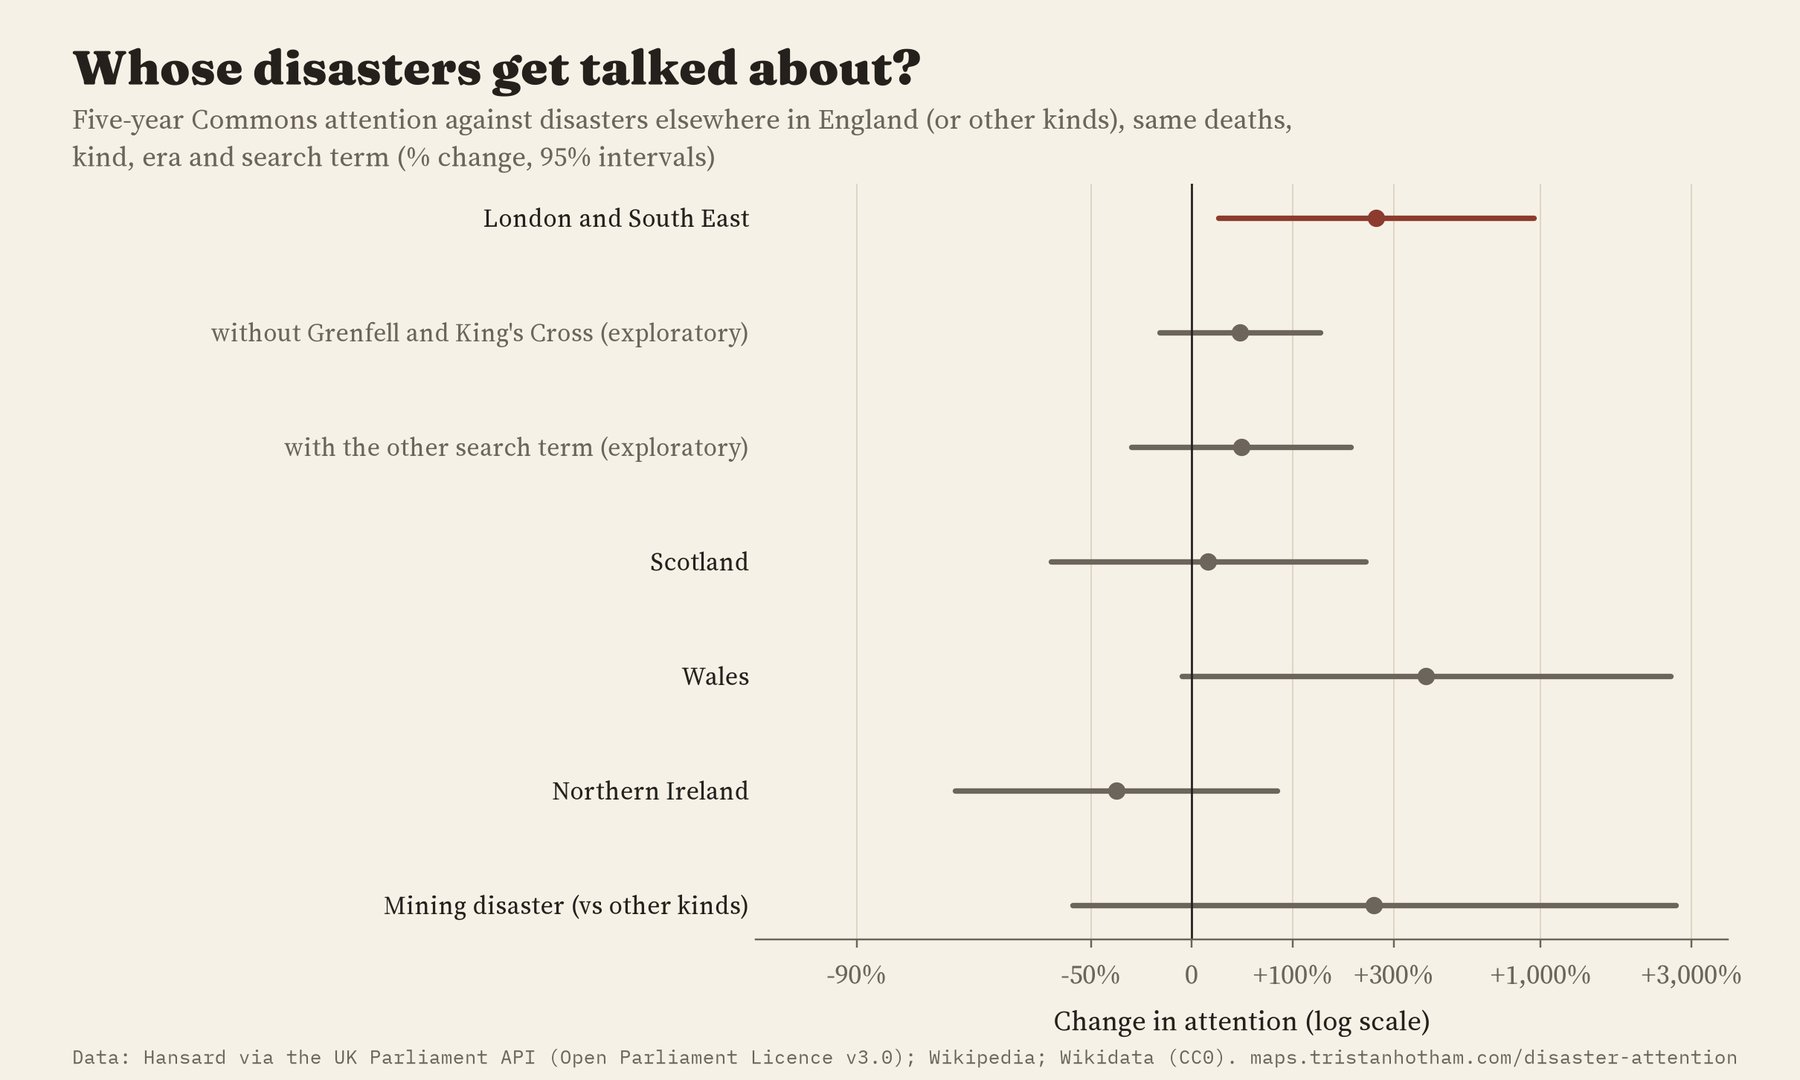
Are disasters near Westminster talked about more? In the planned model, disasters in London and the South East drew 3.5 times the attention of disasters elsewhere in England with the same deaths, kind and era. But that rests on two London disasters, Grenfell Tower and the King’s Cross fire. Leave both out, or count each disaster by its other common search word, and the gap shrinks to about 39%, too small to tell from no gap at all. Disasters in Scotland, Wales and Northern Ireland, and mining disasters, were not clearly treated differently. With only a few disasters in each group, I can’t rule out real differences, but there is no clear sign of them.
A list is already a memory
The most interesting thing I learned is about the sources. Any list of disasters is a record of what has been remembered. The Wikipedia list I started from keeps disasters with 40 or more deaths. Smaller ones are in my study only because Wikidata had them or because they were on a list of well-known disaster place names, and they are well known partly because of the attention that followed. That matters: among the 31 disasters on the Wikipedia list alone, attention rises much more steeply with the death toll.
The words matter too. MPs talk about “the Lockerbie bombing” more than about events “in Lockerbie”: the phrase “in Lockerbie” turns up 10 times in the five years after 1988, the word “Lockerbie” 239 times. Some names mean other things. Hillsborough is also a village in County Down where the 1985 Anglo-Irish Agreement was signed, so I left it out of the main analysis. And I found only after the results were in that “King’s Cross” was also debated for the Channel Tunnel railway terminal in the same years as the fire.
How I did this
I kept single, local disasters on UK soil since 1909 with at least one death, and left out pandemics, heatwaves, smogs, losses at sea and events abroad. Each disaster got one search word, chosen by a written rule: the name of the pit, station or village where there is one, otherwise “in” plus the town. I checked every word for other meanings. In the first version 39 candidates could not be used, most because no search word was available. After the later additions 13 remain, among them the 7 July 2005 bombings in London, where “7 July” is just a date and “in London” would tell us nothing; they are shown as rings on the map, with the reason. The disasters added later are marked on the map. The usual level is the average of the two years before, adjusted for how much Parliament was sitting. The main model is a Poisson regression, and the event study averages the month-by-month counts across disasters.
This counts words, not care. A single speech can matter more than a hundred, and most of the response to a disaster happens outside the chamber, in inquiries, courts and the communities themselves. It is a comparison across disasters, not an experiment.
Notes and sources
- Hansard, House of Commons spoken contributions per month, via the UK Parliament Hansard API. Contains Parliamentary information licensed under the Open Parliament Licence v3.0.
- Wikipedia, “List of disasters in Great Britain and Ireland by death toll” (CC BY-SA 4.0); death tolls of smaller disasters from their Wikipedia articles, checked by hand. Wikidata (CC0).
- Town points from my earlier study Mentioned in the House; ONS countries and regions (Open Government Licence v3.0).
- Further reading: Thomas Birkland, After Disaster (1997); Anthony Downs, “Up and down with ecology: the issue-attention cycle” (1972); Iain McLean and Martin Johnes, Aberfan: Government and Disasters (2000).
- I wrote the text, with drafting and editing assistance from Claude (Anthropic), which also helped prepare the analysis code. I reviewed and checked all text and results.

