
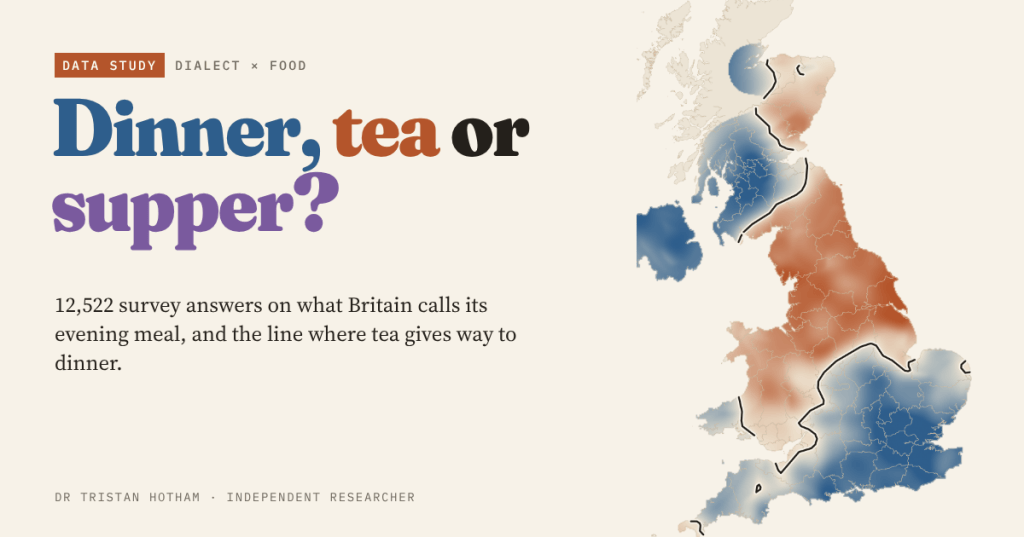
Is it dinner, tea or supper? I mapped 12,522 answers from a dialect survey to find the line where Britain’s evening meal changes its name, and to see whether dinner is taking over. It is not, at least not in the north.
“What’s for tea?” is one of those questions that tells you where someone grew up before they have finished asking it. In Lancashire it means the evening meal. In Surrey it might mean a cup and a biscuit. Britain has three words for the last proper meal of the day, and people feel strongly about all of them.
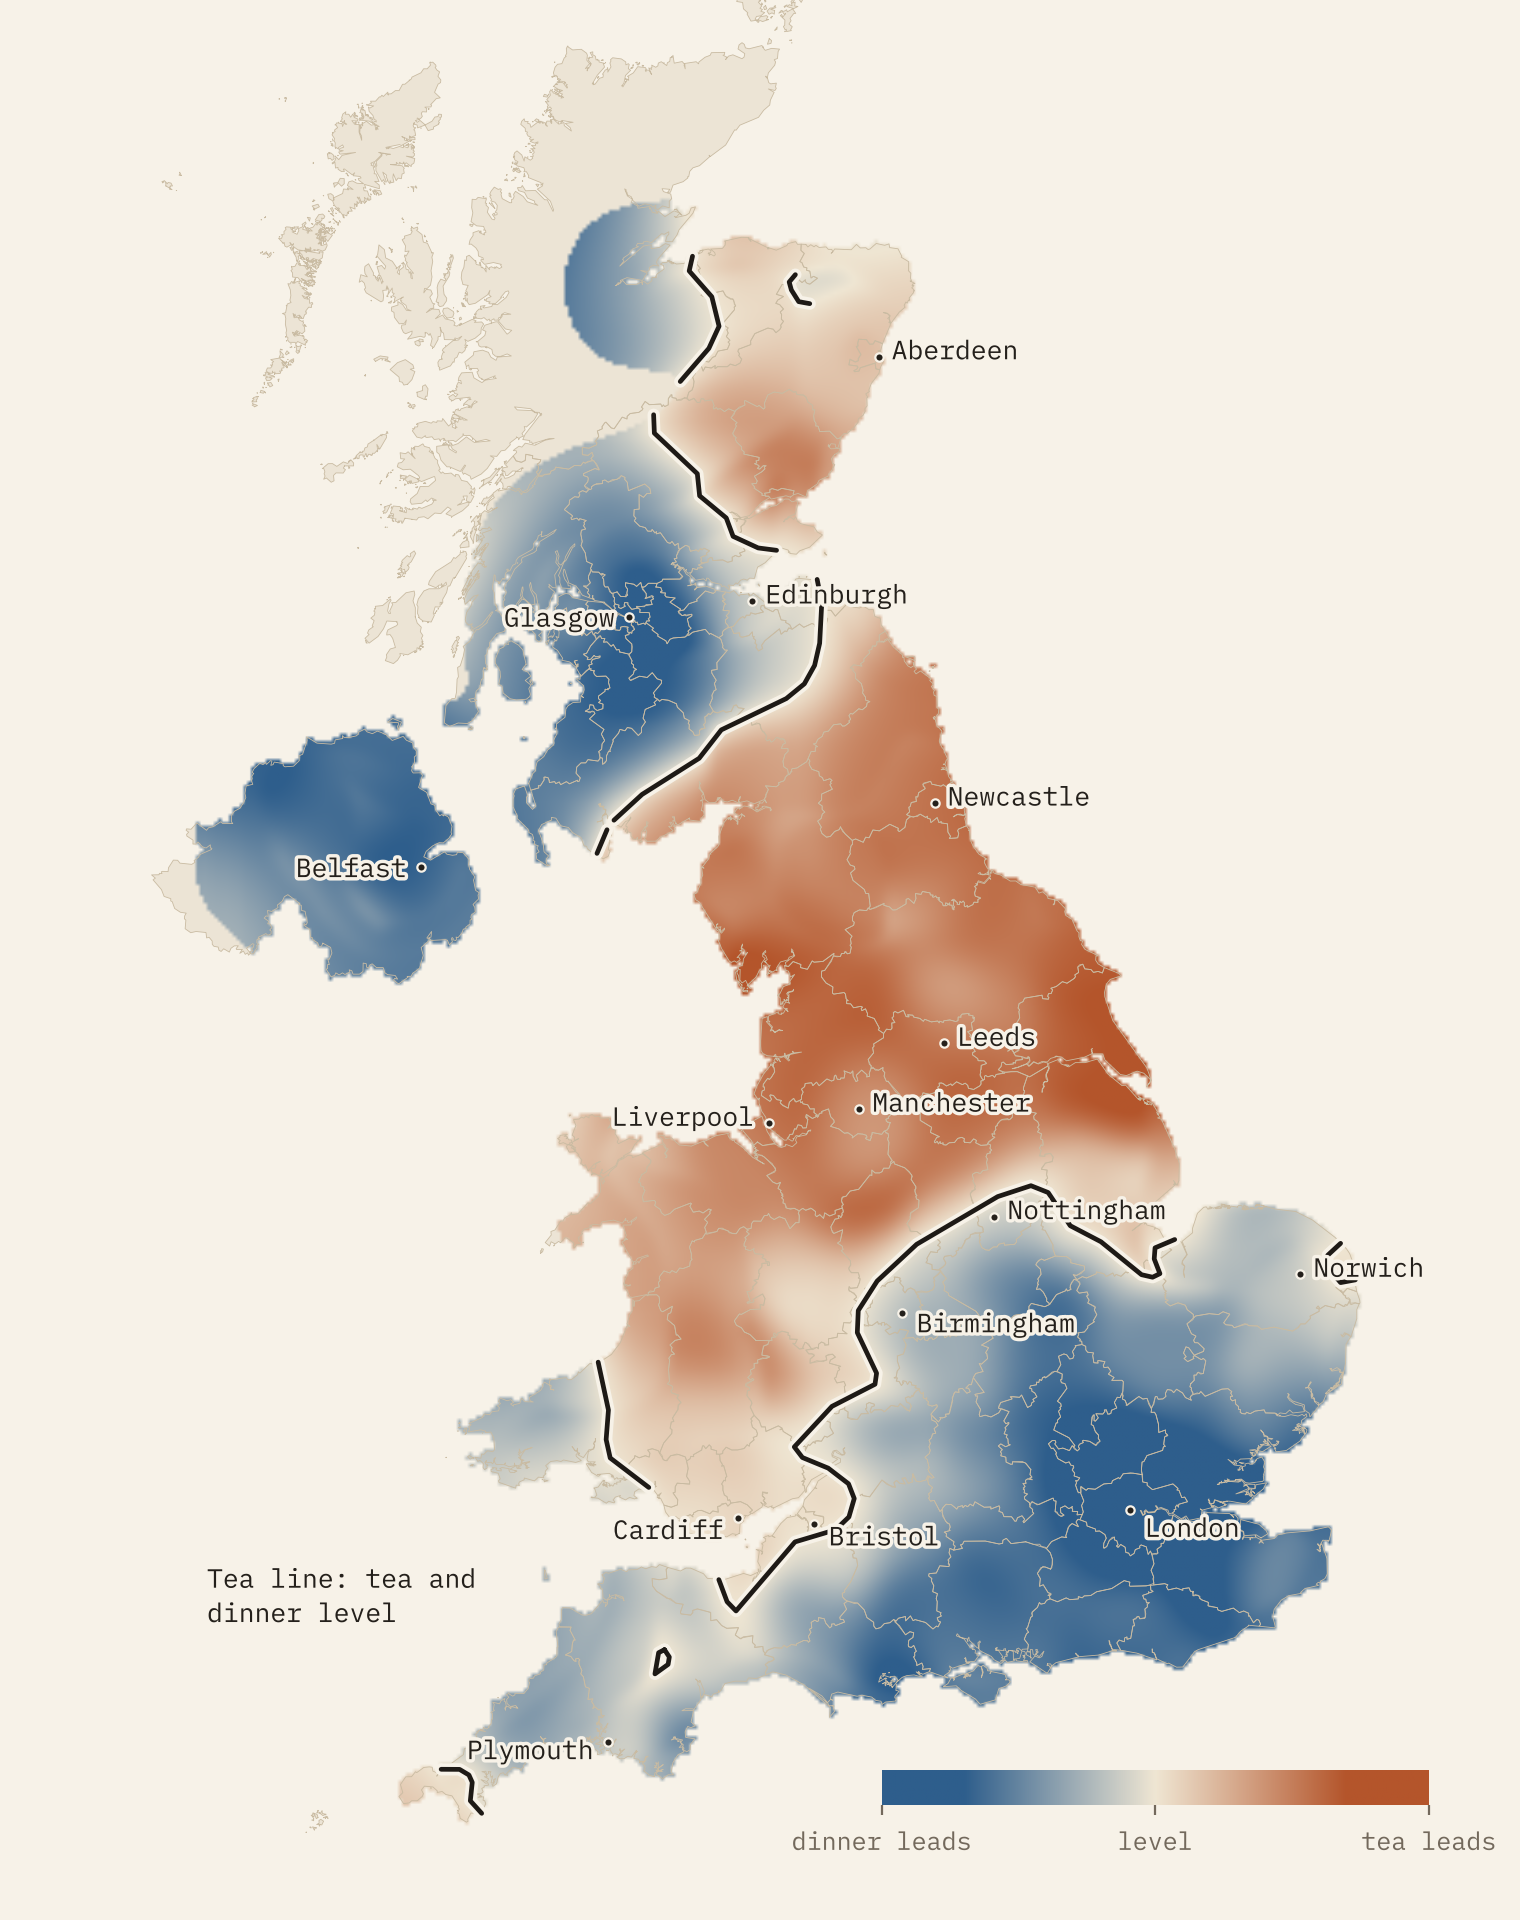
The Our Dialects project at the University of Manchester has been asking people the question since 2013, with three options: dinner, tea or supper. Its public map holds 12,555 answers, each placed at a postcode district, with the person’s age and the year they answered. I smoothed them into a map, drew the line where tea and dinner are level, and tested what predicts the word.
North of the line, it is tea
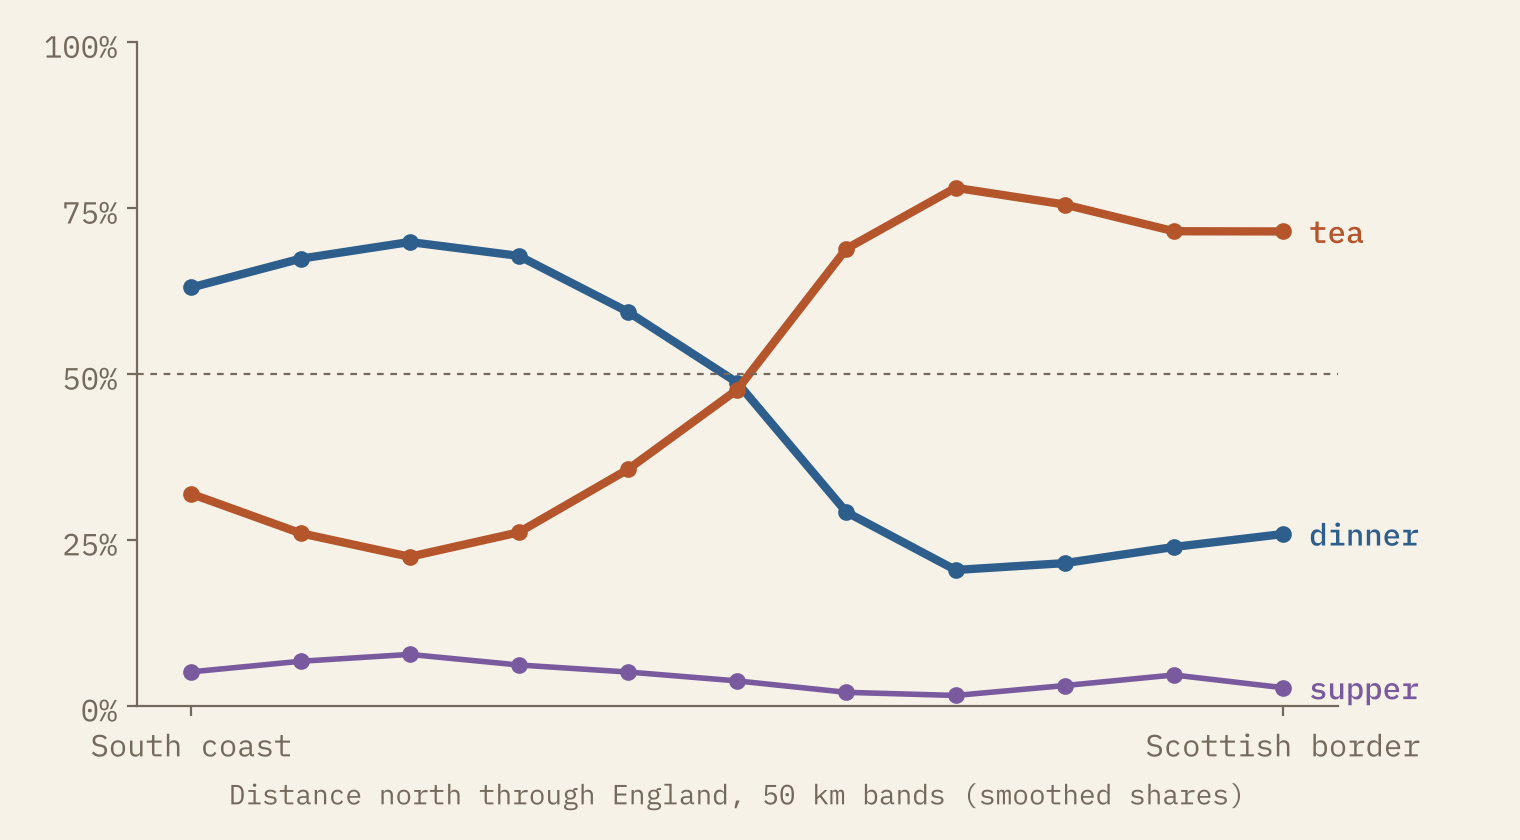
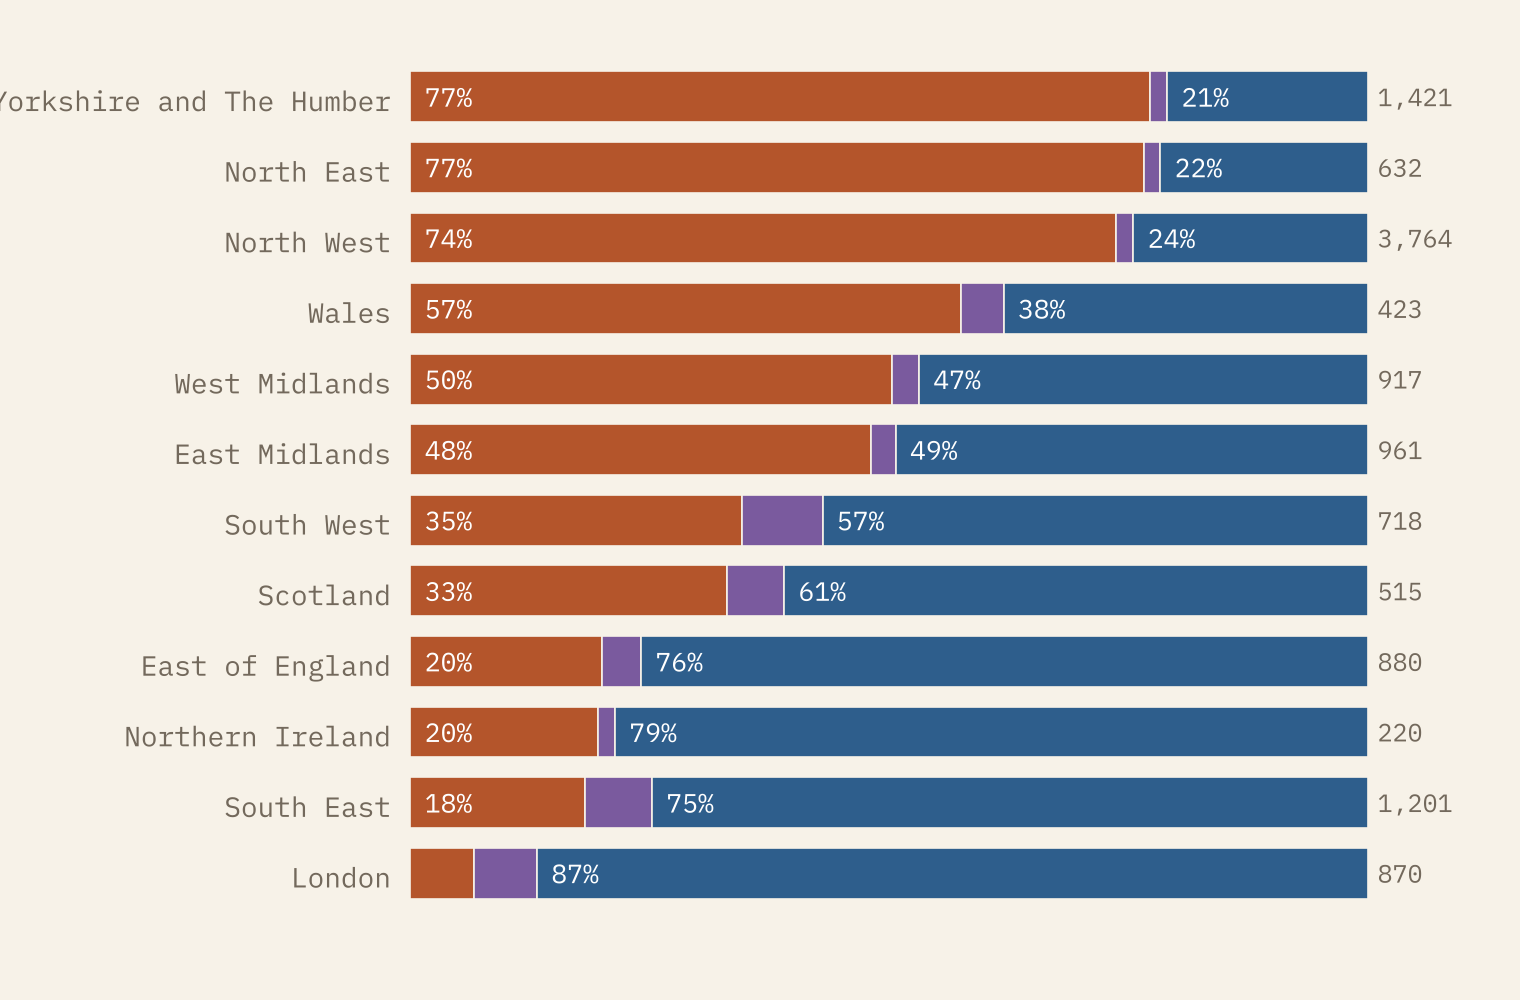
The split is about as clean as British dialect gets. In the three northern regions of England, 75% of 5,817 answers say tea. In London, the South East, the East and the South West, 74% of 3,669 say dinner. The Midlands are the borderland, split almost exactly in half: 49% tea, 48% dinner.
The tea line runs north from the Severn estuary past Gloucester and Worcester, swings round Birmingham, which is just on the dinner side, and heads east past Derby and Nottingham to the Wash. Wales is mostly tea (57%). Northern Ireland is dinner (79%), and so is most of Scotland (61%), with Glasgow firmly dinner and the east closer to an even split. The most tea counties are the East Riding of Yorkshire and Lancashire (80% of 846 answers); the least is London, at 7%.
It is really an argument about dinner
In the old pattern, still very much alive in the north, dinner is the main meal of the day and it is eaten at midday. That is why there are dinner ladies and dinner money. The evening meal is tea, the cooked meal when people get home from work, and supper is a snack before bed. Around Clitheroe in Lancashire, for example, people eat dinner at noon and tea at six. The southern pattern, with lunch at midday and dinner moved to the evening, began with the well off and spread. The Oxford English Dictionary even says so: tea is a light meal in the late afternoon, “but locally in the U.K. (esp. northern) … a cooked evening meal”.
One honest caveat. The survey only asks about the evening meal. It cannot show the midday dinner, so that half of the story comes from dictionaries and the literature, not from this data. What it can show is that in the Ribble Valley, 73% of 55 people call the evening meal tea.
Is dinner taking over?
If dinner were taking over, younger people would say it more. In the north, they do not. Younger people do say dinner more often than older people, but only in the south and, less so, the Midlands. In the south, 79% of 18 to 24 year olds say dinner, against 57% of people aged 50 to 64: in a logistic regression the odds of dinner fall by a factor of 0.79 for every ten years of age (p < 0.001). In the north there is no slope at all: 24% of 18 to 24 year olds and 21% of 50 to 64 year olds say dinner (p = 0.22).
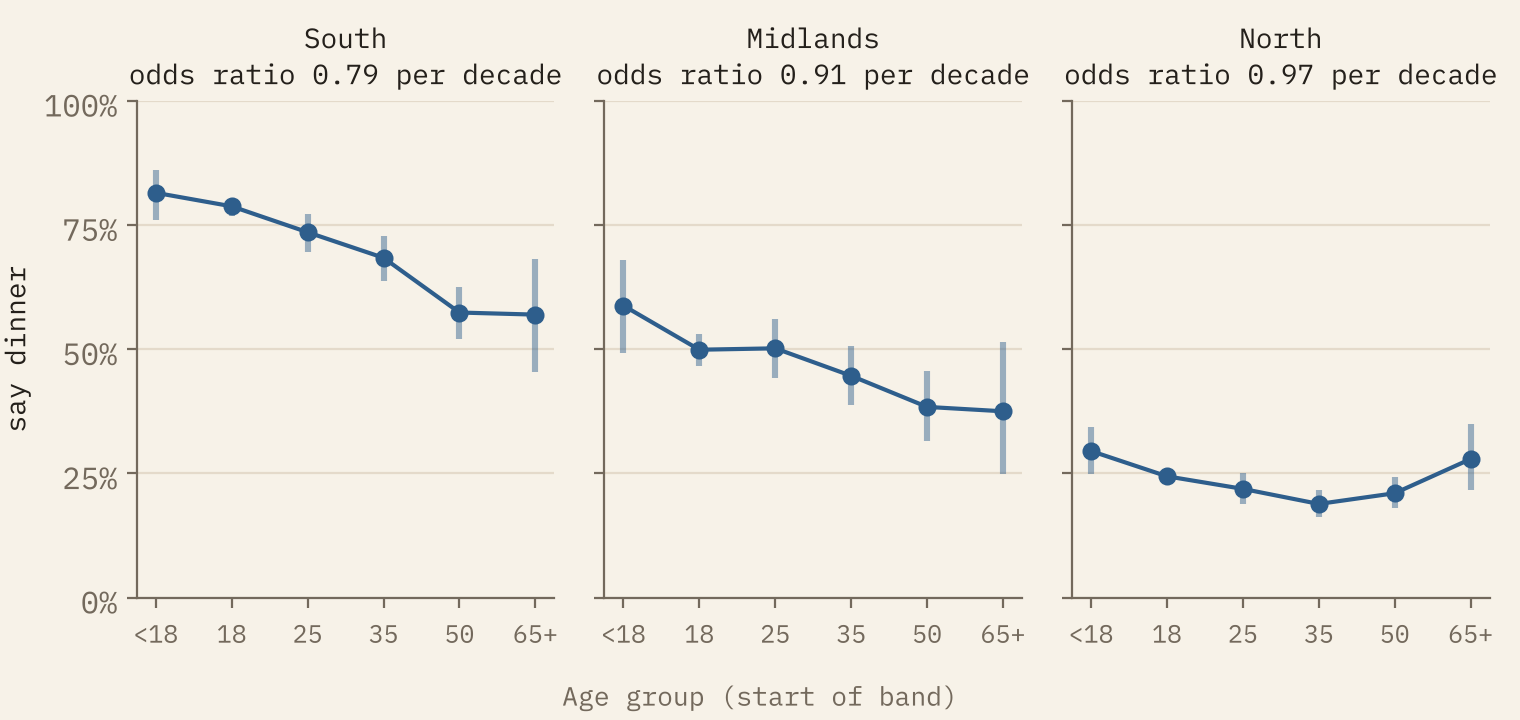
An age gap is not proof of change, so I also looked at the twelve years of the survey. Reweighted to the same mix of places and ages every year, dinner’s share wanders between 41% and 50% with no upward trend. If dinner is spreading, it is spreading within the south, not across the tea line. Gender makes no difference at all: 52% of women and 52% of men say tea.
Northern teenagers say tea just as often as their grandparents do.
Supper, for the over 65s
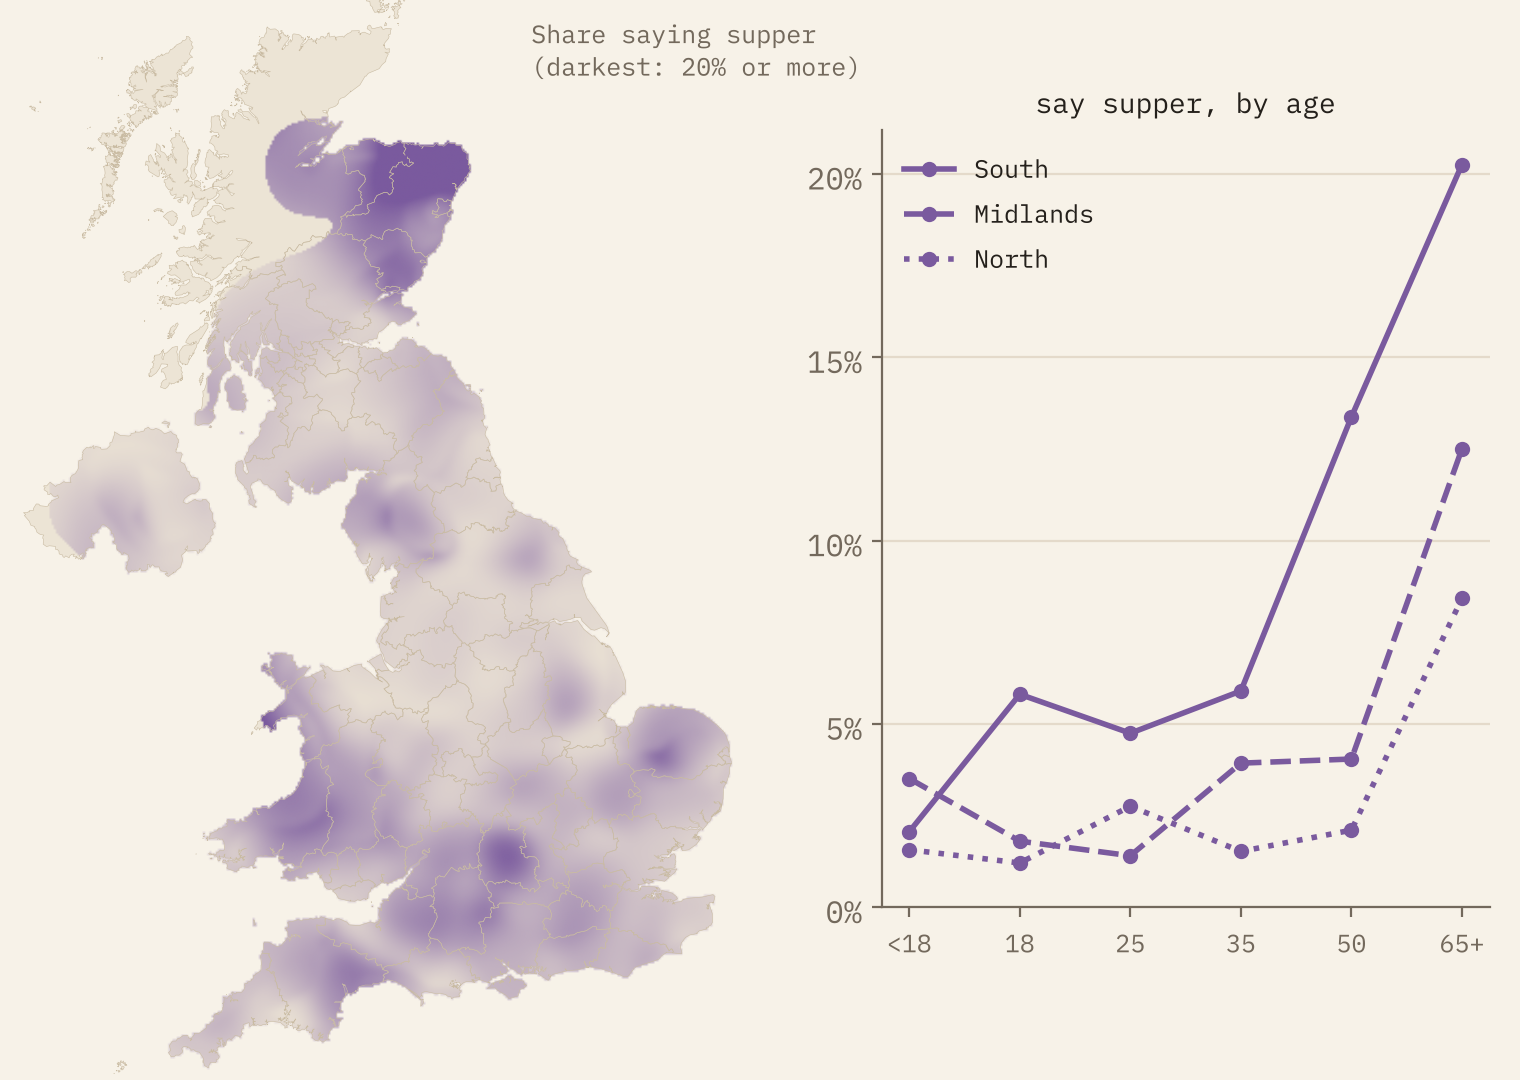
Supper is the minority word: 3.6% of answers. It is a southern word and an older one. Among southerners aged 65 and over, 20% say supper, against 6% of 18 to 24 year olds. It leads the map in just one place, a small patch of Aberdeenshire.
Does it agree with YouGov?
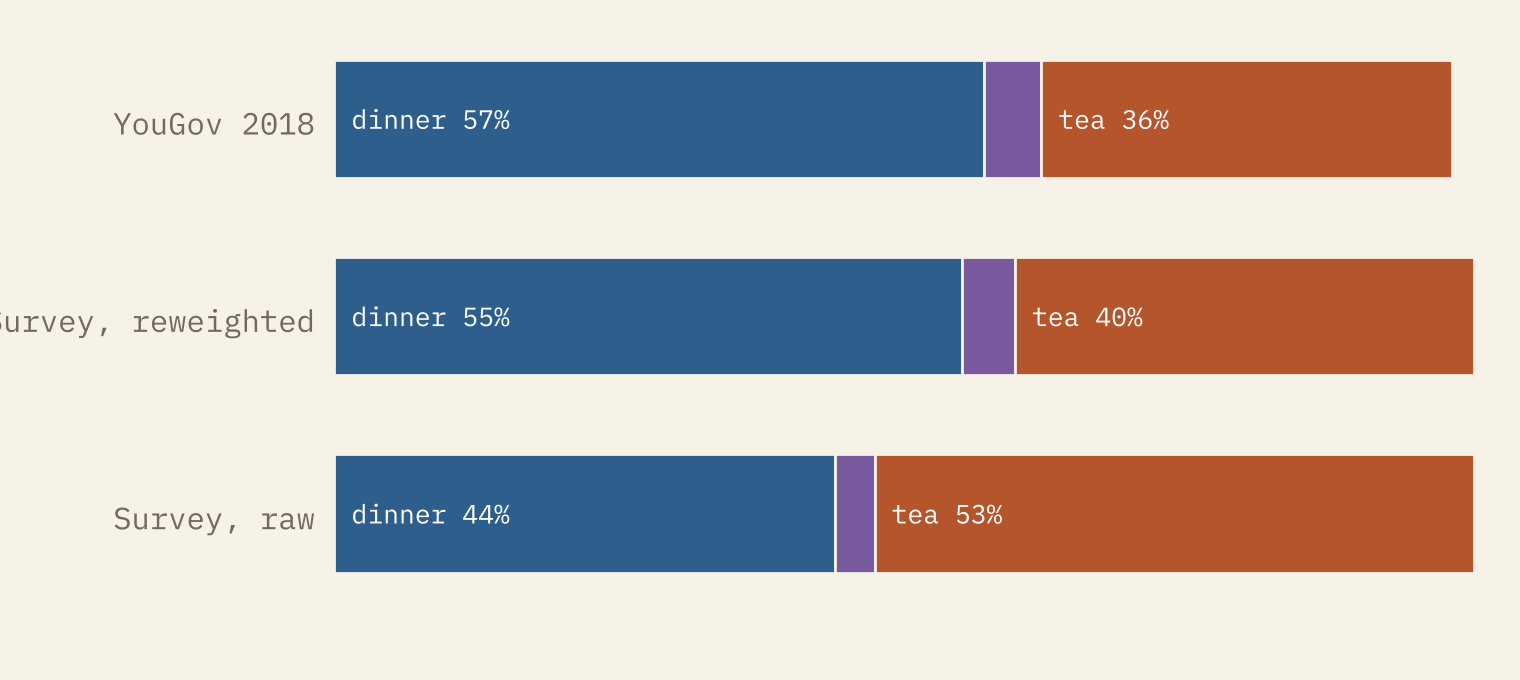
The survey is run from Manchester and is very northern: a third of the answers from England (33%) come from the North West, which has 13% of England’s people. Taken raw, English answers are 53% tea. In 2018 YouGov asked more than 42,000 adults in England and found 57% dinner, 36% tea and 5% supper. When I reweight the survey’s adult answers to each region’s share of the population, it gives 55% dinner, 40% tea and 5% supper. Two very different surveys, the same answer.
The interactive version has a search box: type a town, village or postcode district and it tells you what people say there, with the county figures and, where there are enough answers, the postcode district’s own count.
How I did this
I read the 12,555 answers from the Our Dialects meal map in 2026, left out 33 from the Channel Islands and the Isle of Man, and counted the rest on a 2 km grid. I smoothed them with a Gaussian kernel 16 km wide, the width that best predicted each answer from its neighbours, widened up to 32 km where answers are sparse, and left the map blank where fewer than ten answers are nearby. The tea line is where the smoothed shares of tea and dinner are equal. The age, year and gender results come from logistic regressions that also allow for region. The paper sets out every step.
The caveats matter. This is a volunteer survey, not a random sample: young, northern and keen on dialect. It asks one question about one meal, and people who use two words must pick one. The answers belong to Our Dialects and are not openly licensed, so I publish only counts for areas with at least ten answers and the smoothed maps, never individual answers.
The companion study of bread rolls, from the same survey, is here: Barm, bap, cob or roll?
Notes and sources
- Survey answers: Our Dialects meal map, © the Our Dialects project, University of Manchester. Used for aggregate analysis with credit; individual answers not republished.
- YouGov (2018), Dinner time or tea time? It depends where you live. Published figures quoted.
- Oxford English Dictionary (2013), “tea, n.”. MacKenzie, Bailey and Turton, Towards an updated dialect atlas of British English. Kate Fox (2004), Watching the English.
- Boundaries and regional populations (Census 2021): Office for National Statistics, Open Government Licence v3.0, contains OS data © Crown copyright and database right 2026. Place names for the search: OS Open Names (OGL v3.0) and GeoNames (CC BY 4.0).
- I wrote the text, with drafting and editing assistance from Claude (Anthropic), which also helped prepare the analysis code. I reviewed and checked all text and results.

