
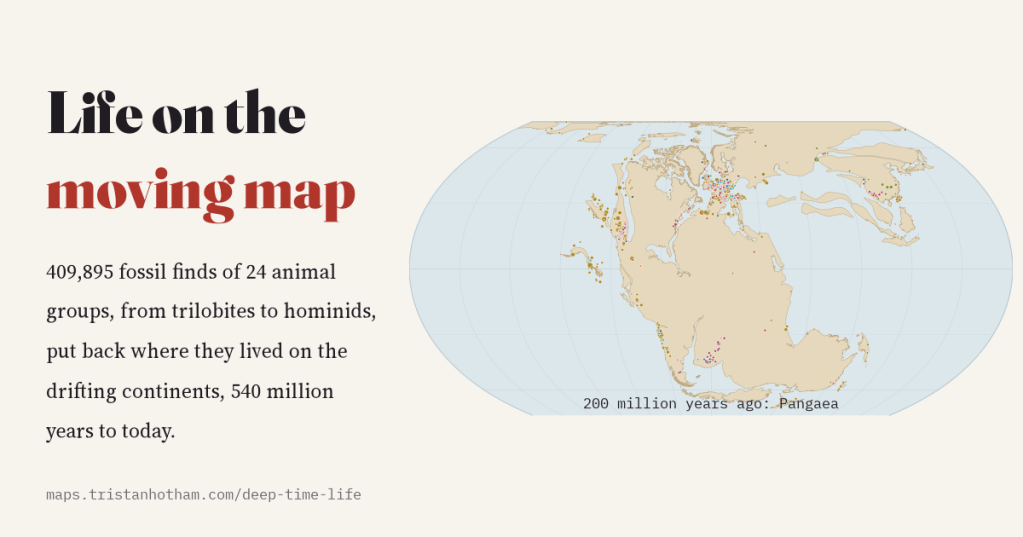
Every fossil has two addresses: where it was dug up, and where the animal actually lived. I put 409,895 fossil finds, from trilobites to dinosaurs to our own family, back where they lived, on a map of the drifting continents that runs from 540 million years ago to today.
A Tyrannosaurus found in Montana did not live in Montana, at least not in the Montana we know. Sixty-eight million years ago that patch of ground lay about 7 degrees further north, near the shore of a shallow sea that cut North America in two. Go back further and the shifts get dramatic. The fossils found in Britain tell the story: its Silurian sea creatures lived about 23 degrees south of the equator, the animals of its coal swamps, 300 to 320 million years ago, lived on the equator itself, and its early dinosaurs and ichthyosaurs at about 38 degrees north, the latitude of the Mediterranean today.
The Paleobiology Database, an enormous shared catalogue built up over decades by hundreds of palaeontologists, records both addresses for most fossil collections. Using the PALEOMAP plate model of Christopher Scotese, it works out where each collection was at the time its rocks were laid down. I took the records of 24 animal groups that people ask about (trilobites, sea scorpions, armoured fish, ammonites, sharks, insects, early amphibians, the mammals’ forerunners, marine reptiles, pterosaurs, dinosaurs, crocodiles, turtles, birds, mammals, whales, elephants and hominids) and drew them on PALEOMAP’s continents for 66 moments in time.
Watching Pangaea come and go
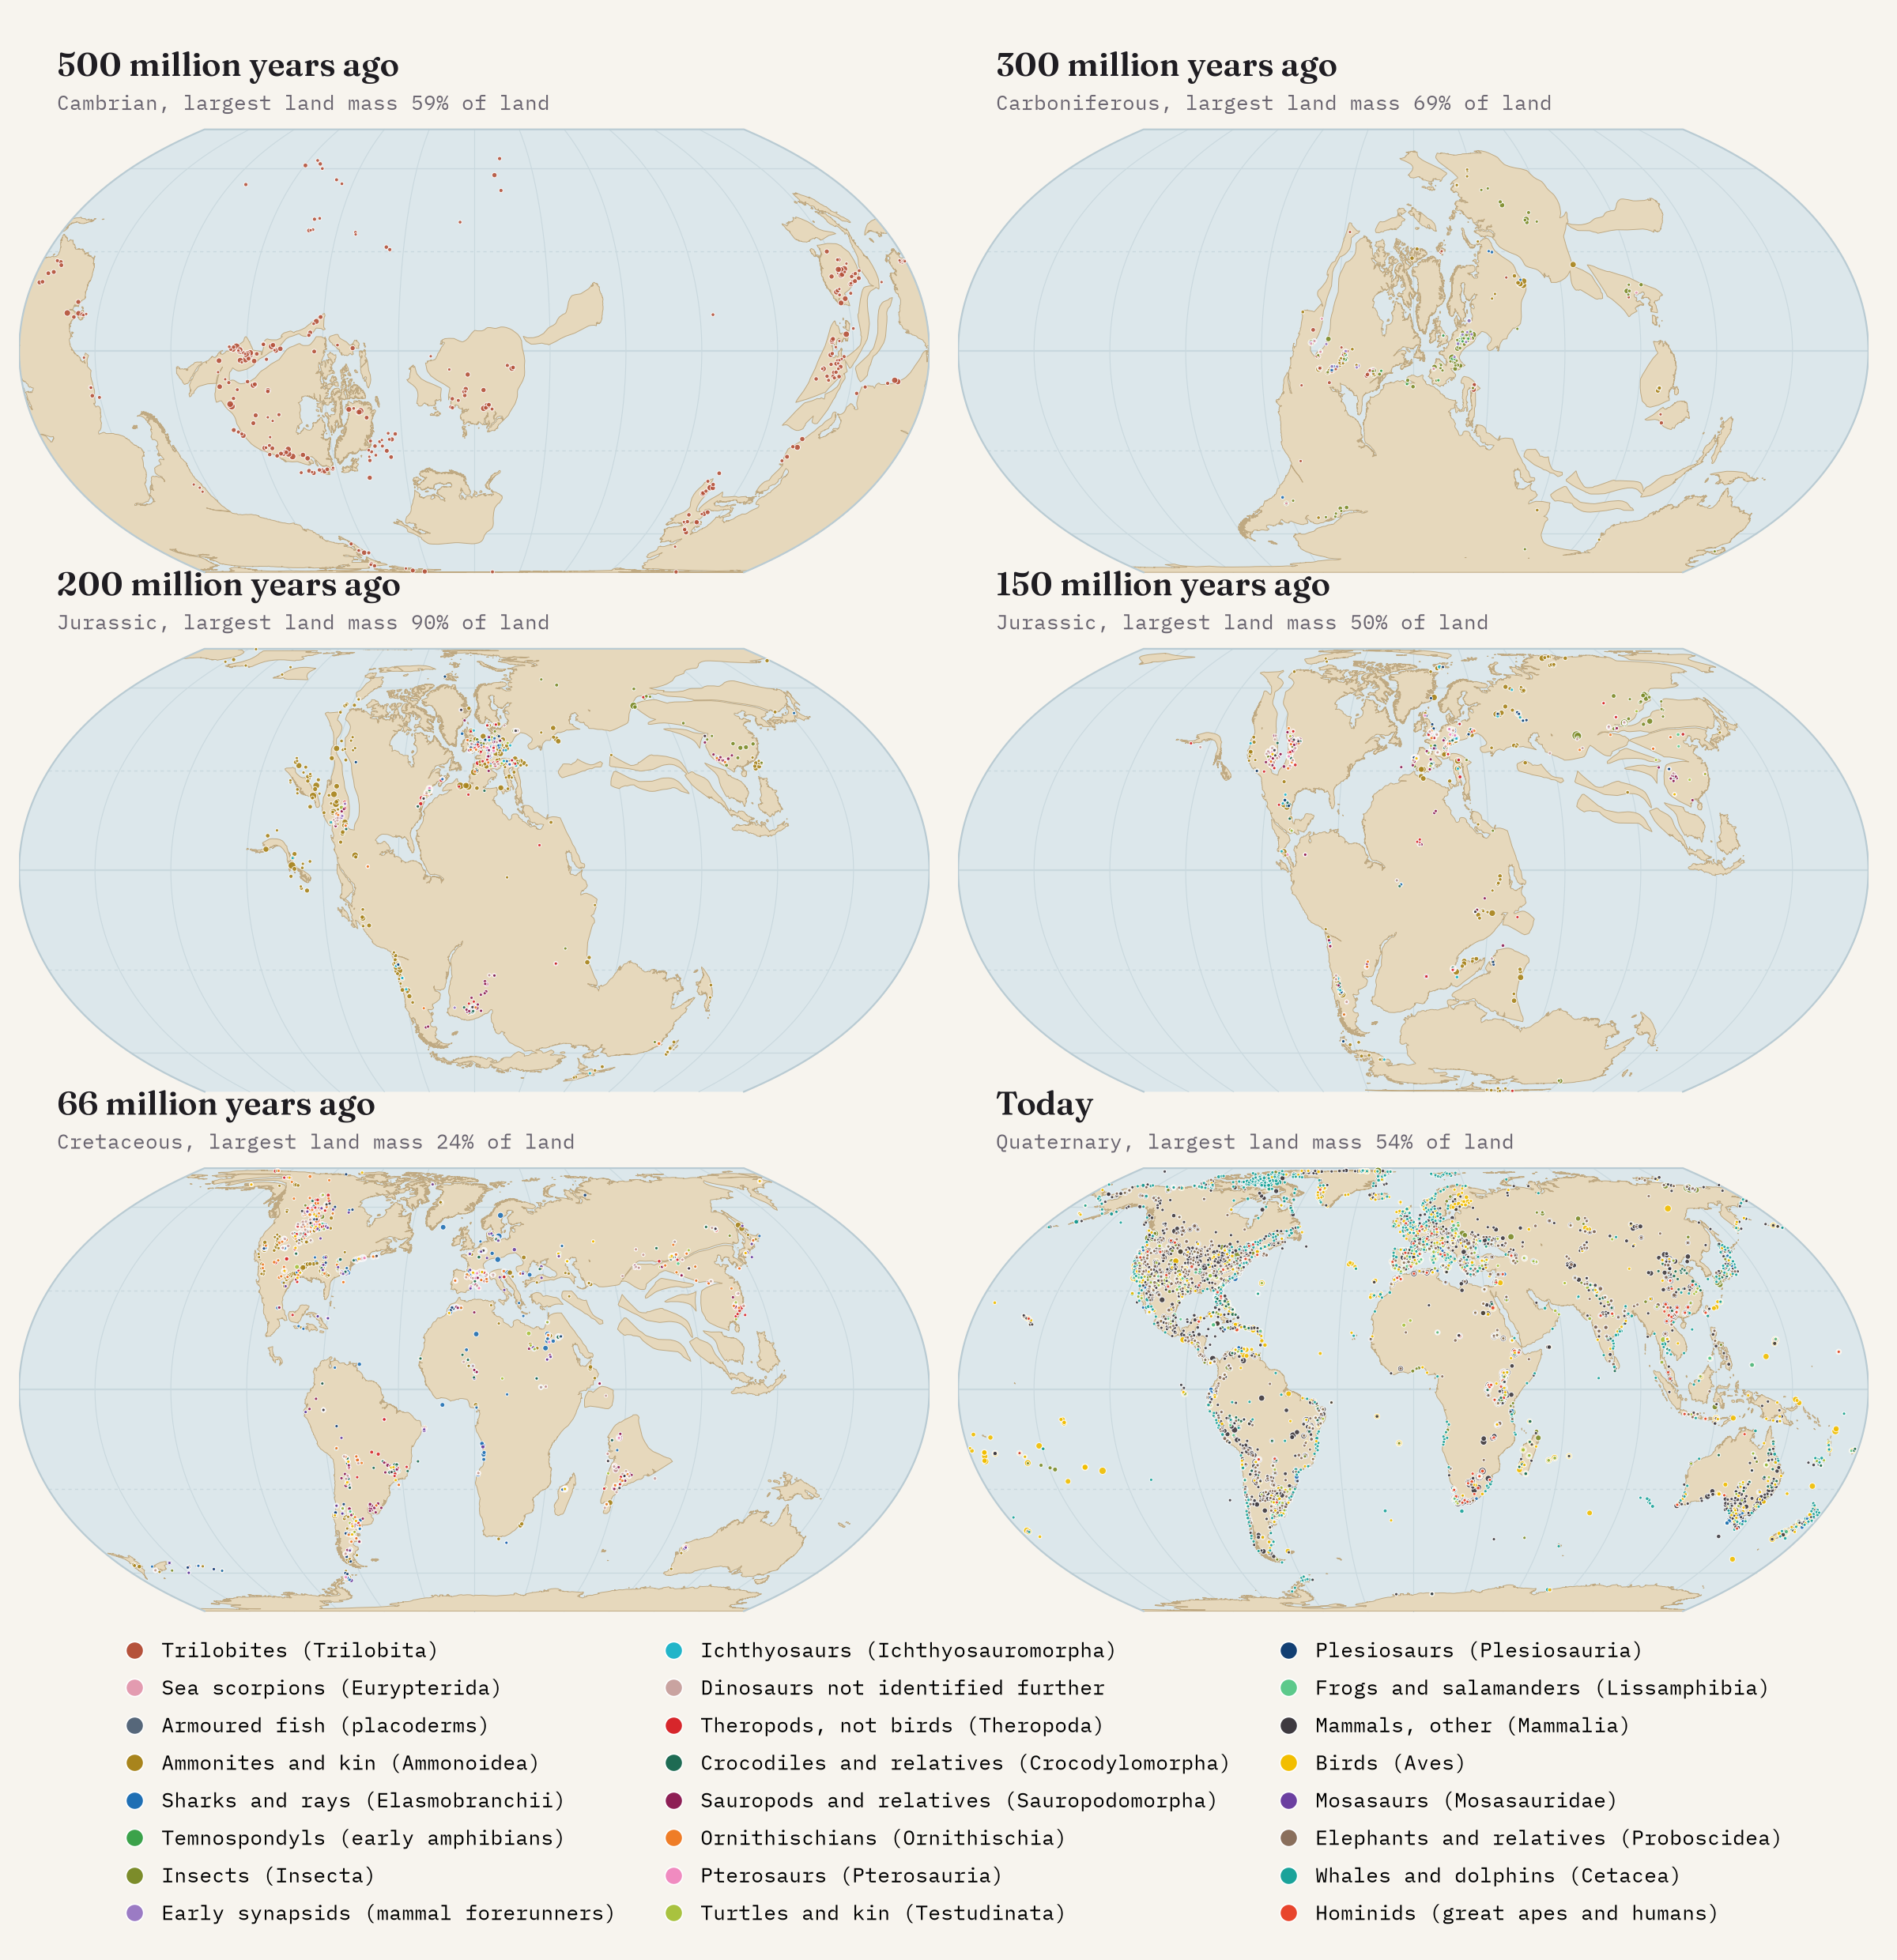
Press play on the interactive map and the continents drift past like slow weather. For the first half of the story they are scattered, with the giant southern continent of Gondwana lying across the South Pole. Then they converge, and by the Permian almost everything is jammed together into Pangaea. To put a number on it I measured how much of the land was joined into a single block at each moment. By 270 million years ago it was 88%, and it stayed above 85% for 90 million years, peaking at 90% around 180 million years ago. Then the supercontinent broke apart quickly: 50% by 150 million years ago, 23% by 100. Today the biggest block, Africa joined to Eurasia, holds 54%.
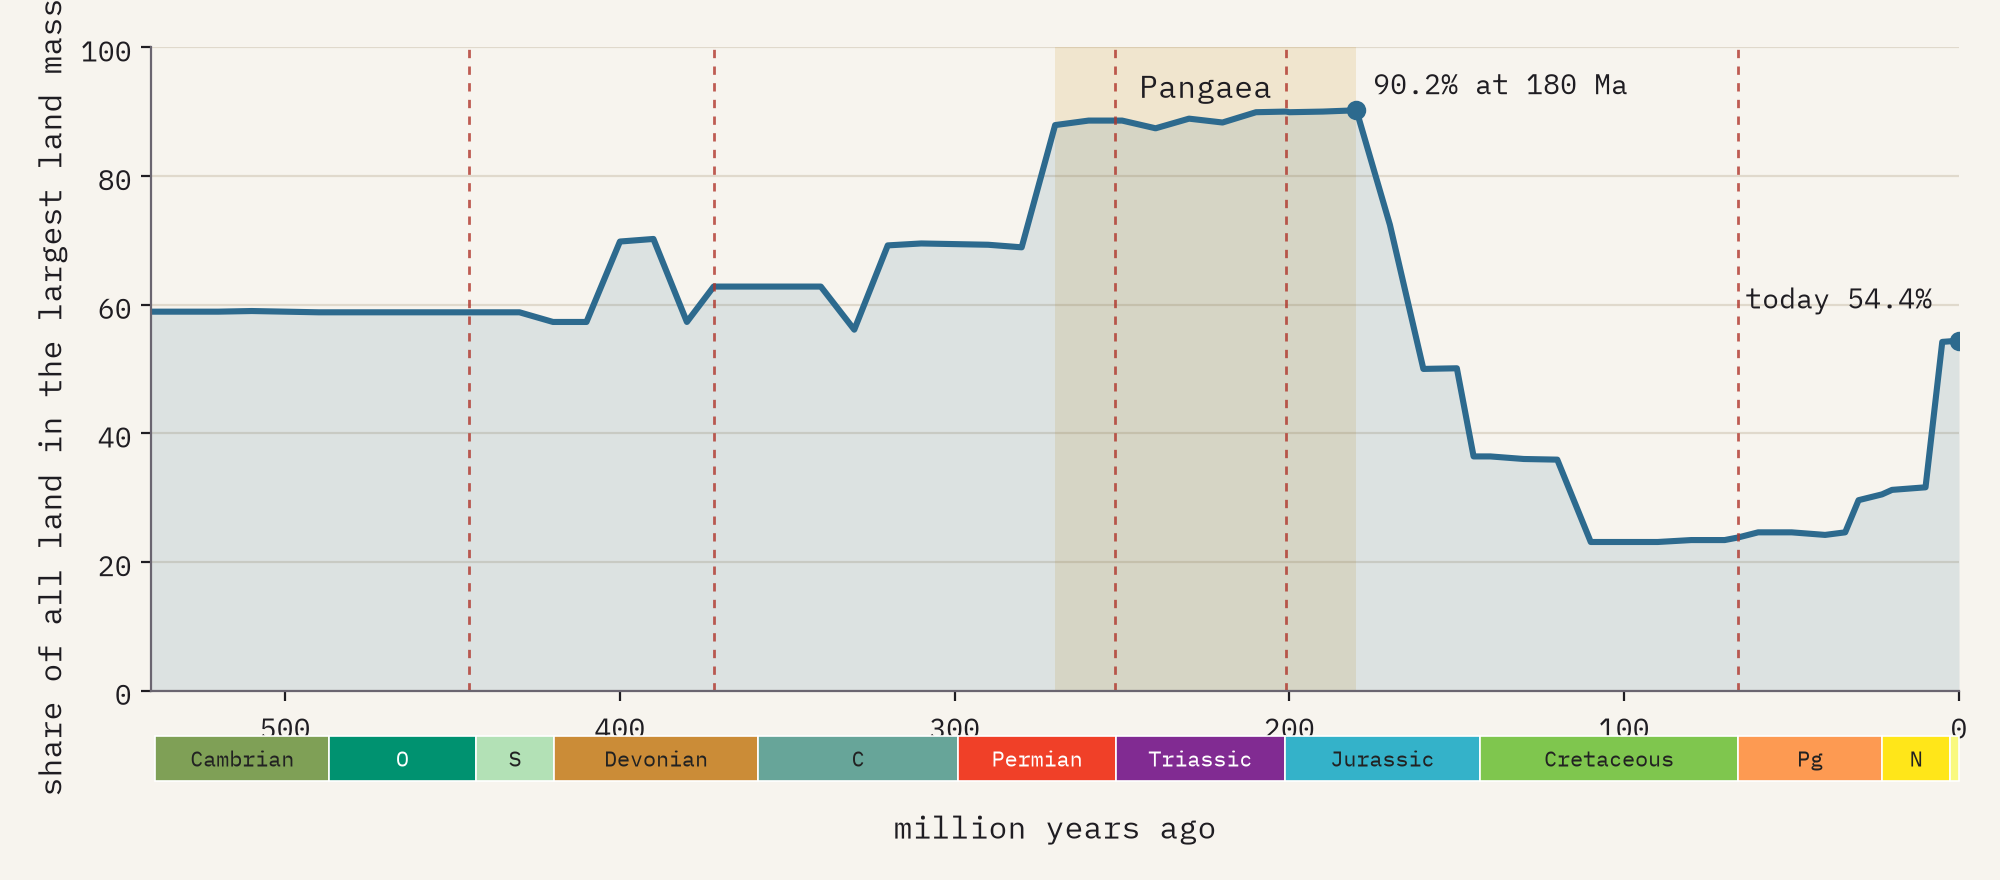
A caution: the outlines are today’s coastlines and continental blocks carried back in time by the plate model, not the ancient shorelines. Seas rose and fell by hundreds of metres, and at times flooded much of the continents, so plenty of ‘land’ on the map was really shallow sea. That is exactly where many of the oldest fossils formed.
Who ruled when
Counting fossils is not counting animals, so I asked a simpler question of each group: when was it most diverse in the record? Lay those answers side by side and the familiar parade of life appears. Trilobites lead the early seas, making up 57% of all genera from the Paleozoic era in these groups. Armoured fish have their Devonian moment. Early amphibians and the mammals’ forerunners flourish in the Permian and Triassic. Then come the marine reptiles and the dinosaurs, and finally the mammals, whales, elephants and hominids.
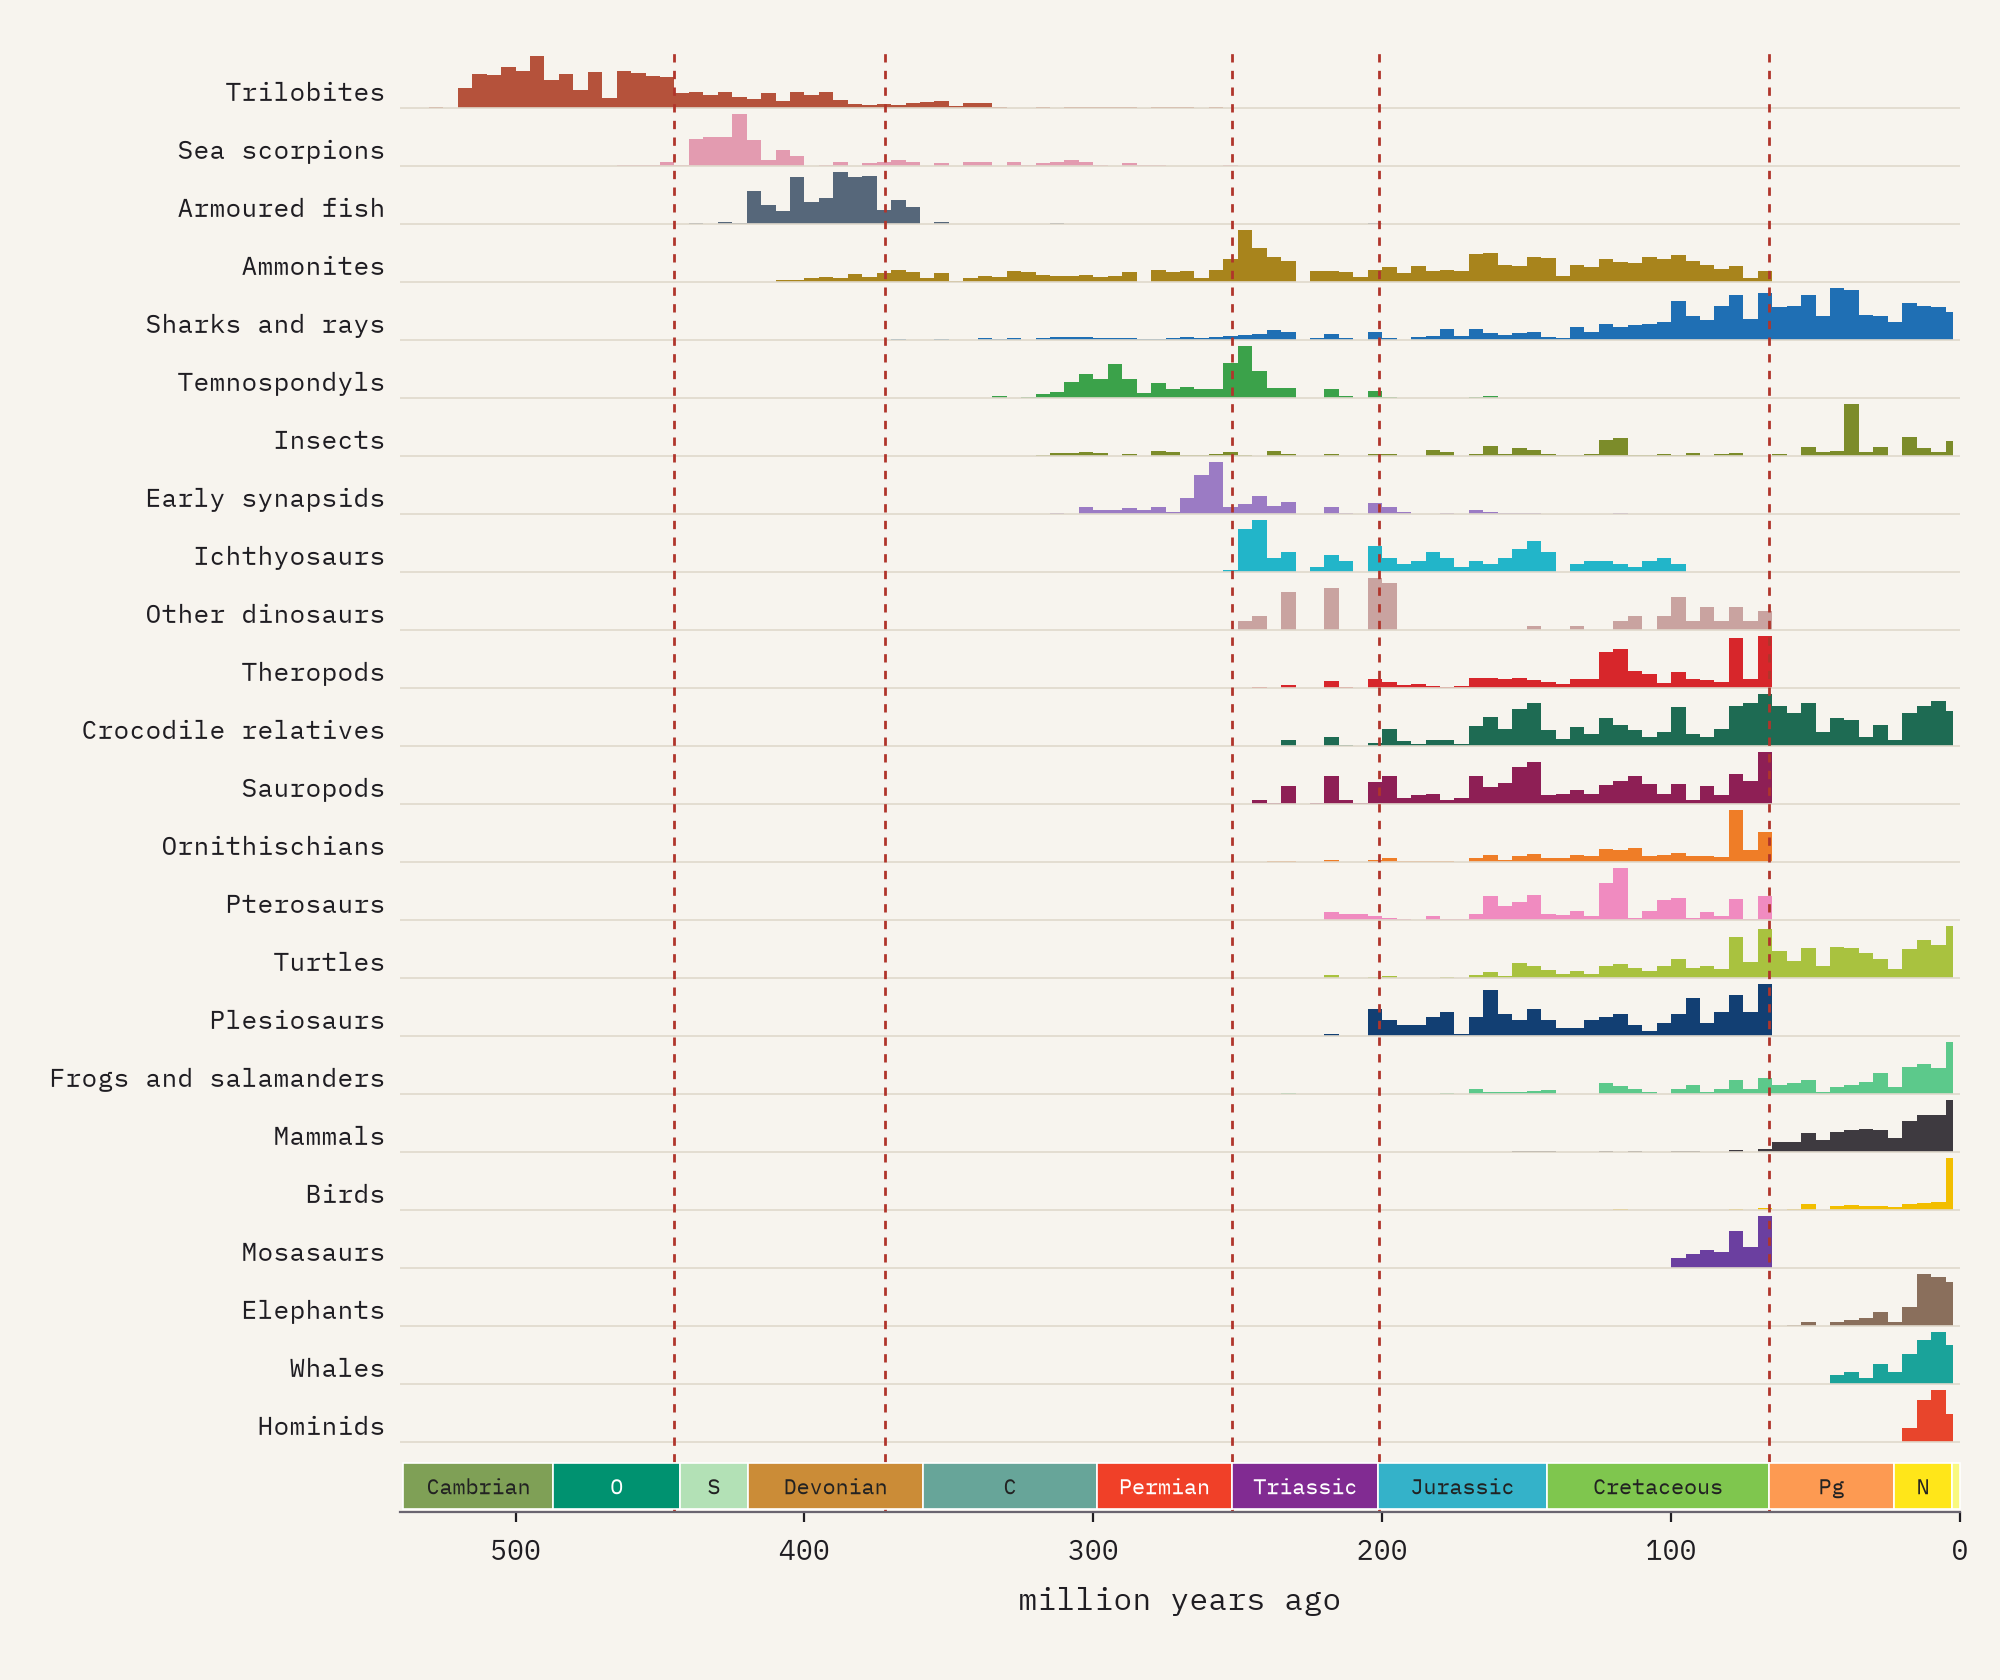
One surprise: in the Mesozoic, the age of dinosaurs, the group with the most genera in this data is not the dinosaurs but the insects (42%). They are absurdly diverse, and a quarter of all insect finds come from just 50 extraordinary collections where delicate bodies were preserved.
Dinosaurs on one continent, then many
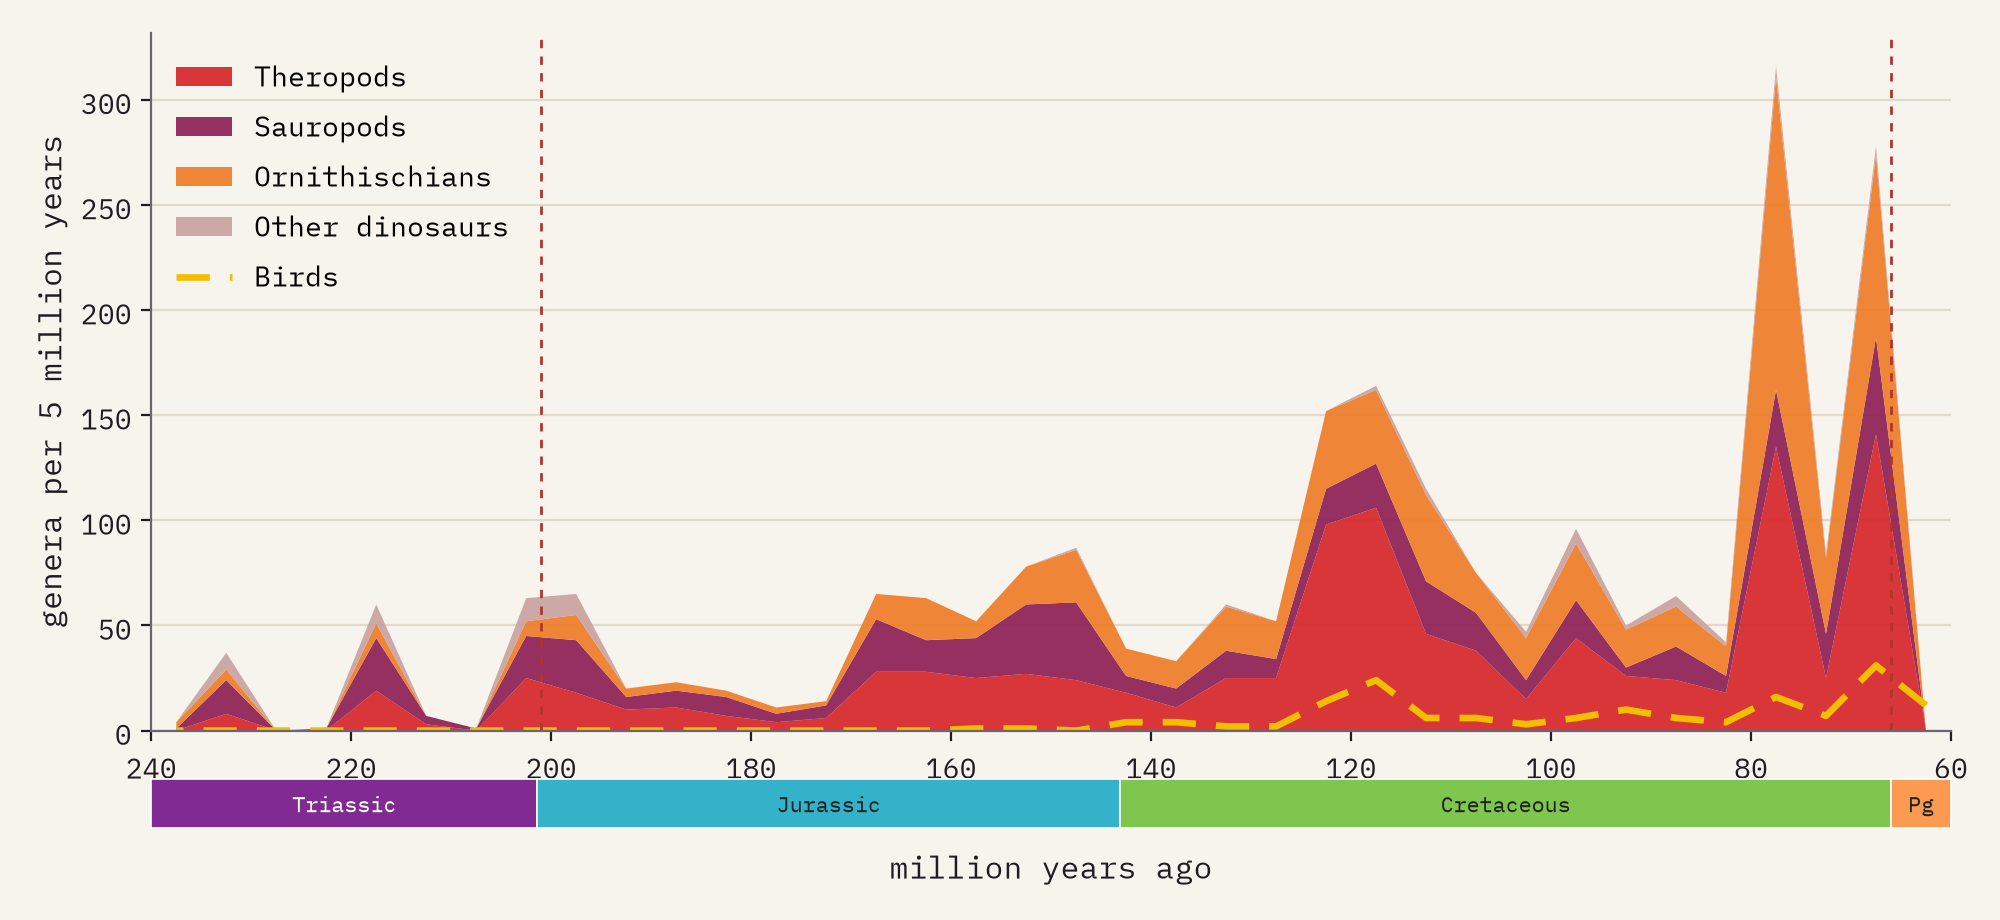
The data hold 20,231 finds of dinosaurs other than birds, in 1,588 genera. Their record grows through the Jurassic and explodes in the Late Cretaceous: the busiest 5 million years, 80 to 75 million years ago, has 316 genera, three quarters of the finds from North America, where rock of that age is unusually well exposed and well searched.
Dinosaurs began on Pangaea, and you can see the supercontinent in where their genera turn up. Of the genera from the Late Triassic and Early Jurassic, when the land was one, 11% (about 1 in 9) are found on more than one of today’s continents. Of the Cretaceous genera, after the break-up, just 5% are (1 in 20). The separated continents grew their own casts: every tyrannosaur and horned dinosaur in the data comes from the northern continents, while most abelisaurs come from the southern ones and India.
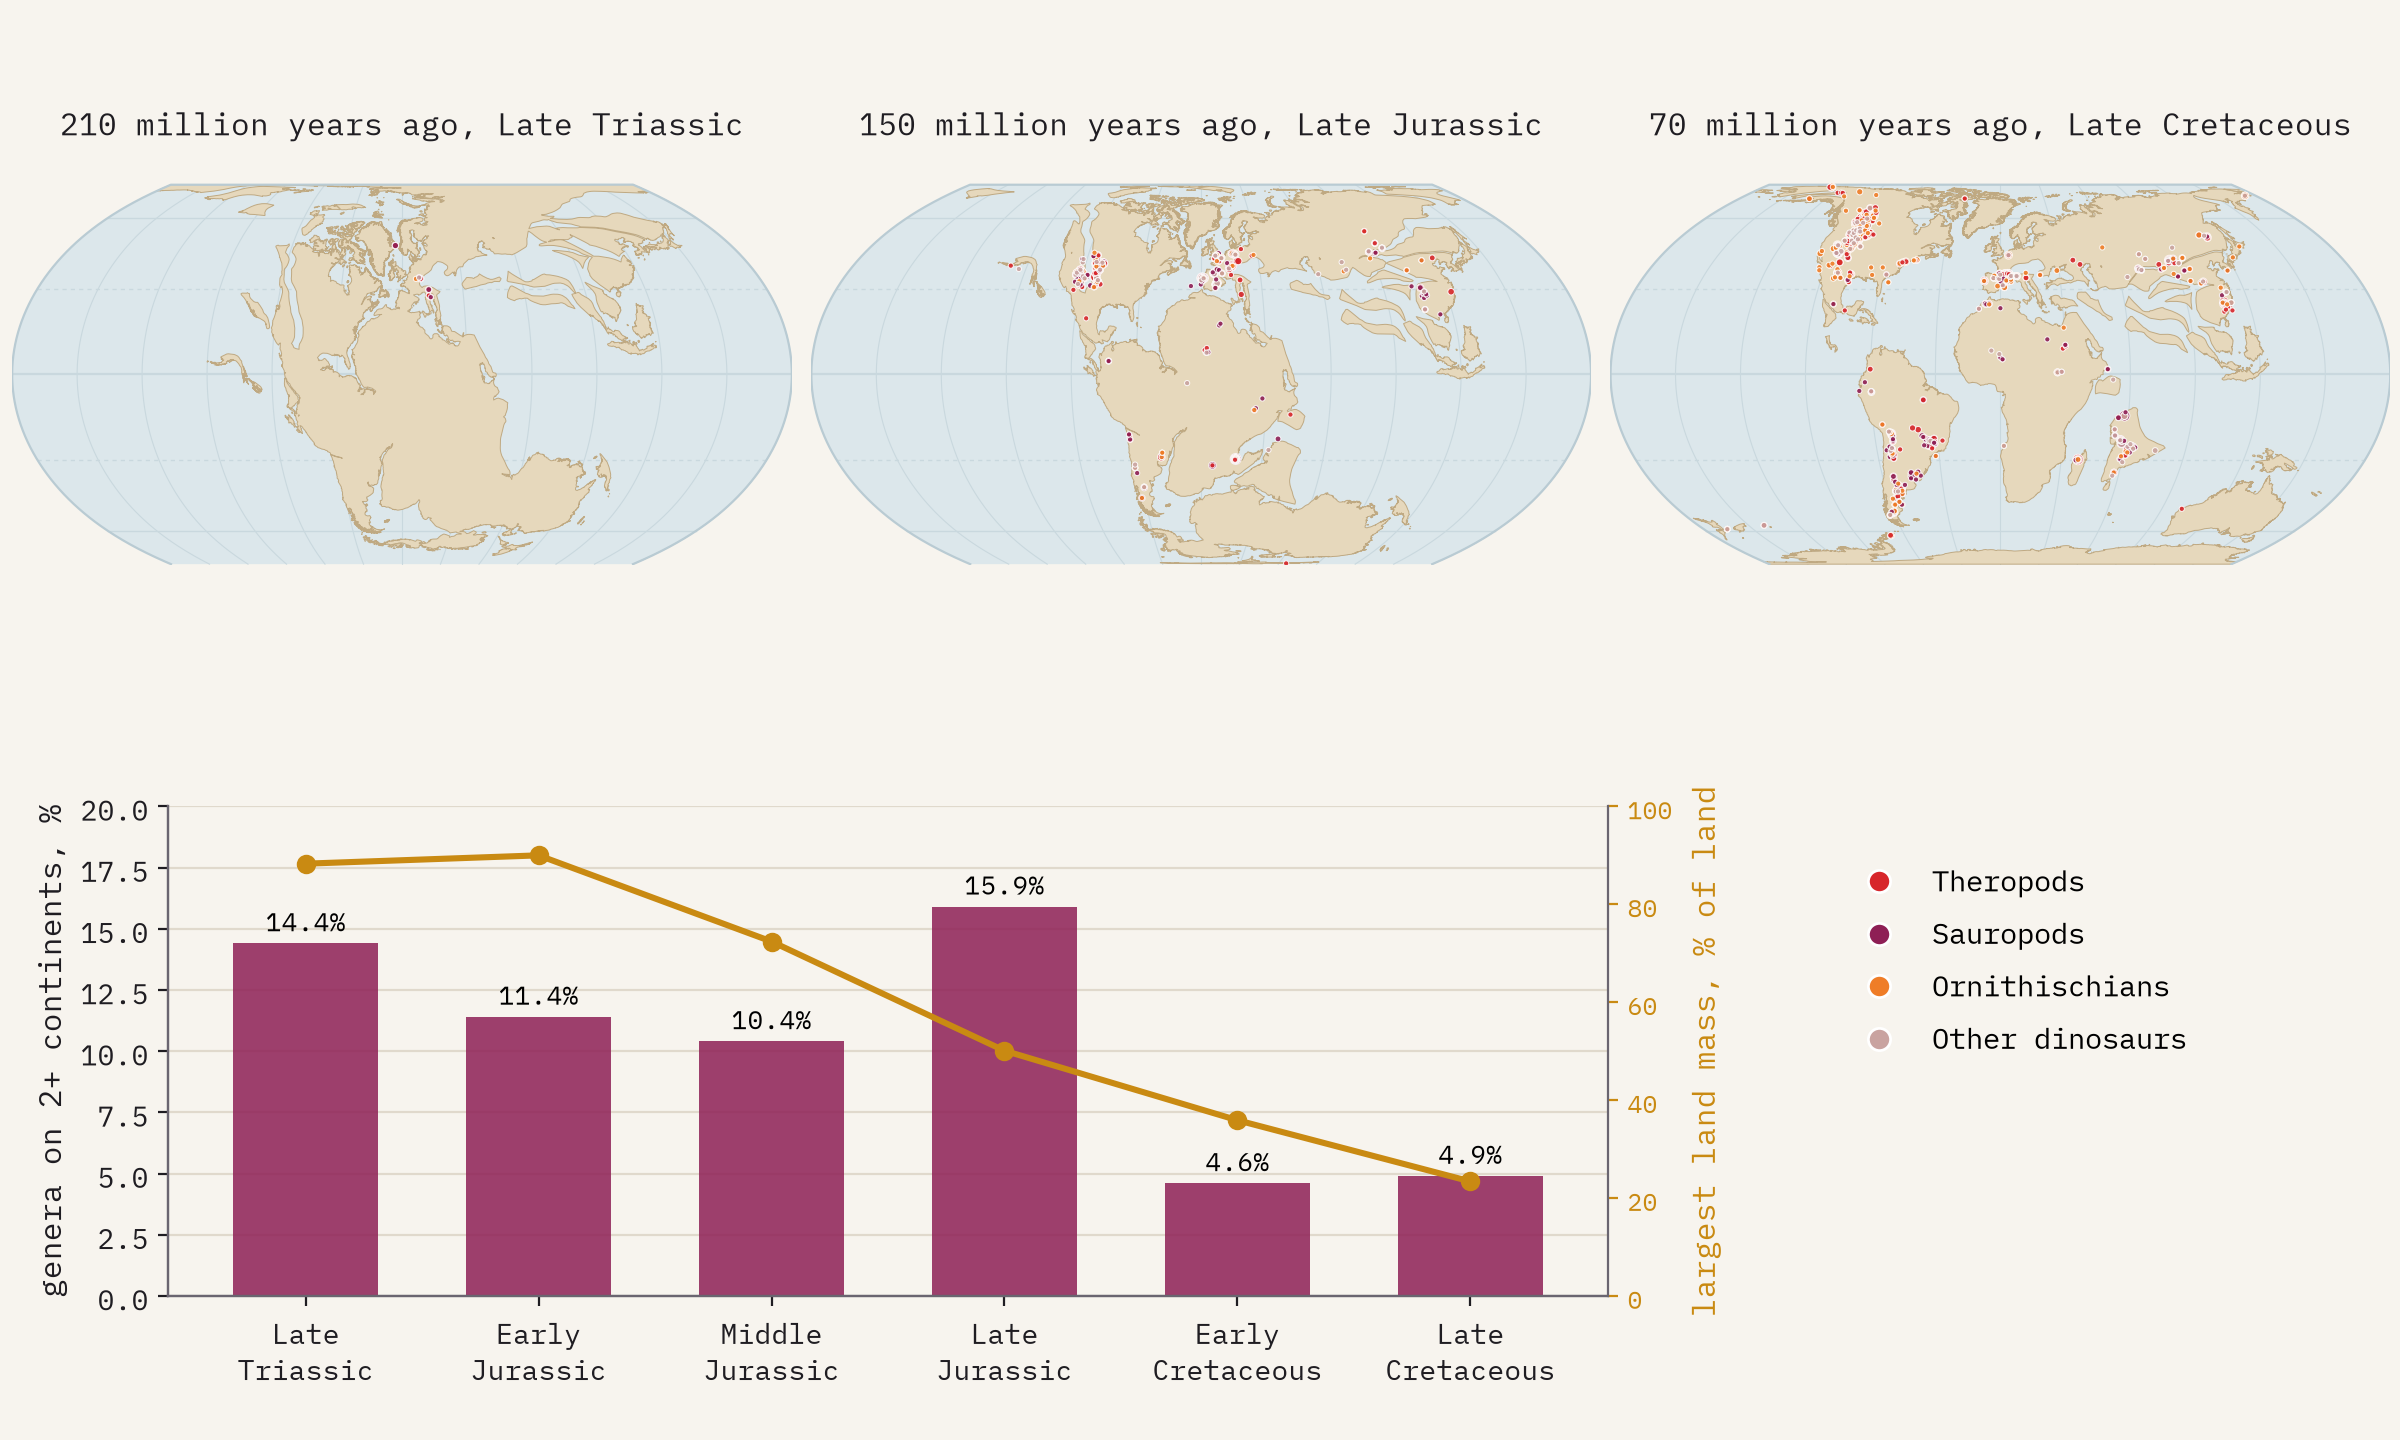
A dot on this map is a place where rock of the right age reached the surface and someone went to look.
Five extinctions
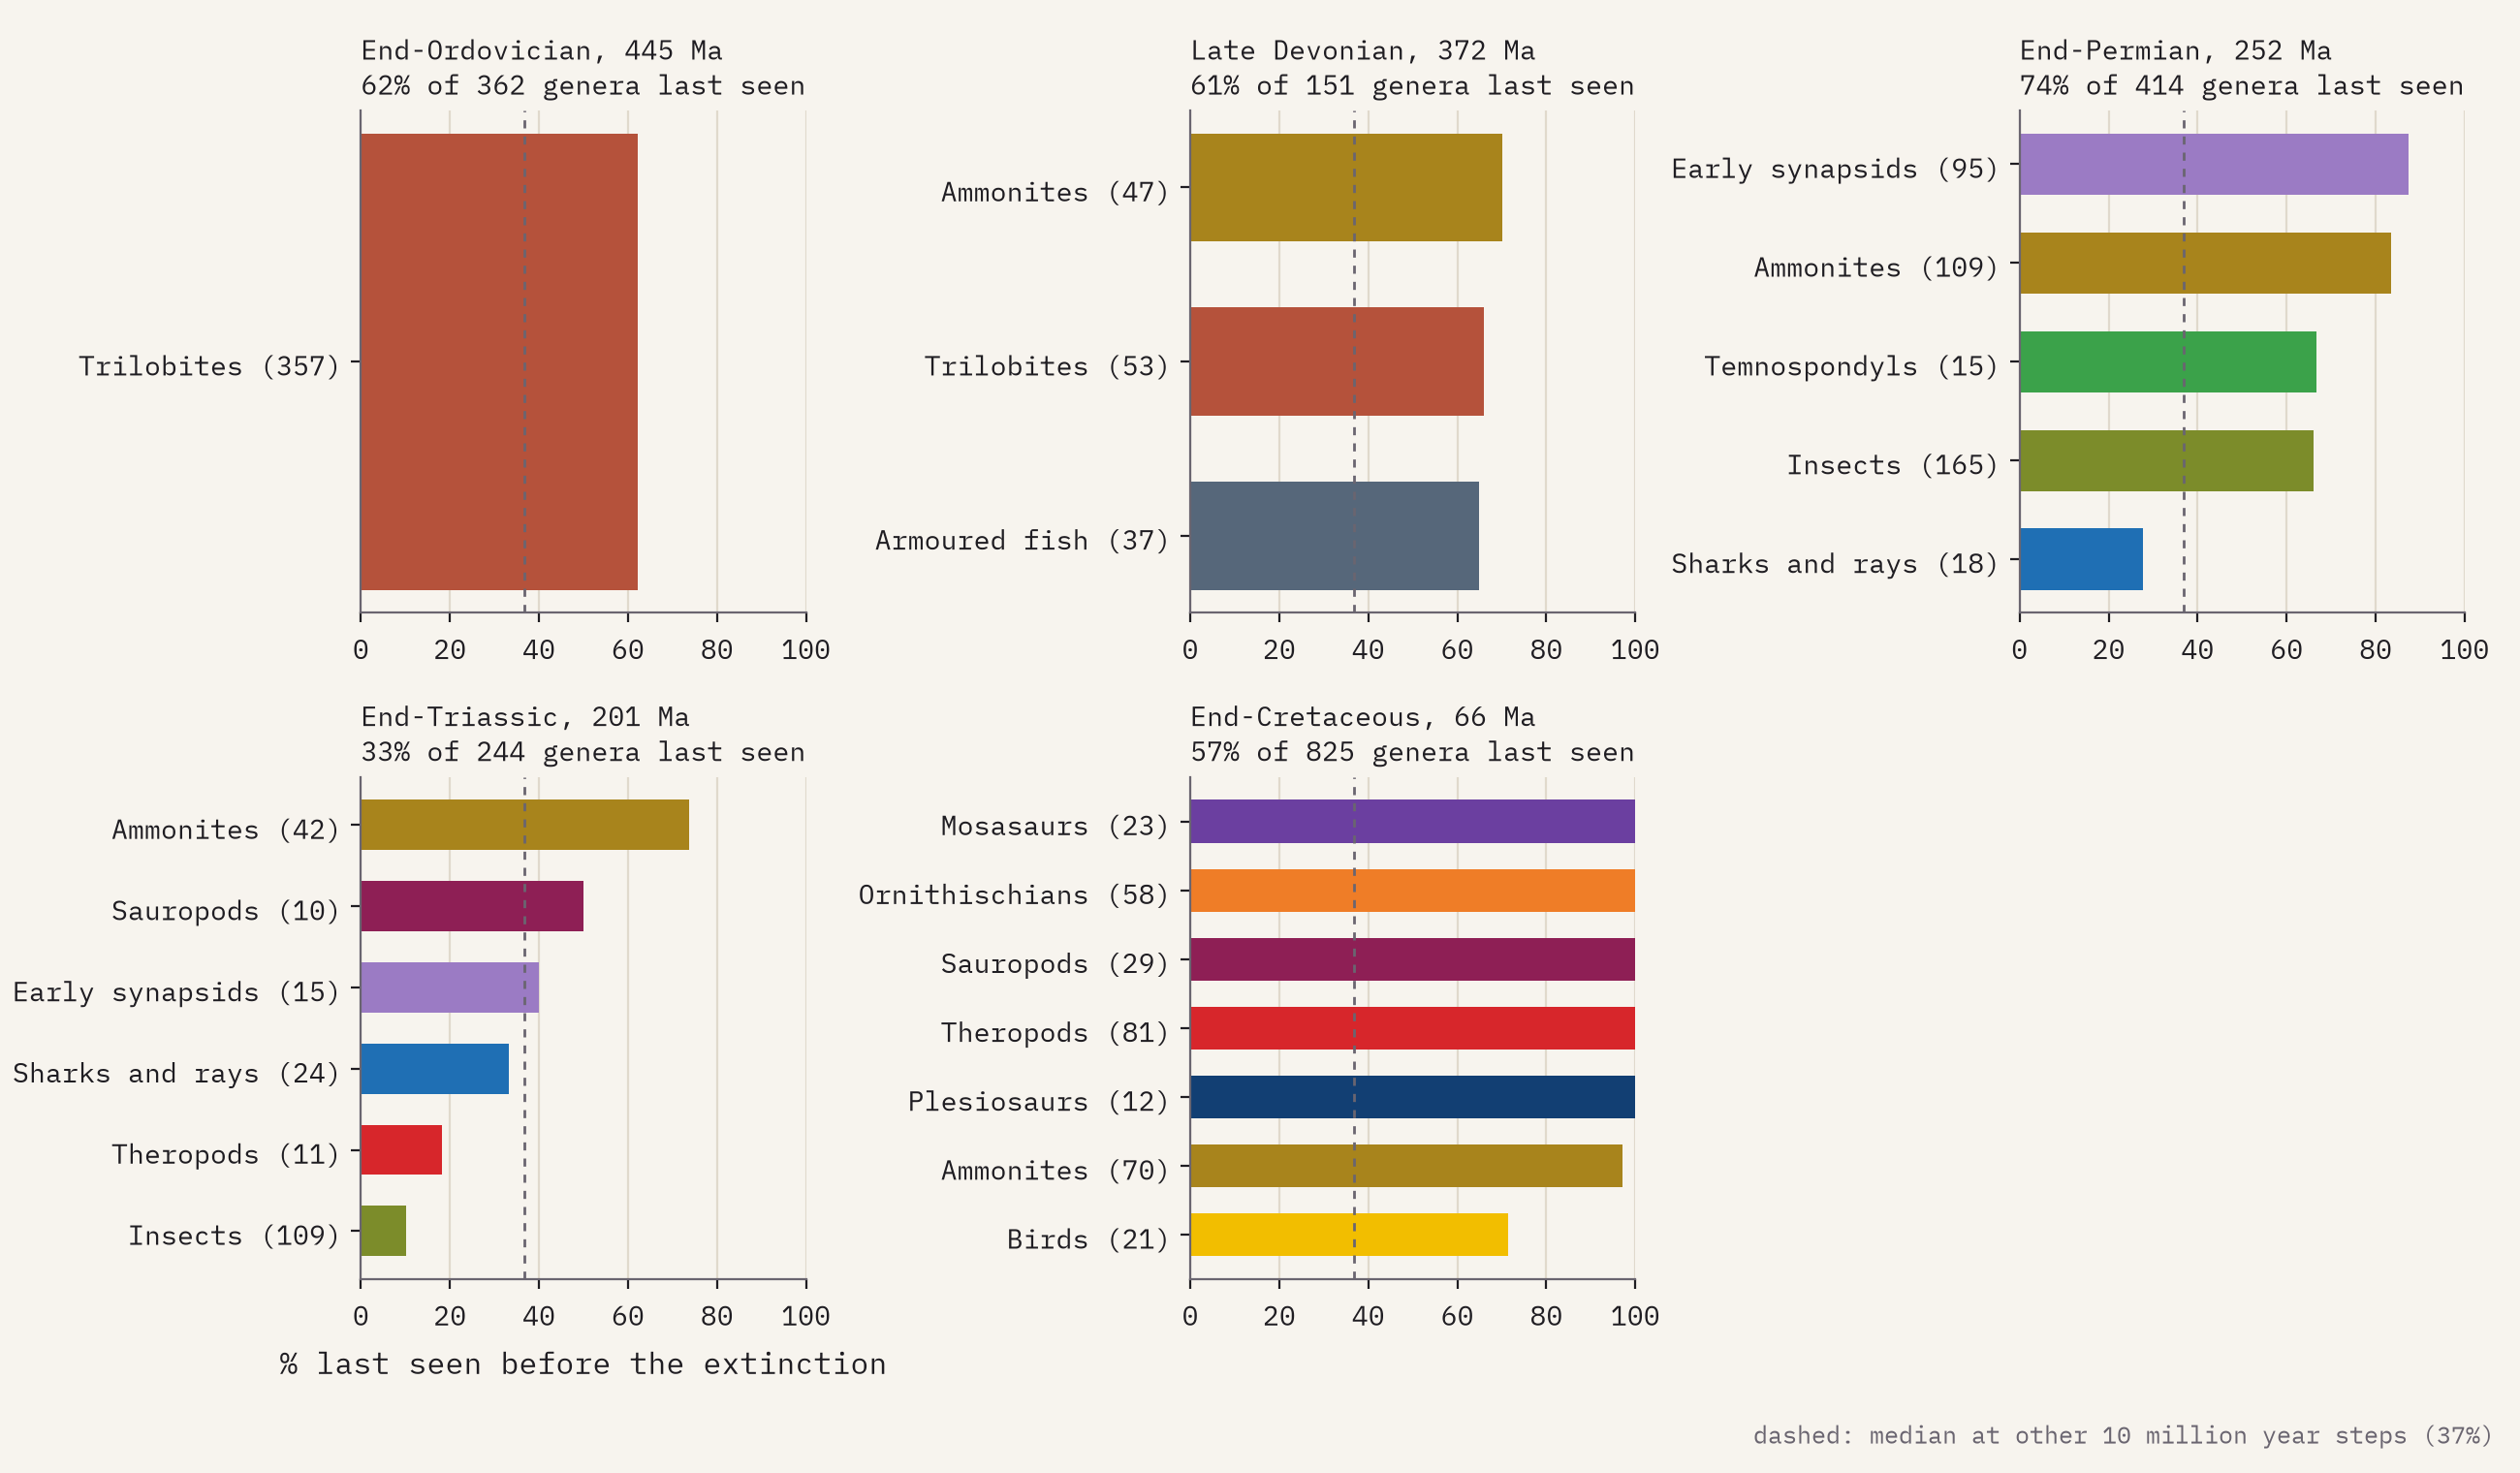
The map marks the five great mass extinctions. A crude way to see them in this data is to ask what share of the genera around in the 10 million years before each one are never found again. At an ordinary moment that is 37%, because genera come and go and many are rarely found. The end-Permian, the ‘Great Dying’, stands out at 74%. At the end of the Cretaceous every genus of non-bird dinosaur, plesiosaur and mosasaur in the data disappears, and 97% of ammonites, while the insects barely notice. The end-Triassic hardly registers in these groups at all, a reminder of how coarse this lens is.
A map of where palaeontologists dig
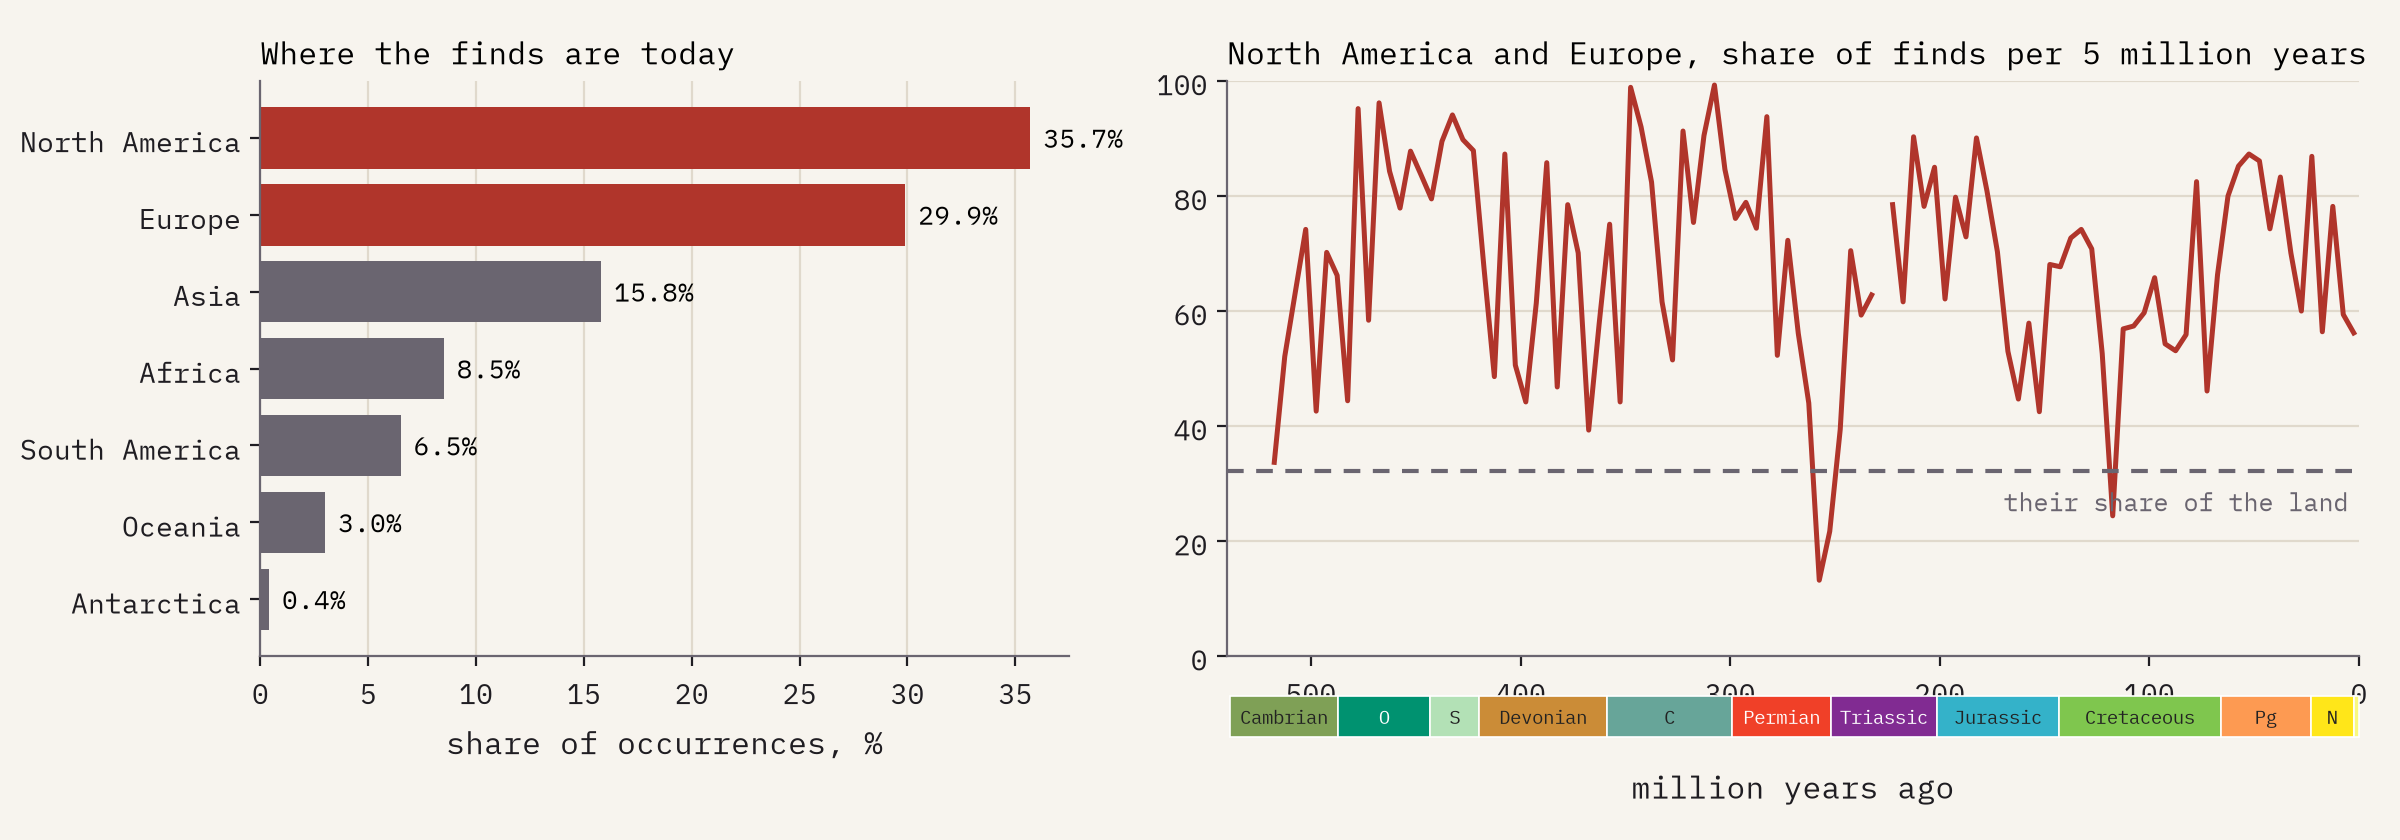
The honest headline is about the record itself. North America and Europe hold 32% of the world’s land but 66% of the finds here, and the United States alone 28%. Africa has 8%. The ancient continents look busiest where today’s have the most museums, universities and road cuttings. An empty ocean or continent on the map usually means no rock of that age at the surface, or nobody looking, not an empty world.
How I did this
I downloaded every occurrence of 23 named groups from the Paleobiology Database’s data service (480,977 rows), with palaeo-coordinates from the PALEOMAP model at each collection’s midpoint age. The groups overlap, so each record is kept once in its most specific group, and I fixed three names that reach further than intended: an insect also called Proboscidea, the frogs and salamanders that the database files inside the temnospondyls, and some birds filed as theropods. Ages are the midpoints of each collection’s age range; collections dated only to within more than 25 million years are left out. That leaves 409,895 occurrences in 98,147 collections. The continents are PALEOMAP outlines from the GPlates Web Service, the same model as the fossil positions, simplified for the web and drawn in the Equal Earth projection. On the map, finds are binned into 1 degree squares of ancient latitude and longitude. The paper has the details and every caveat.
Notes and sources
- The Paleobiology Database (paleobiodb.org), data accessed 2026, via the data service version 1.2. CC BY 4.0.
- PALEOMAP plate model and coastlines, C. R. Scotese, PALEOMAP Project, reconstructed with the GPlates Web Service (EarthByte group, University of Sydney). I could not check PALEOMAP’s own reuse terms while building this, so the outlines are credited in full; please check them before reusing the outlines.
- Natural Earth countries and provinces (public domain), for present-day places.
- Geological time scale after the International Commission on Stratigraphy’s chart, rounded.
- I wrote the text, with drafting and editing assistance from Claude (Anthropic), which also helped prepare the analysis code. I reviewed and checked all text and results.

