
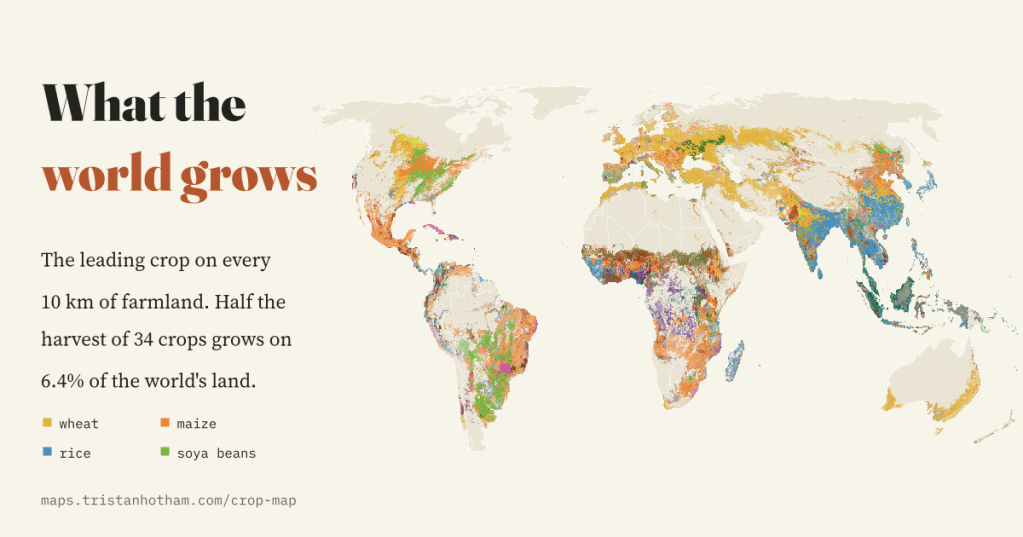
Wheat on the steppes, rice through monsoon Asia, soya beans across the Americas, cocoa in West Africa. I mapped the leading crop on every 10 km square of the world’s farmland, and set it beside sixty years of change in how much land we farm.
Most maps of farming colour a whole country one shade. But a country is not one farm. The Punjab grows wheat in winter and rice in summer, the American Midwest is a patchwork of maize and soya beans, and a drive of a few hundred kilometres across Spain takes you from olive groves to wheat to grazing land. I wanted to see what the world grows at the finest scale that open data allow.
Two sources make it possible. CROPGRIDS, published in 2024, estimates the area of 173 crops on a grid of 0.05 degrees, about 5.6 km, for around 2020. I used its 34 biggest and best-known crops, which between them cover 87% of the world’s harvested area. FAOSTAT, the statistics of the UN’s Food and Agriculture Organization, gives every country’s cropland, pasture and crops every year since 1961.
Most farmland is grass
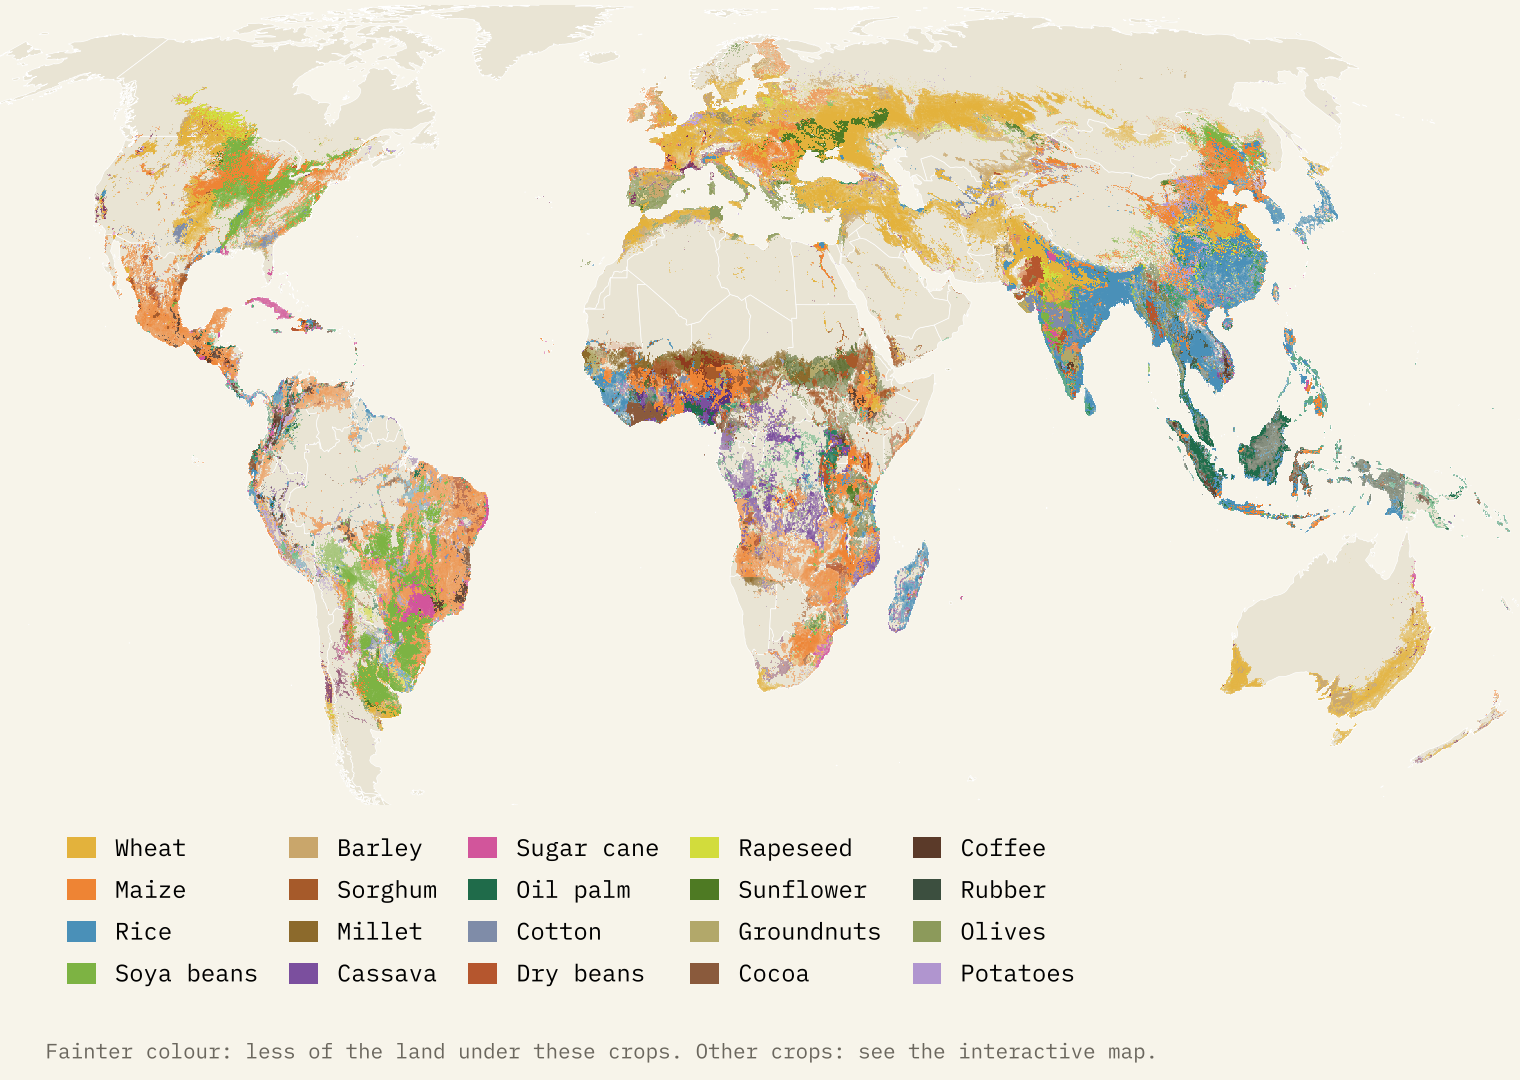
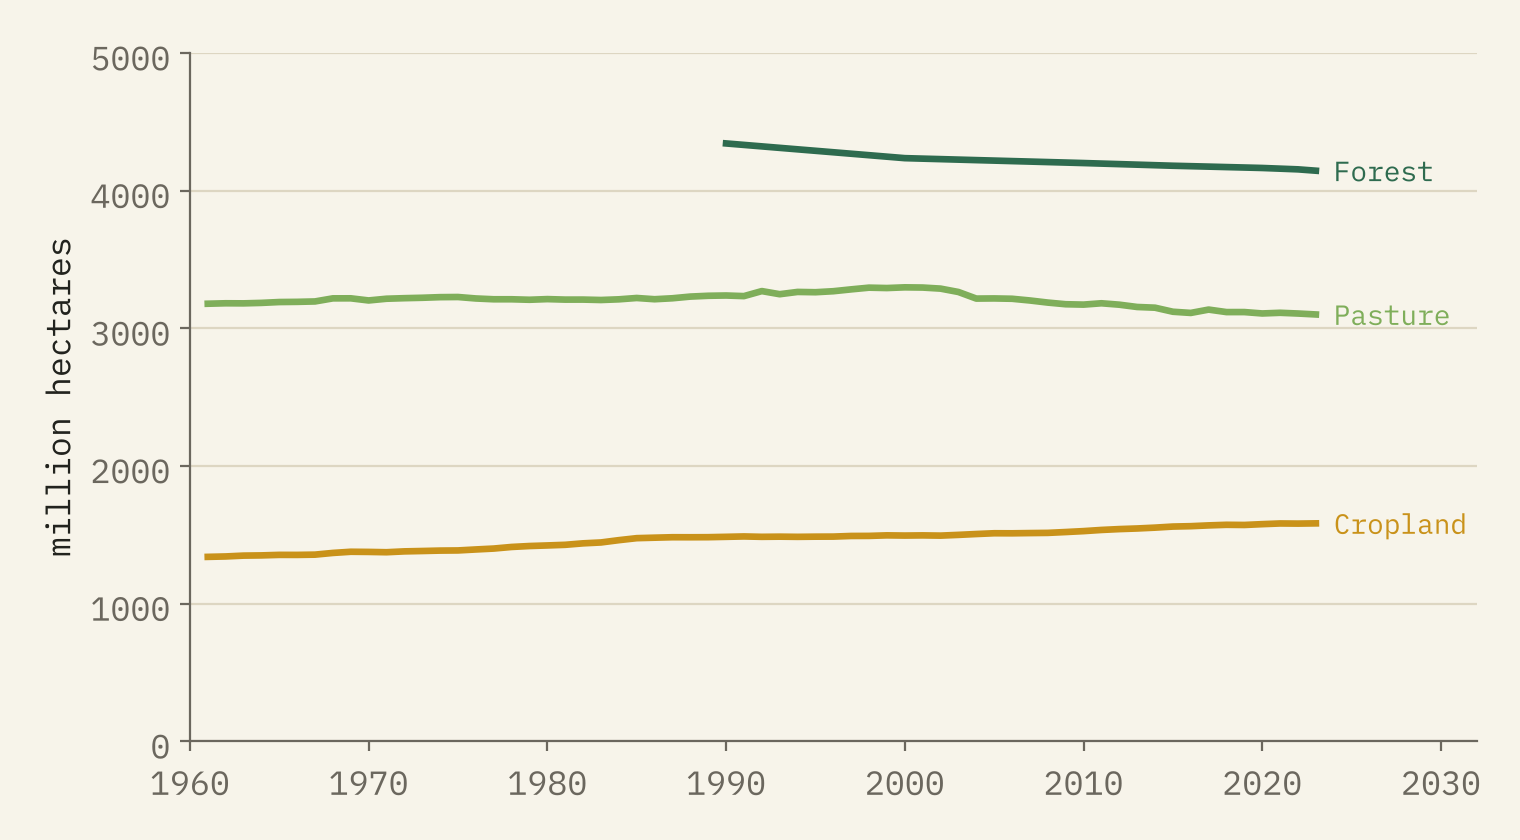
The first surprise is how little of the farmed world is under crops. FAO counts 4,682 million hectares of farmland, 36% of the world’s land, and two thirds of it is pasture and grazing. Cropland covers 1,583 million hectares, 12% of the land. Cropland has grown by 18% since 1961 and has never been larger, but pasture peaked in 2000, so the world’s total farmland is now 111 million hectares smaller than at its peak.
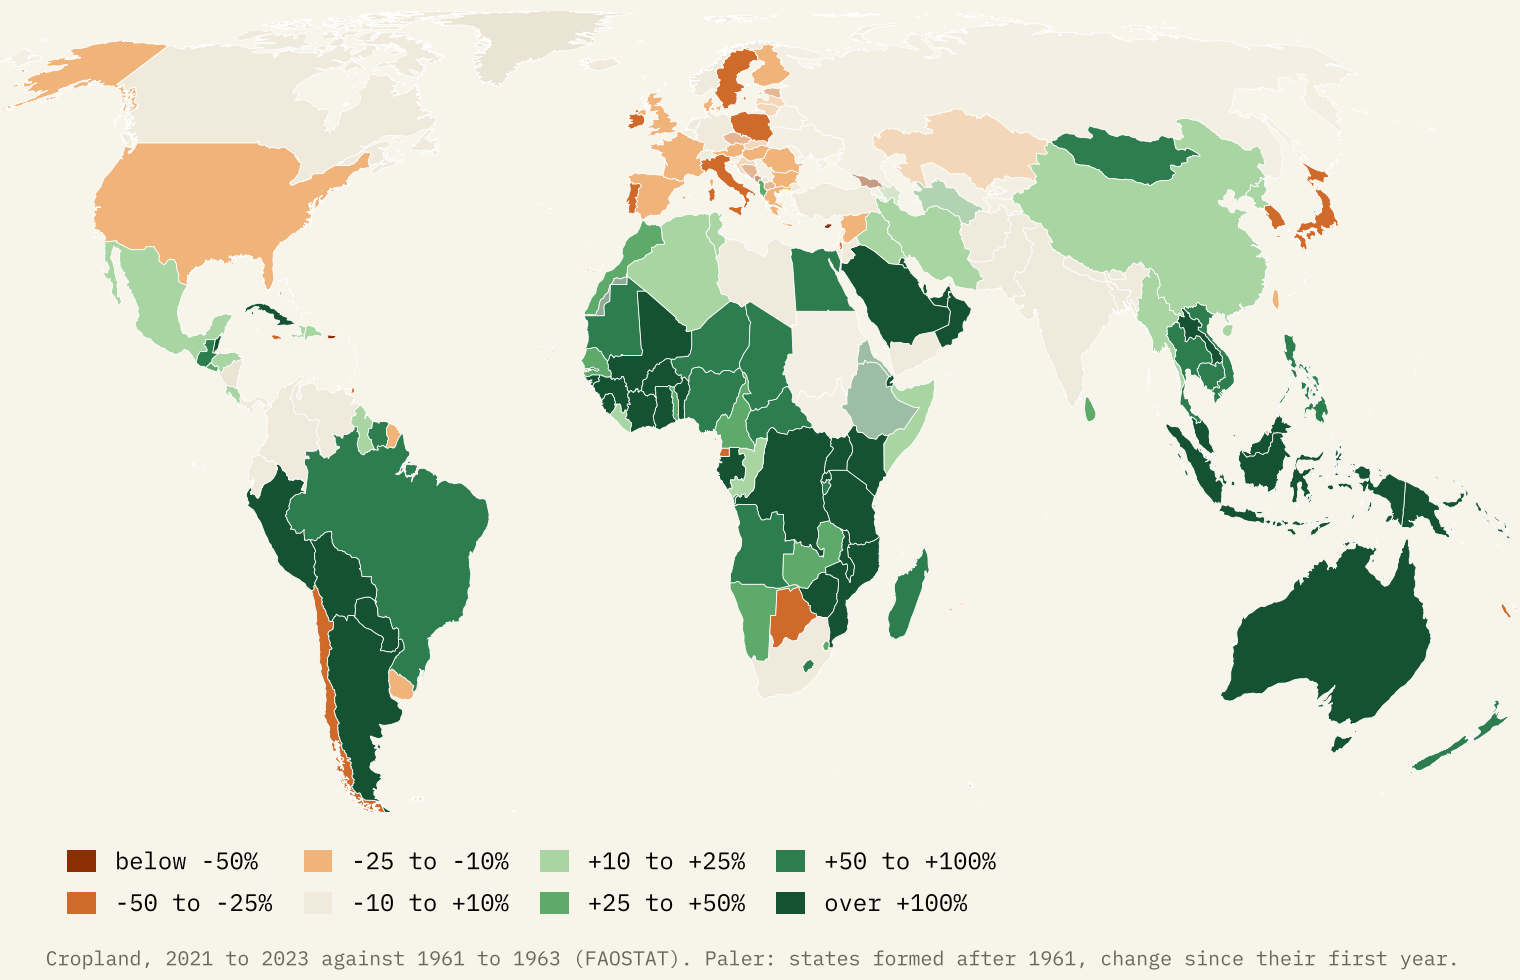
Cropland has also moved. The biggest gains since the early 1960s were in Brazil (+31.5 million hectares), Argentina (+28.4), Indonesia (+24.6) and China (+23.8). The biggest loss was in the United States, 25.9 million hectares fewer, followed by Italy, Poland, Spain and France. The countries of the former Soviet Union farm 18.3 million hectares less cropland than the USSR did in its last years.
Four crops, half the harvest
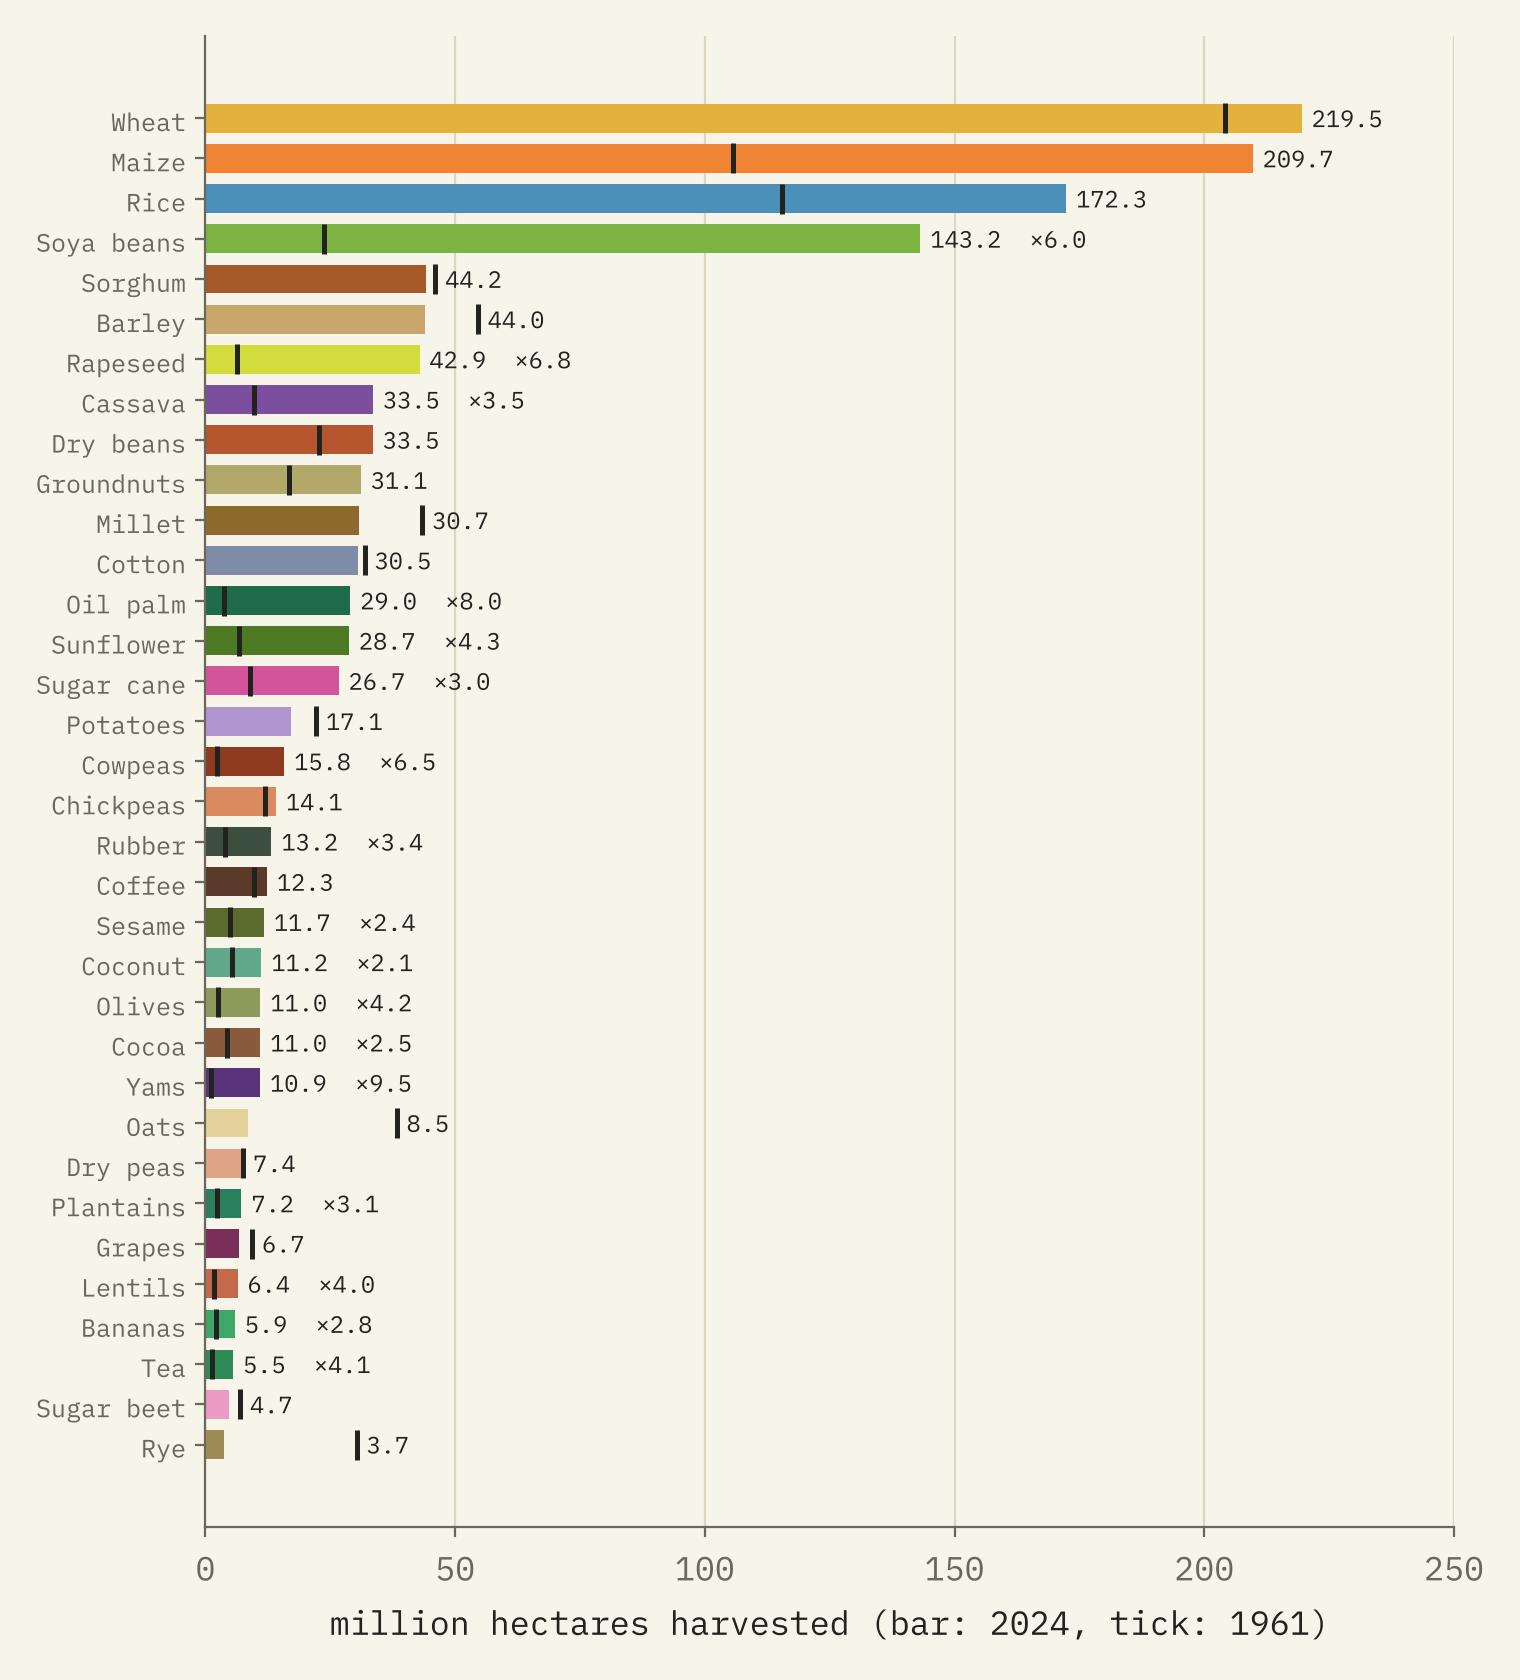
Wheat, maize, rice and soya beans cover 50% of the world’s harvested land. The growth since 1961 has been driven by oil and animal feed: soya beans, oil palm and maize account for 48% of the extra 521 million hectares. Oil palm has grown eightfold and soya beans sixfold, while the world now harvests 88% less rye and 78% less oats than in 1961.
And the belts are just where you would expect them. 85% of the world’s rice is harvested in South, Southeast and East Asia, 74% of its soya beans in the Americas, 67% of its oil palm in Indonesia and Malaysia, and 66% of its cocoa in West Africa.
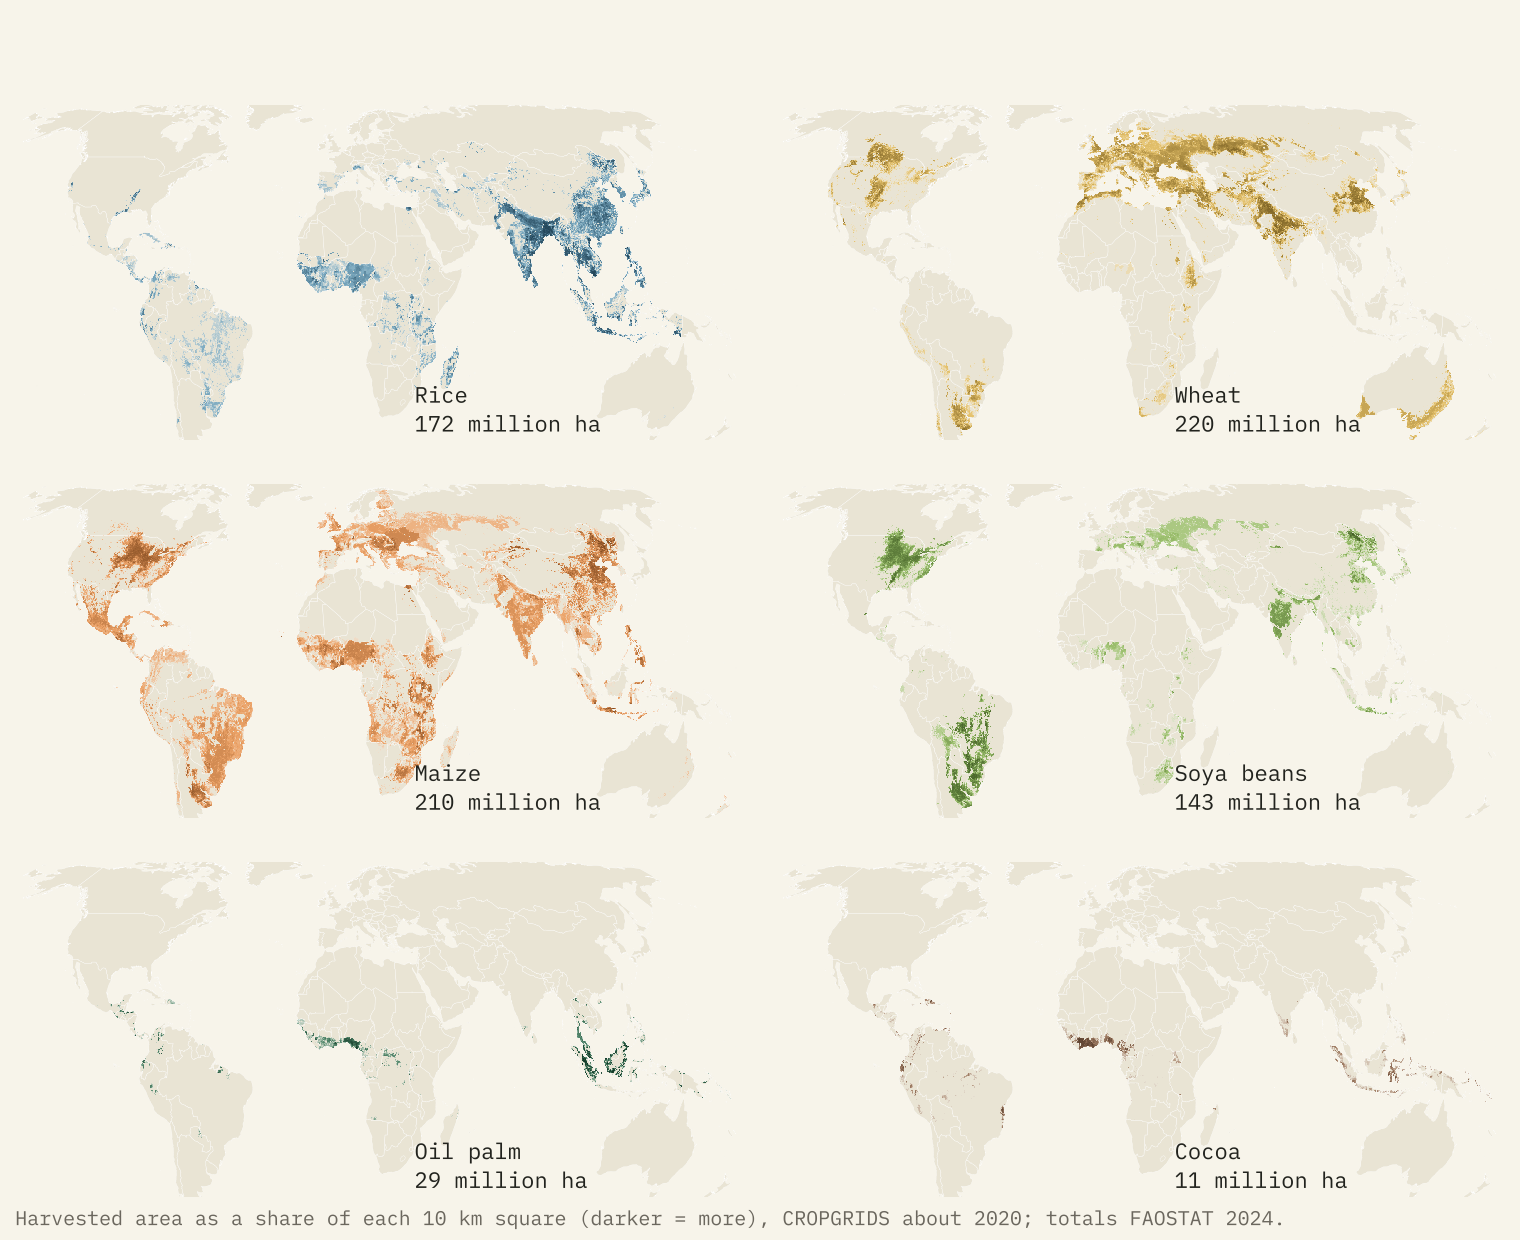
Half of the world’s harvested area of these crops lies on just 6.4% of its land.
That concentration is striking: the busiest farmland, from the Ganges plain to the Corn Belt, carries most of the harvest, and nine tenths of it lies on 21% of the land.
Every country’s speciality
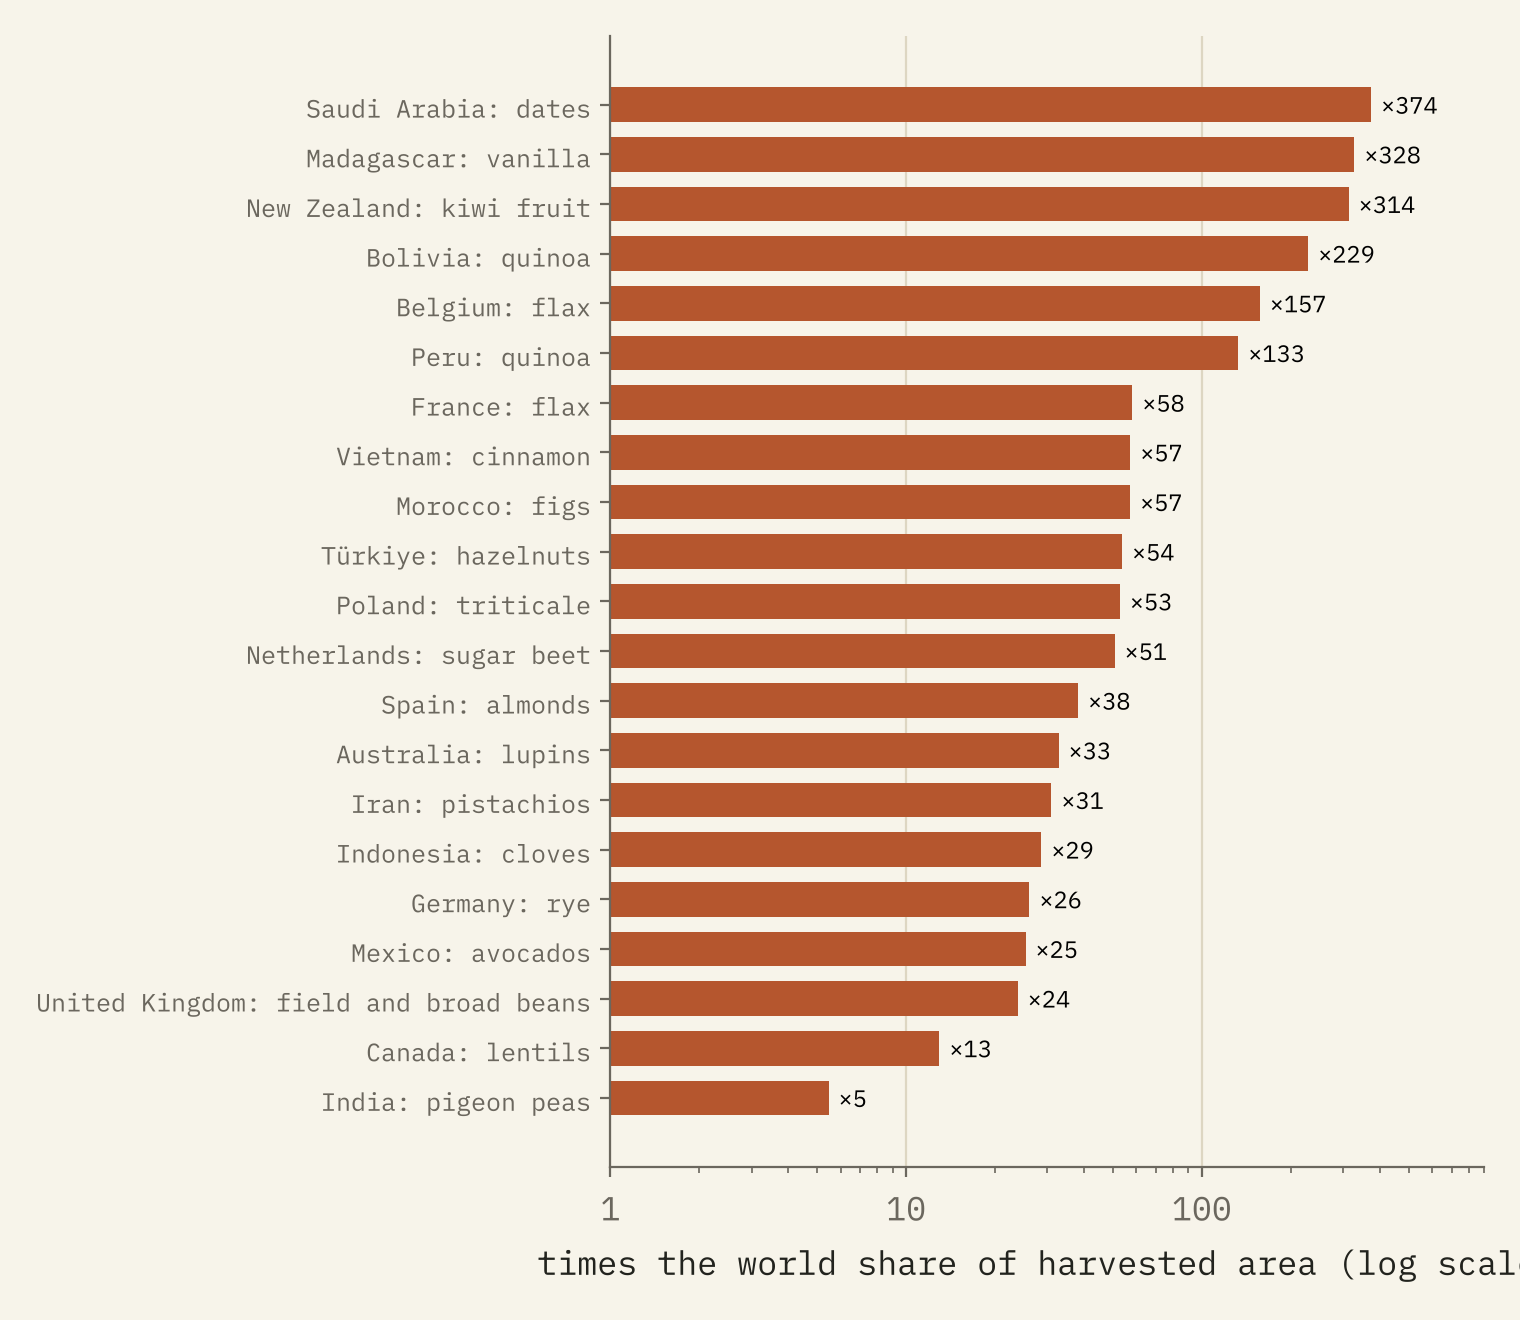
Wheat is the biggest crop in 42 countries, maize in 32 and rice in 22. More fun is the speciality: the crop a country grows far more of than the world does, relative to its farmland. Saudi Arabia gives 34% of its harvested land to dates, 374 times the world share. Madagascar’s speciality is vanilla, New Zealand’s kiwi fruit, Bolivia’s quinoa and Turkey’s hazelnuts. And the United Kingdom’s? Field beans.
Closer to home
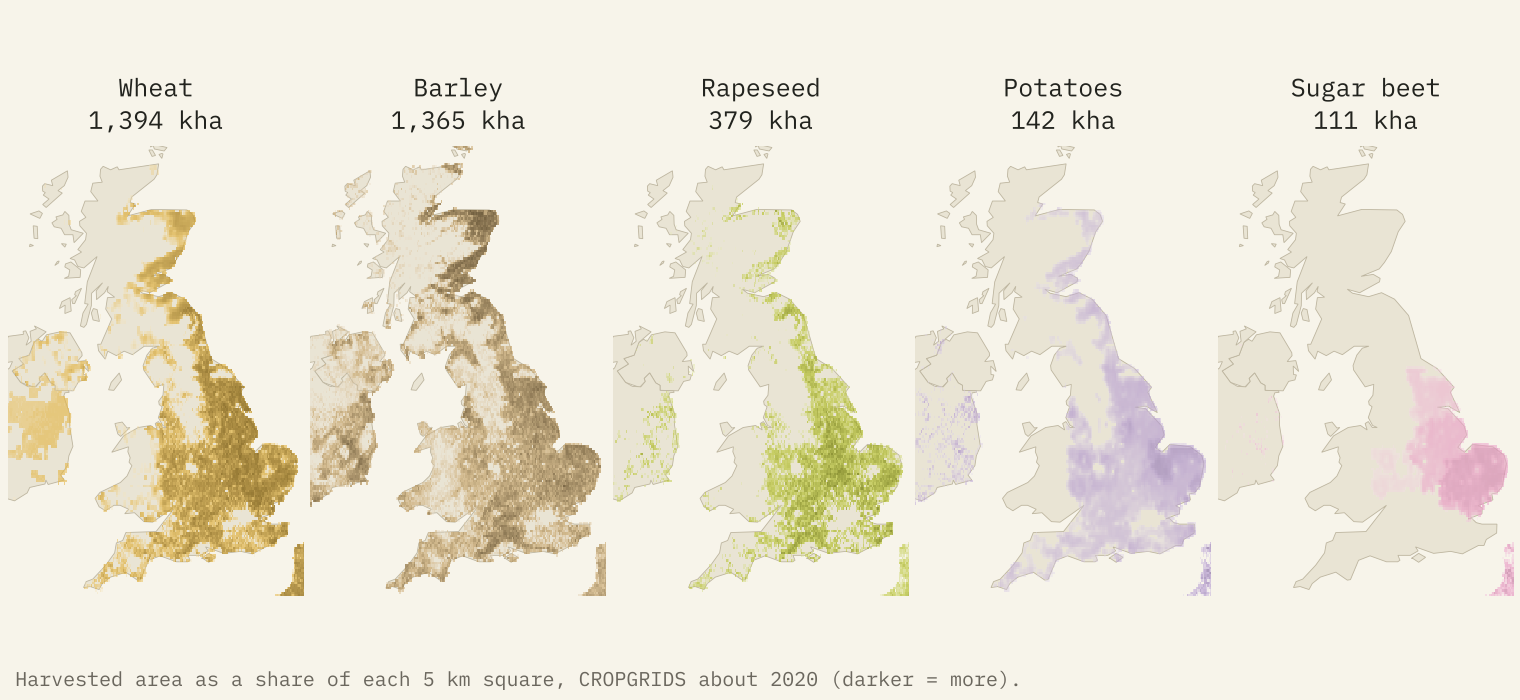
The UK is mostly grass: pasture covers 45% of its land and cropland 25%. On the arable land, wheat, barley and rapeseed fill 76% of the harvested area. Wheat dominates the east and south, barley the north and Scotland, and potatoes and sugar beet cluster in East Anglia and the Fens. Sixty years have reshuffled the fields: oats fell from 704,292 hectares to 182,046, while rapeseed, which barely existed in 1961, peaked at 755,717 hectares in 2012.
How detailed can we get?
Honestly, about 10 km for a single recent year, and the country for anything over time. CROPGRIDS is a model stitched together from 29 earlier maps and statistics, and where an input was coarse it is spread across finer cells. It also makes mistakes: it puts 830,562 hectares of maize in the UK, where FAOSTAT records none (it is probably silage maize), so on the map maize leads in much of western Britain and Ireland. For change since 1961 there is only the country and the year.
How I did this
I summed the CROPGRIDS harvested area of 34 crops into 0.1 degree squares and found the leading crop, the runner-up and a diversity score in each. For countries I used FAOSTAT’s bulk land use and crop downloads, removing regional totals and counting China once, and averaged crops over 2022 to 2024. Specialities use a location quotient, the crop’s share of a country’s harvested land divided by its share of the world’s. This is a map of area, not of production or value, and it leaves out vegetables, most fruit and grass. The paper sets out every step and caveat.
Notes and sources
- Tang, F.H.M., Nguyen, T.H., Conchedda, G., Casse, L., Tubiello, F.N. and Maggi, F. (2024) CROPGRIDS: a global geo-referenced dataset of 173 crops. Scientific Data 11, 413. Data on figshare, CC BY 4.0.
- FAOSTAT, Crops and livestock products and Land use. FAO, CC BY 4.0.
- Natural Earth outlines and place names (public domain).
- I wrote the text, with drafting and editing assistance from Claude (Anthropic), which also helped prepare the analysis code. I reviewed and checked all text and results.

