
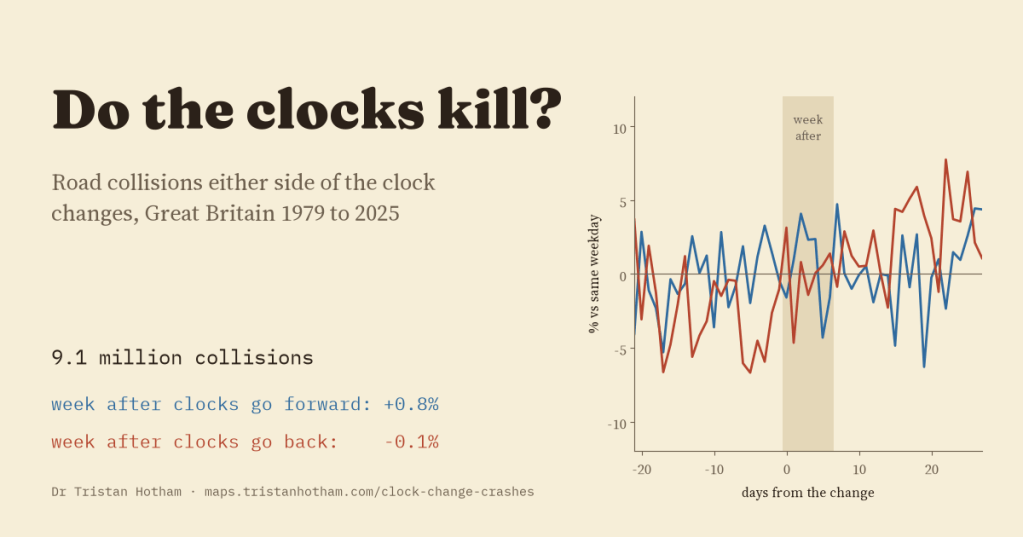
Every spring and every autumn someone warns that the clock change will bring more crashes. I took every injury collision reported to the police in Great Britain since 1979, 9.1 million of them, and compared the week after each change with the weeks around it. The crashes did not follow.
There are two stories about why changing the clocks might be dangerous. The first is about sleep. When the clocks go forward in March we lose an hour in bed, and a tired driver is a worse driver. The second is about light. Most of us live by the clock, not the sun, so when the clocks go back in October the drive home suddenly happens in the dark. Darkness makes the roads more dangerous, especially for people on foot.
Both stories are plausible, and studies in the United States have found that fatal crashes rise by around six per cent in the week after the spring change. But other studies find nothing, and a careful review of the evidence in 2017 concluded that it pointed in no clear direction. Britain has one of the longest road collision records anywhere, so I asked it directly.
No jump
The Department for Transport publishes every personal injury road collision reported to the police in Great Britain, with its date, time, severity and whether it happened in daylight or darkness. The file goes back to 1979 and now runs to 2025: 9,116,617 collisions. Over those 47 years the clocks changed 94 times. I left out three changes, in 2020 and the spring of 2021, because lockdown rules began or ended in the middle of them, which leaves 91.
For each change I compared the seven days starting on the Sunday of the change with the same days of the week one, two and three weeks earlier and one, two and three weeks later. Looking both ways matters, because traffic and daylight drift steadily through March and October, and comparing only with the week before would mistake that drift for an effect.
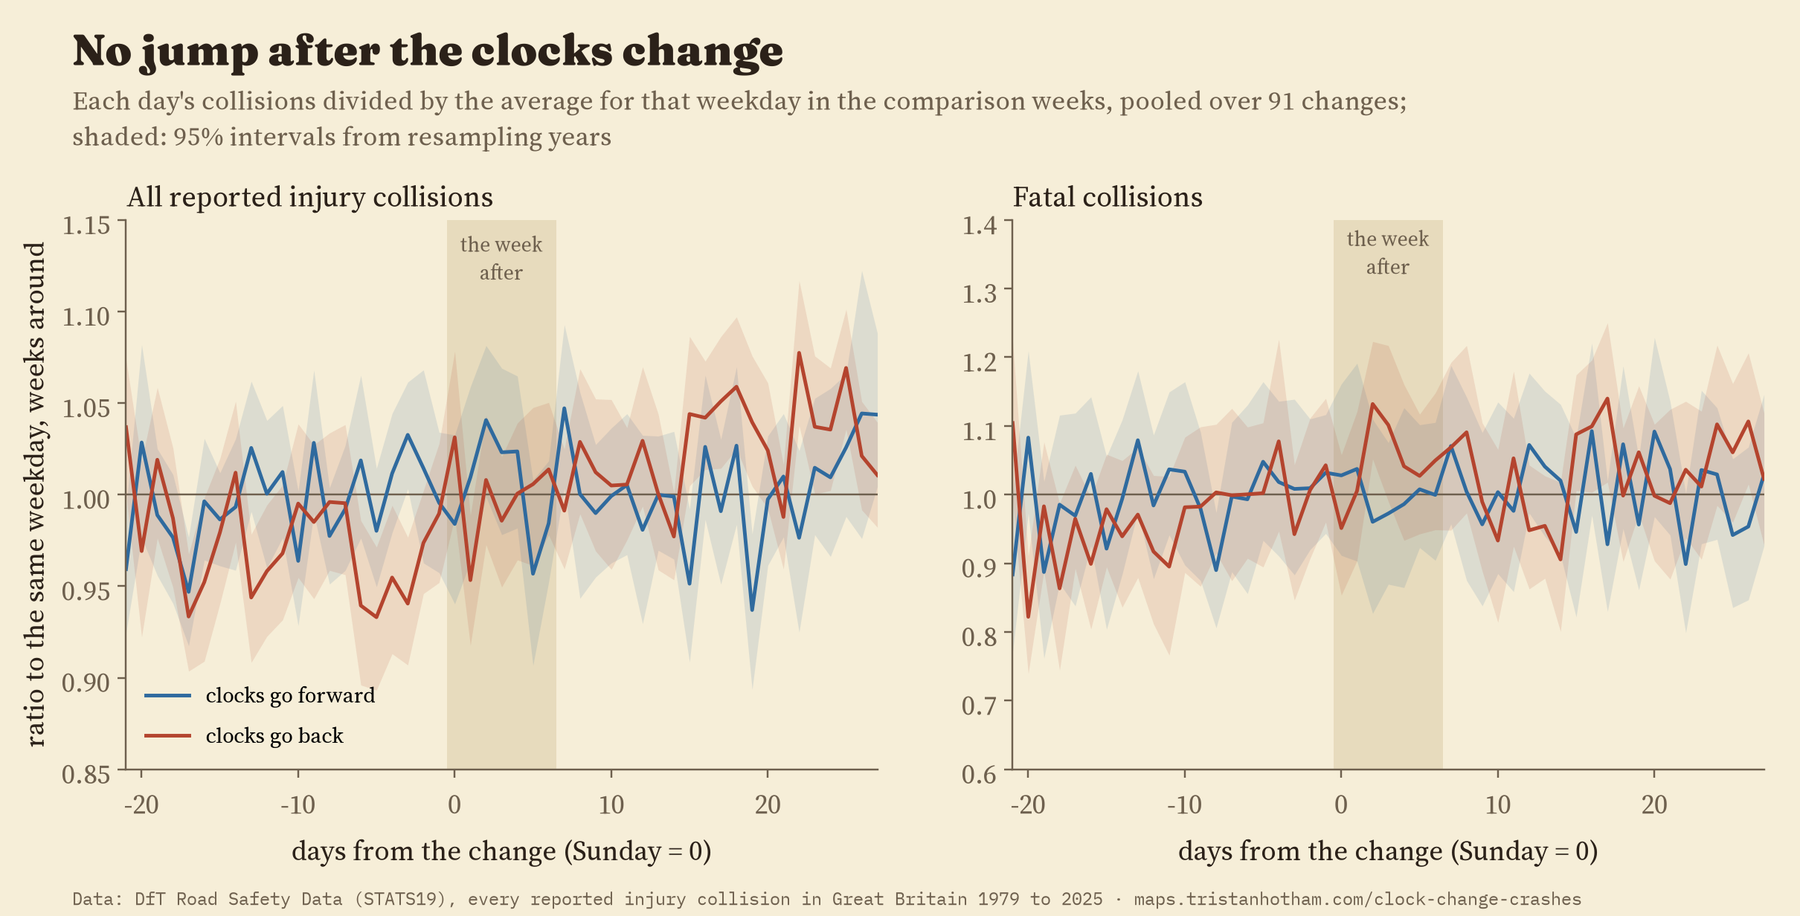
In the week after the clocks go forward, reported collisions changed by 0.8%. In the week after they go back, by -0.1%. Both are zero within the noise: the 95% intervals run from -1.5% to 3.1% and from -2.3% to 2.1%. Day by day, there is no step on the Sunday of the change or in the days after it.
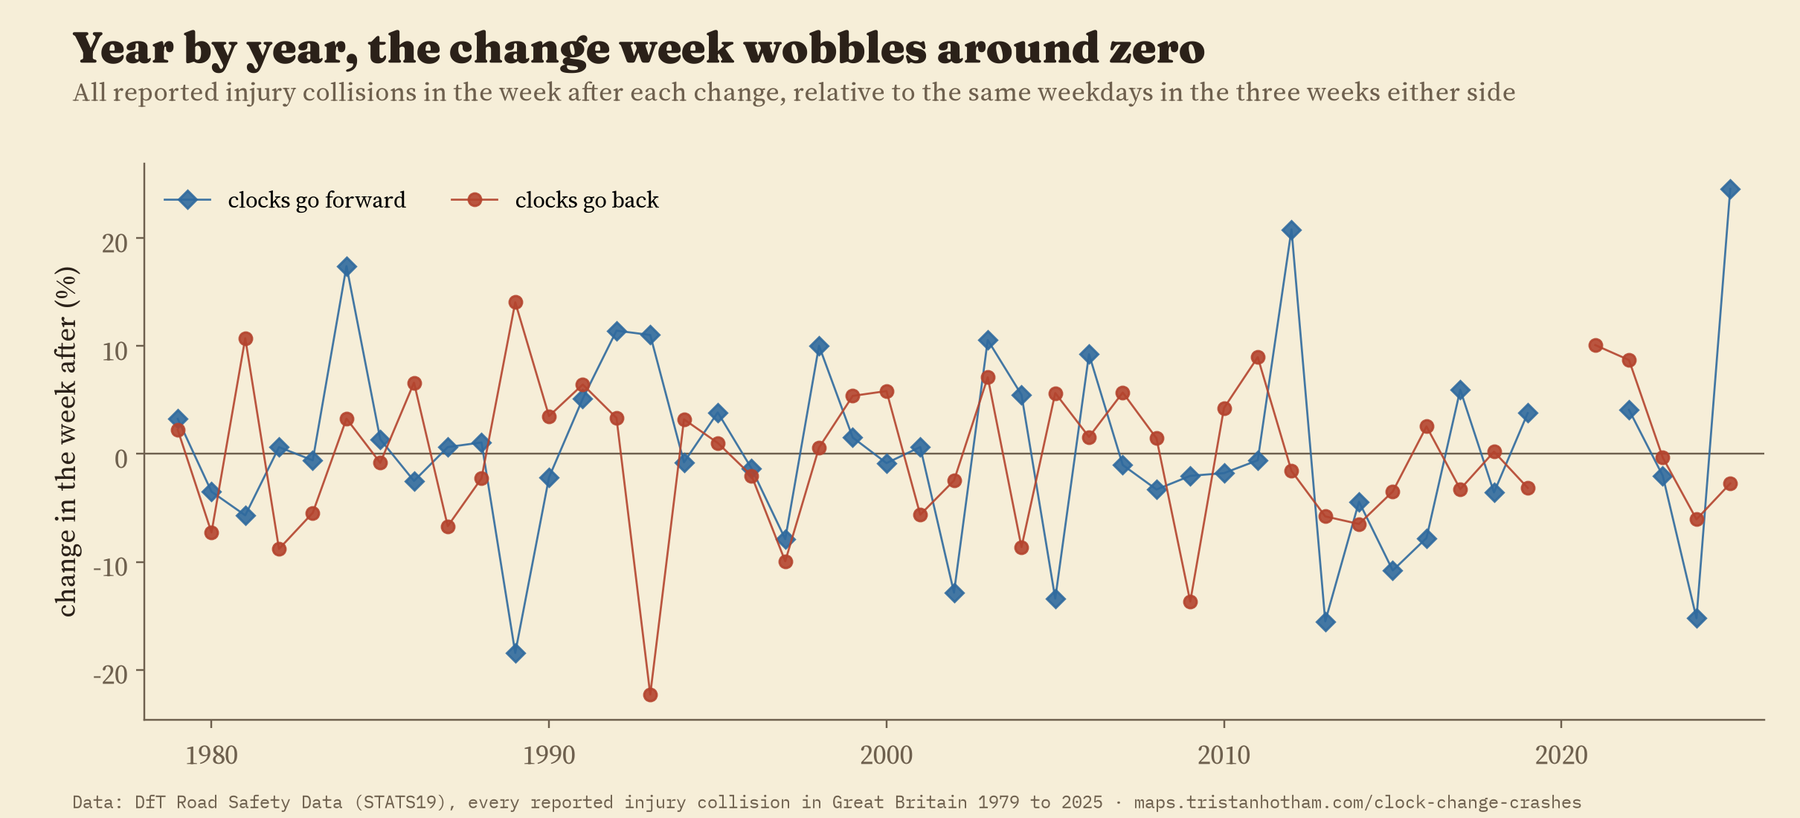
Change by change, the week after a clock change sometimes has more collisions and sometimes fewer, in roughly equal measure. The spring changes swing more than the autumn ones because Easter, with its bank holidays and school holidays, sometimes falls in the week after the change and sometimes in the weeks around it.
The dark moves, the crashes barely do
The light story makes a sharper prediction than the sleep story. If the dark is what matters, collisions should move between hours of the day: towards the evening rush hour when the clocks go back, away from it when they go forward. To test that, I compared how each day’s collisions were spread across its hours, so that anything affecting a whole day, like the weather or a bank holiday, drops out.
The light certainly moves. In the weeks around the autumn change, 68% of collisions between five and seven in the evening happened in the dark. In the week after the clocks go back, 88%. In spring the same hours go from 15% dark to 4%.
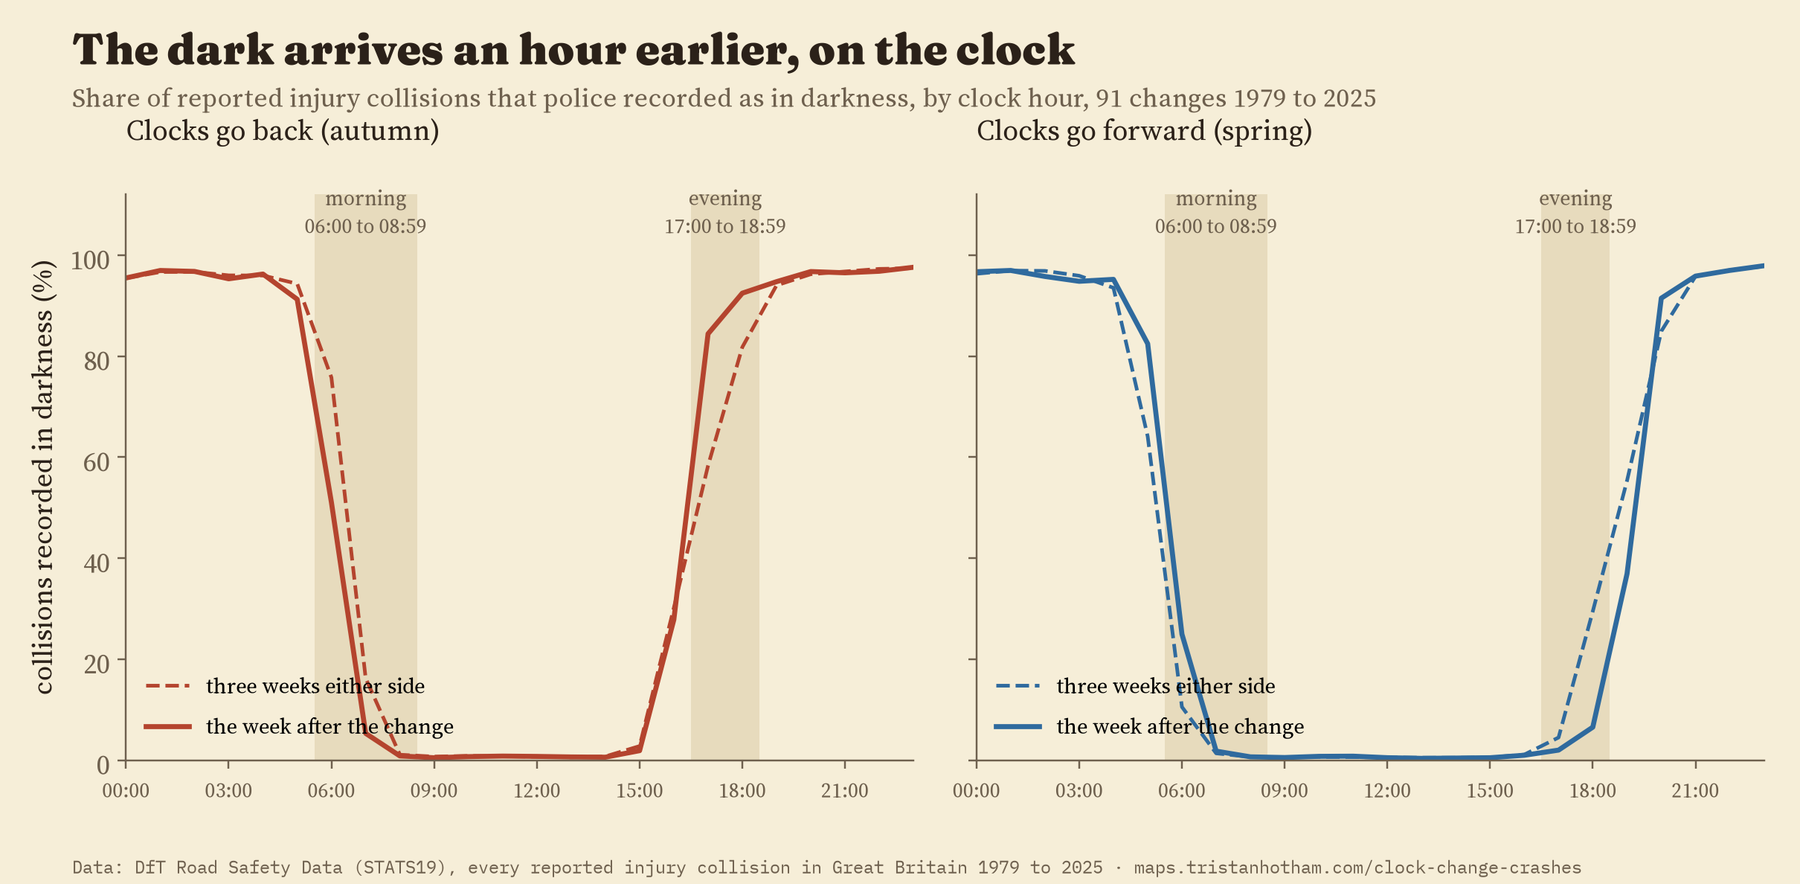
The collisions, though, hardly move with it. After the autumn change, collisions between five and seven rose 3.9% compared with the middle of the day. That is in the direction the dark predicts, but small. And after the spring change, when those same hours become light, their share rose too, by 2.9%, instead of falling. Put the two seasons together and the evening effect of darkness comes out at 0.5%.
One pattern does stand out, and I did not plan to look for it. Day by day, the evening rush hour’s share of collisions steps up on the very day the clocks go back, and then keeps climbing for weeks. Measured against only the three weeks before, the autumn evening rise is 19.5%, bigger than any ordinary week produces. But the same step appears in spring, when the evenings get lighter, so the dark cannot be the whole story. School holidays and changing routines around the change are just as likely. I count it as a clue, not an answer.
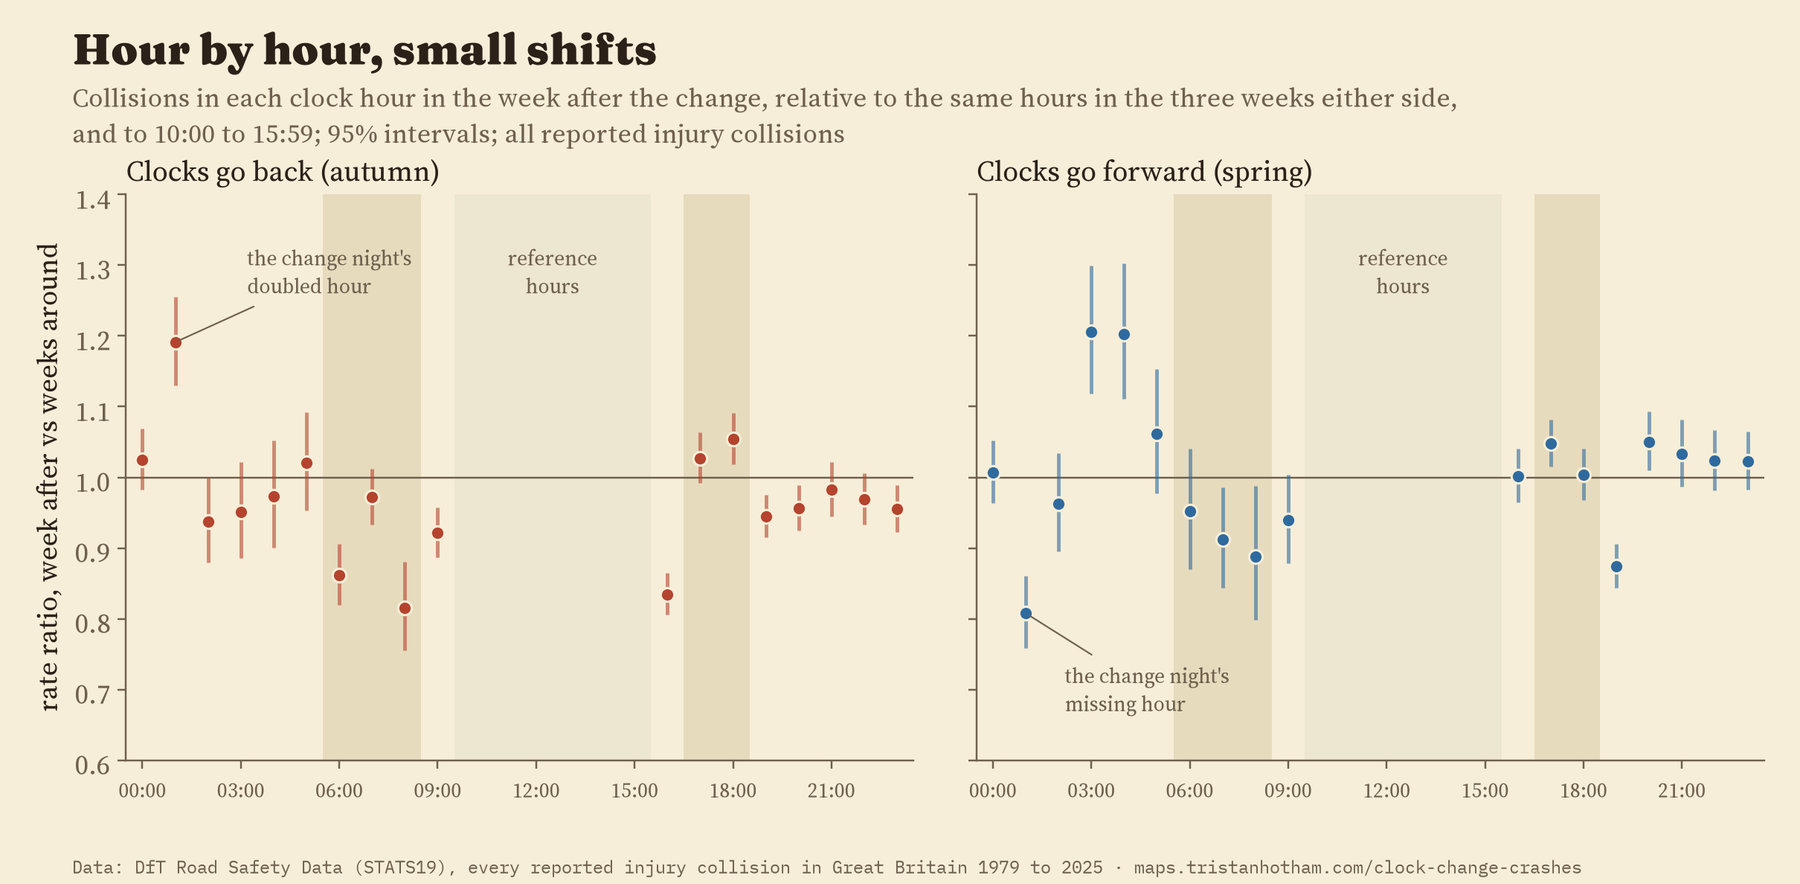
The autumn change pushes 88% of the evening rush hour’s collisions into the dark. The number of collisions barely notices.
Ordinary weeks do the same
How do I know a change of a few per cent is noise? I pretended the clocks had changed on ordinary Sundays instead, and ran exactly the same comparison: 29 weeks of the year, each pooled over the years. Ordinary Sundays move the following week’s collisions by up to about 4% either way. The real clock changes sit in the middle of them.
The one result that stands near the edge is for fatal collisions after the clocks go back: 4.2% higher, with an interval from -0.3% to 8.9%. Only 2 of the 29 ordinary weeks gave an estimate as large. That is worth watching, but on its own it is a hint, not a finding. After the clocks go forward, fatal collisions did not change at all (0.0%).
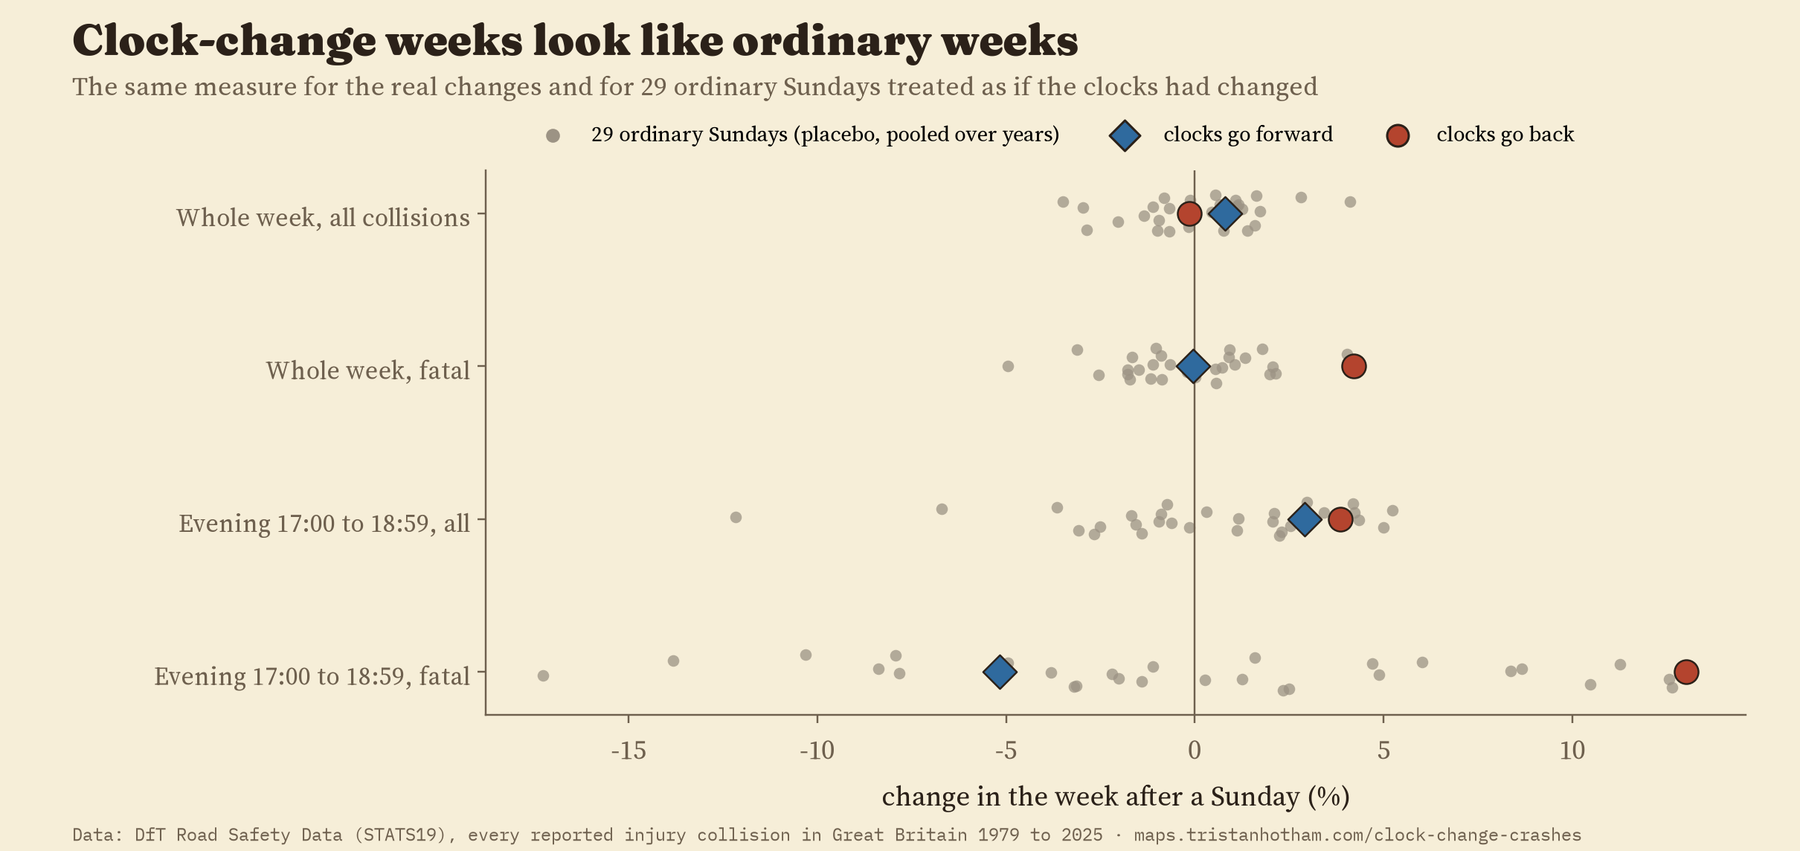
Ordinary weeks also shuffle collisions between hours by several per cent, because half terms, bank holidays and the end of the school year change when people travel. In 7 of the 29 ordinary weeks the evening shift was at least as large as after the autumn clock change.
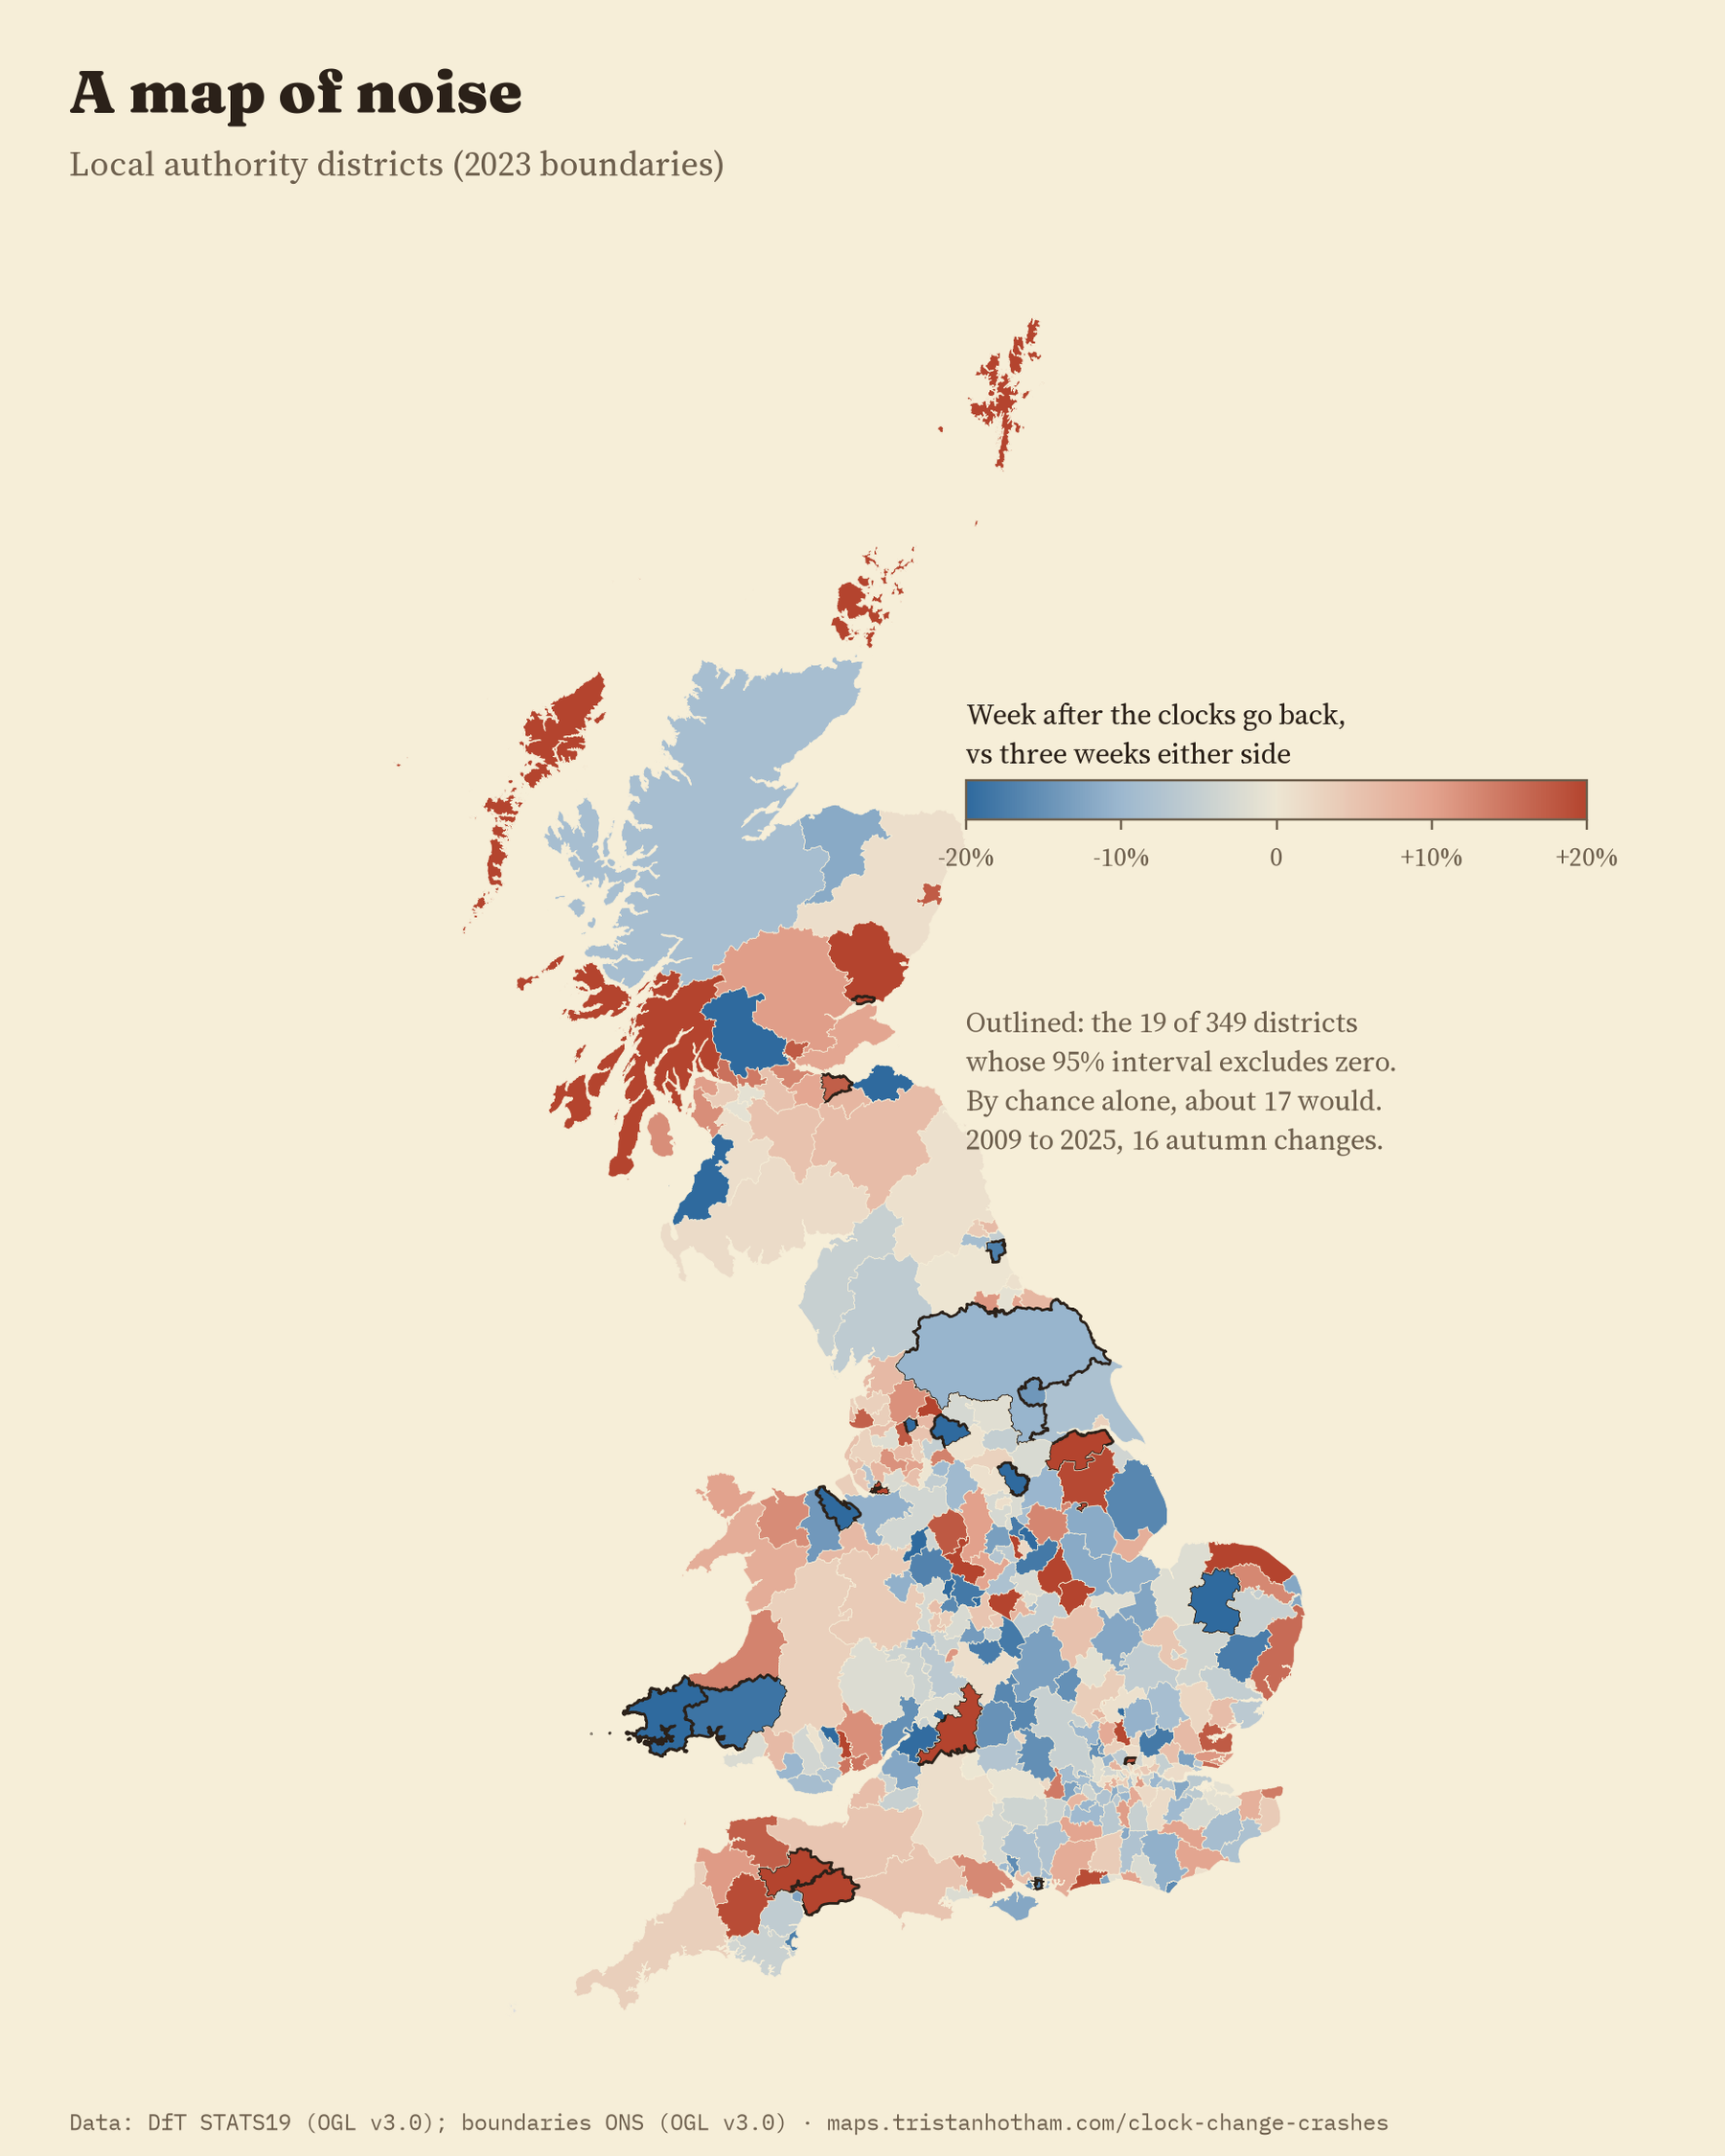
The same is true on the map. For each local authority district I compared the week after each autumn change with the weeks around it, from 2009 to 2025. 19 of 349 districts had a change clear enough to rule out zero, about as many as chance alone would produce (17). There is no part of Britain where the clocks stand out.
What this does and does not say
It says that the clock change itself, the jolt of moving an hour, is not followed by a measurable rise in reported road collisions in Britain. In the main comparison, any rise is smaller than about 3% of a week’s collisions.
It does not settle the bigger argument about lighter evenings. Between 1968 and 1971 Britain kept its clocks an hour ahead all winter, and the official review reported fewer casualties at the times of day affected, while warning that the crude figures needed to be treated with reserve. The breath test had arrived only a few months before the experiment began, which makes the comparison harder. Whether permanently lighter winter evenings would save lives is a question about the whole winter, not about one week, and it needs different methods.
It also counts collisions, not risk. If more people walk and cycle on light evenings, as other research has found, then more collisions in a light hour might simply mean more people out. And only collisions reported to the police are in the data.
How I did this
I took the clock change dates from the international time zone database rather than typing them in, because the rules have changed: before 1996 the autumn change usually came a week earlier than now. I reduced the collision records to counts by day, hour, severity and light, and wrote down the whole analysis plan before computing any count around a clock change: the comparison weeks, the hour groups, the changes to leave out, the placebo and the checks. The main models are Poisson regressions with a fixed effect for each change and weekday, or for each day, and intervals that allow for the two changes of the same year being related. I ran twelve planned checks, from different comparison weeks to separate decades and nations. Nearly all of them keep the whole week within about 3% of zero. Three had intervals that rule out zero. Comparing only with the weeks after gives a small autumn fall, which is what the seasonal drift predicts. Leaving out the springs with Easter in the change week gives a spring rise of 3.0%, so a small spring rise hidden by Easter holidays cannot be ruled out. And Scotland had 6.5% more collisions in the week after the clocks go back, from 2009 to 2025: one of fourteen results for the separate nations, and not one I had predicted. The full details are in the paper.
Notes and sources
- Collisions: Department for Transport, Road Safety Data (STATS19), every personal injury road collision reported to the police in Great Britain, 1979 to 2025, retrieved 2026. Open Government Licence v3.0.
- Clock change dates: the IANA Time Zone Database. District codes and populations: mySociety (CC BY 4.0). Boundaries: ONS (Open Government Licence v3.0). Base map: OpenFreeMap, OpenStreetMap contributors (ODbL).
- Further reading: R. Carey and K. Sarma, Impact of daylight saving time on road traffic collision risk: a systematic review, BMJ Open (2017); A. Smith, Spring forward at your own risk, American Economic Journal: Applied Economics (2016); J. Broughton, M. Hazelton and M. Stone, Influence of light level on the incidence of road casualties, Journal of the Royal Statistical Society A (1999); Home Office, Review of British Standard Time (1970).
- I wrote the text, with drafting and editing assistance from Claude (Anthropic), which also helped prepare the analysis code. I reviewed and checked all text and results.

