
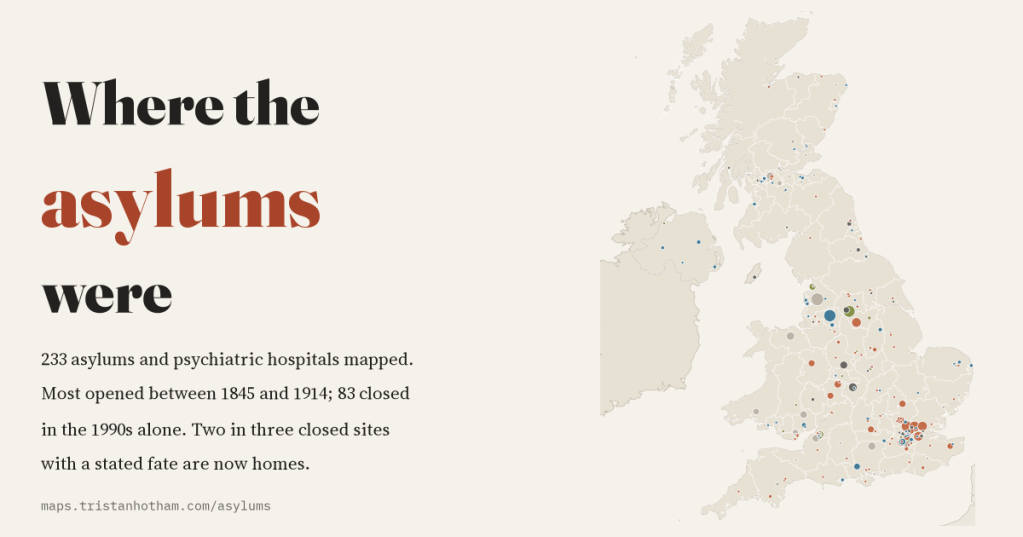
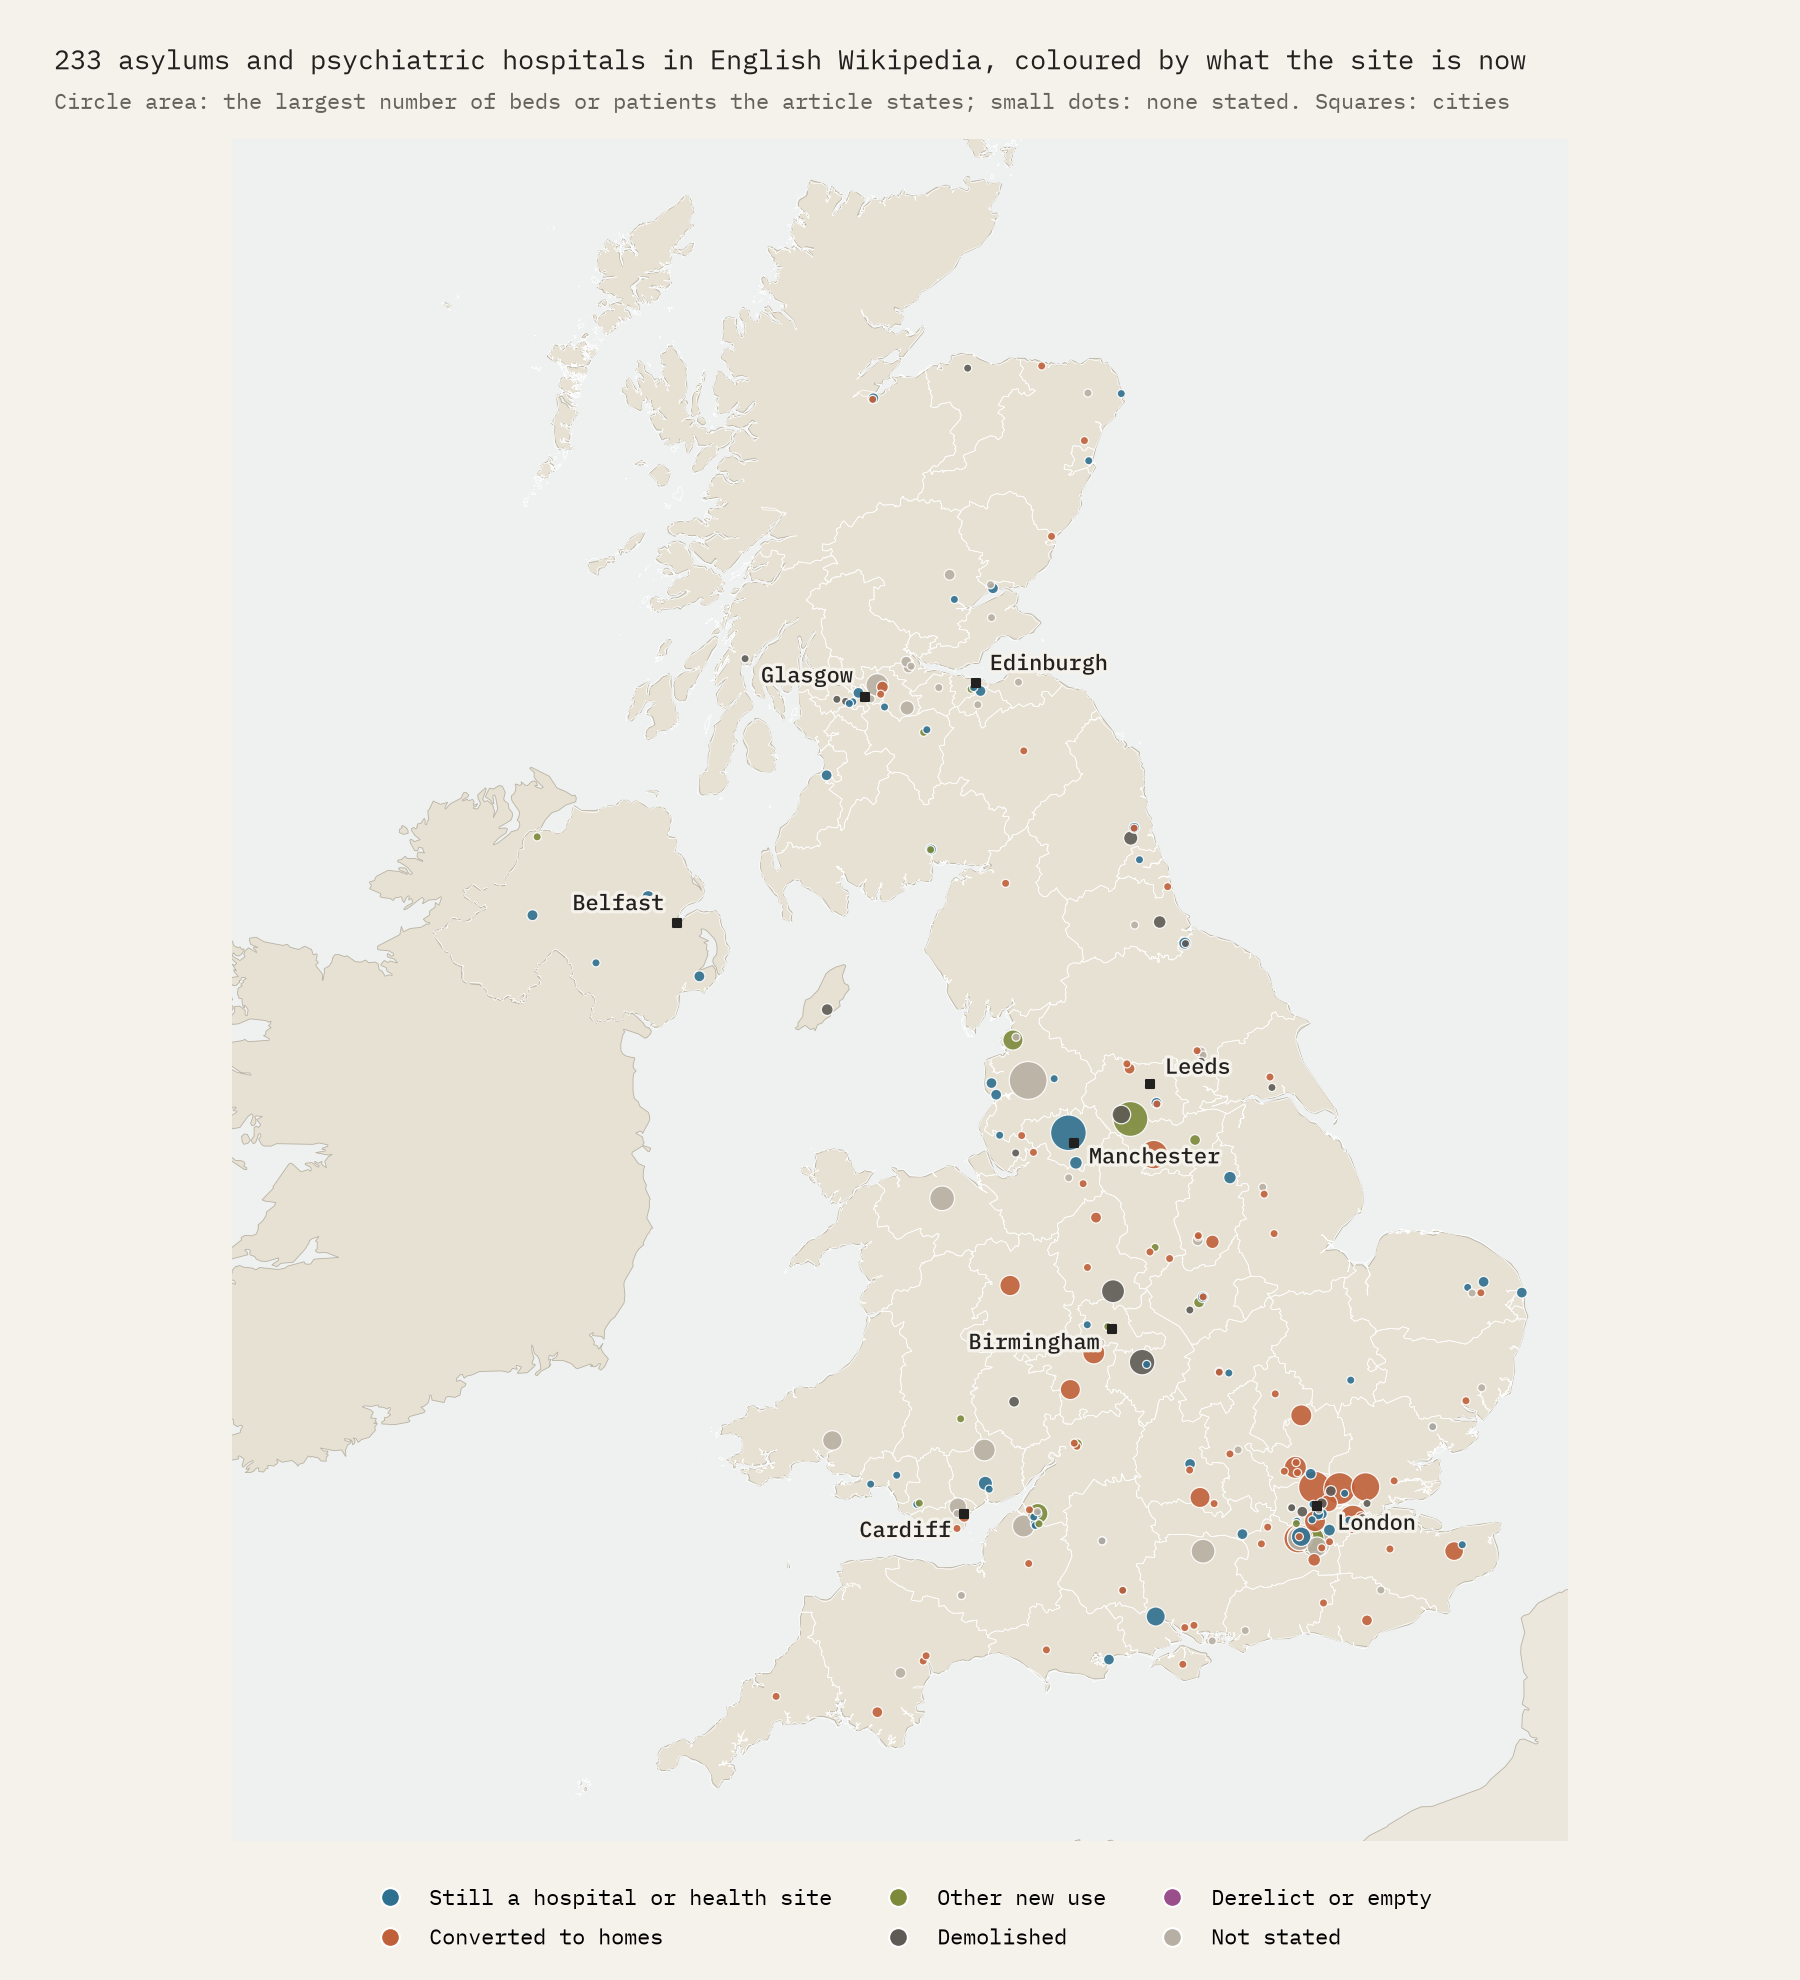
For a century and a half, a few miles outside almost every British county town stood an asylum: a vast building with its own farm, chapel and water tower. I mapped 233 of them from Wikipedia to see when they rose, when they fell, and what they have become.
Most people in Britain live within reach of a former asylum, even if they do not know it. The building might now be called something like Princess Park Manor or Virginia Park, and be full of flats. A century ago it would have held a thousand or two thousand patients, many of them poor, many there for most of their lives. This is a companion to my earlier study of what is left of the workhouse, and it asks the same kind of question: what can an open source tell us about a system that shaped so many lives?
The source is English Wikipedia. I walked its categories of psychiatric and defunct hospitals in the UK, found 659 articles, and kept the 244 that describe an asylum, a psychiatric hospital or an institution for people with learning disabilities. From each article’s infobox and opening text I read when it opened and closed, how big it was said to be, and what the site is now. It is not a complete list: not every asylum has an article, and the articles are uneven. But it is big enough to show the shape of the story.
Two waves of building
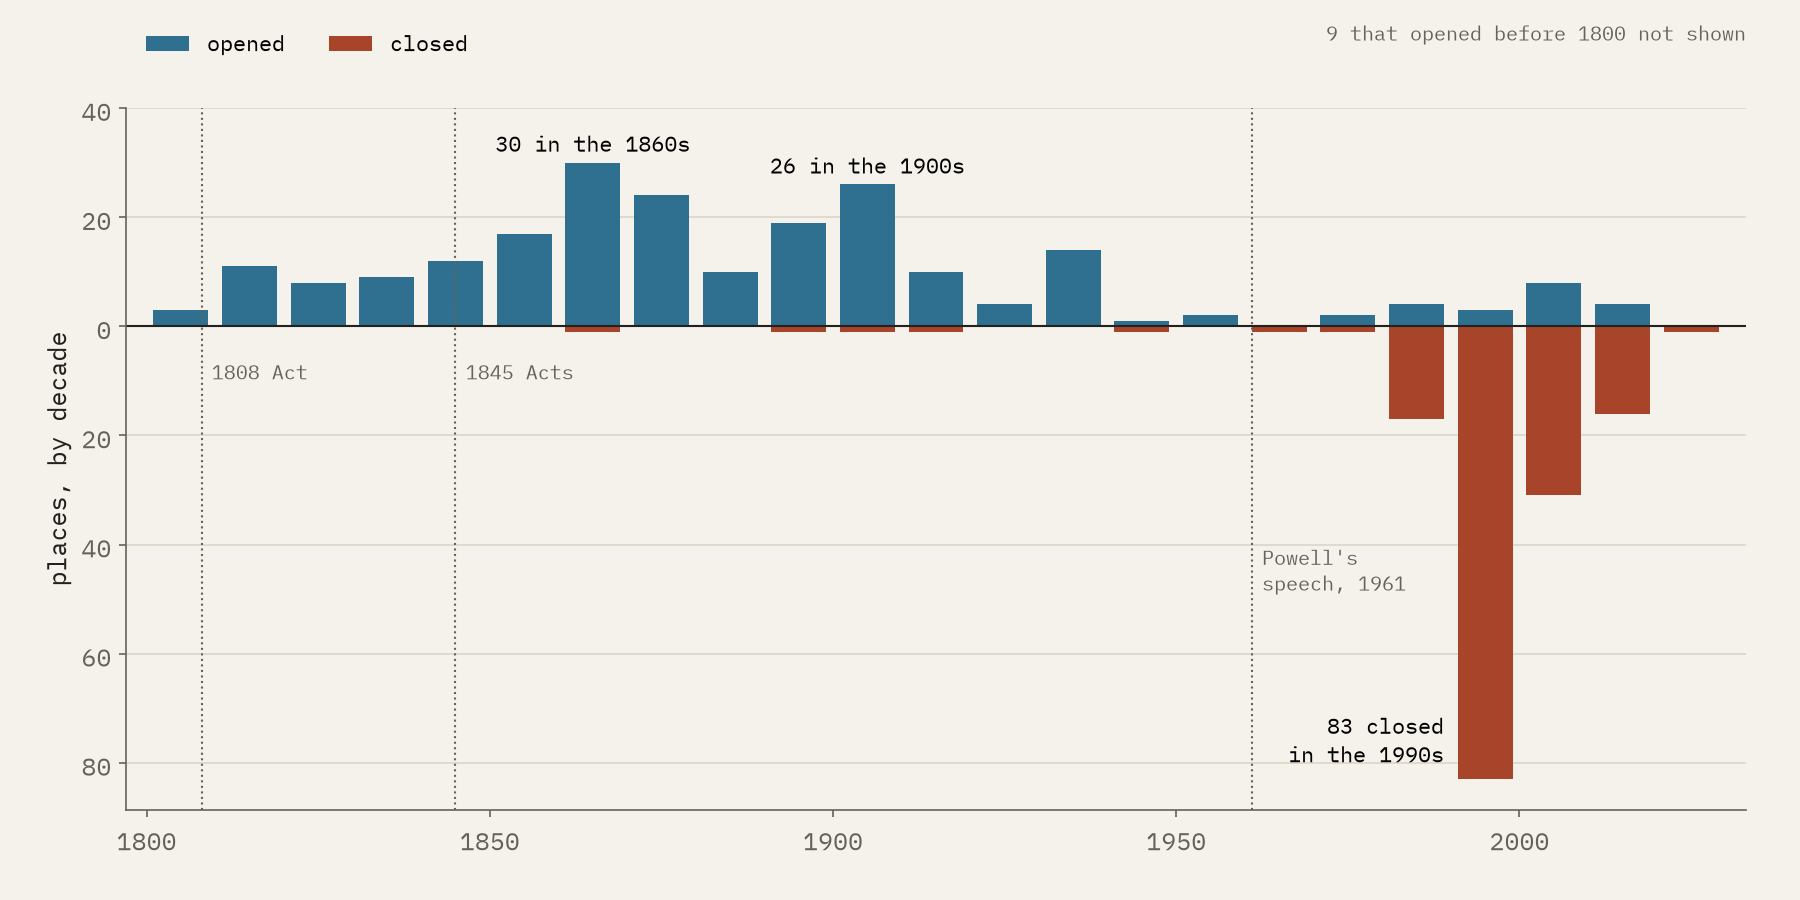
The County Asylums Act of 1808 allowed the counties of England and Wales to build asylums for “pauper lunatics”; it “permitted, but did not compel”, in Wikipedia’s words, and by 1827 only nine had opened. The Lunacy Act and County Asylums Act of 1845 changed that. In my data 31 places opened between 1808 and 1844, and 91 between 1845 and 1889, with the busiest decade the 1860s (30 openings). After a lull in the 1880s came a second wave around 1900, as the cities outgrew their first asylums: 19 in the 1890s and 26 in the 1900s. Then building almost stopped.
“There they stand”
In 1961 the Minister of Health, Enoch Powell, told a mental health conference what he thought of the old asylums: “There they stand, isolated, majestic, imperious, brooded over by the gigantic water-tower and chimney combined, rising unmistakable and daunting out of the countryside.” He wanted them gone. They proved hard to shift. In my data 198 places were open in 1961 and still 198 in 1980; only 2 closed in the two decades after the speech. Then Care in the Community arrived, and 17 closed in the 1980s, 83 in the 1990s and 31 in the 2000s. 64% of every dated closure fell between 1980 and 1999.
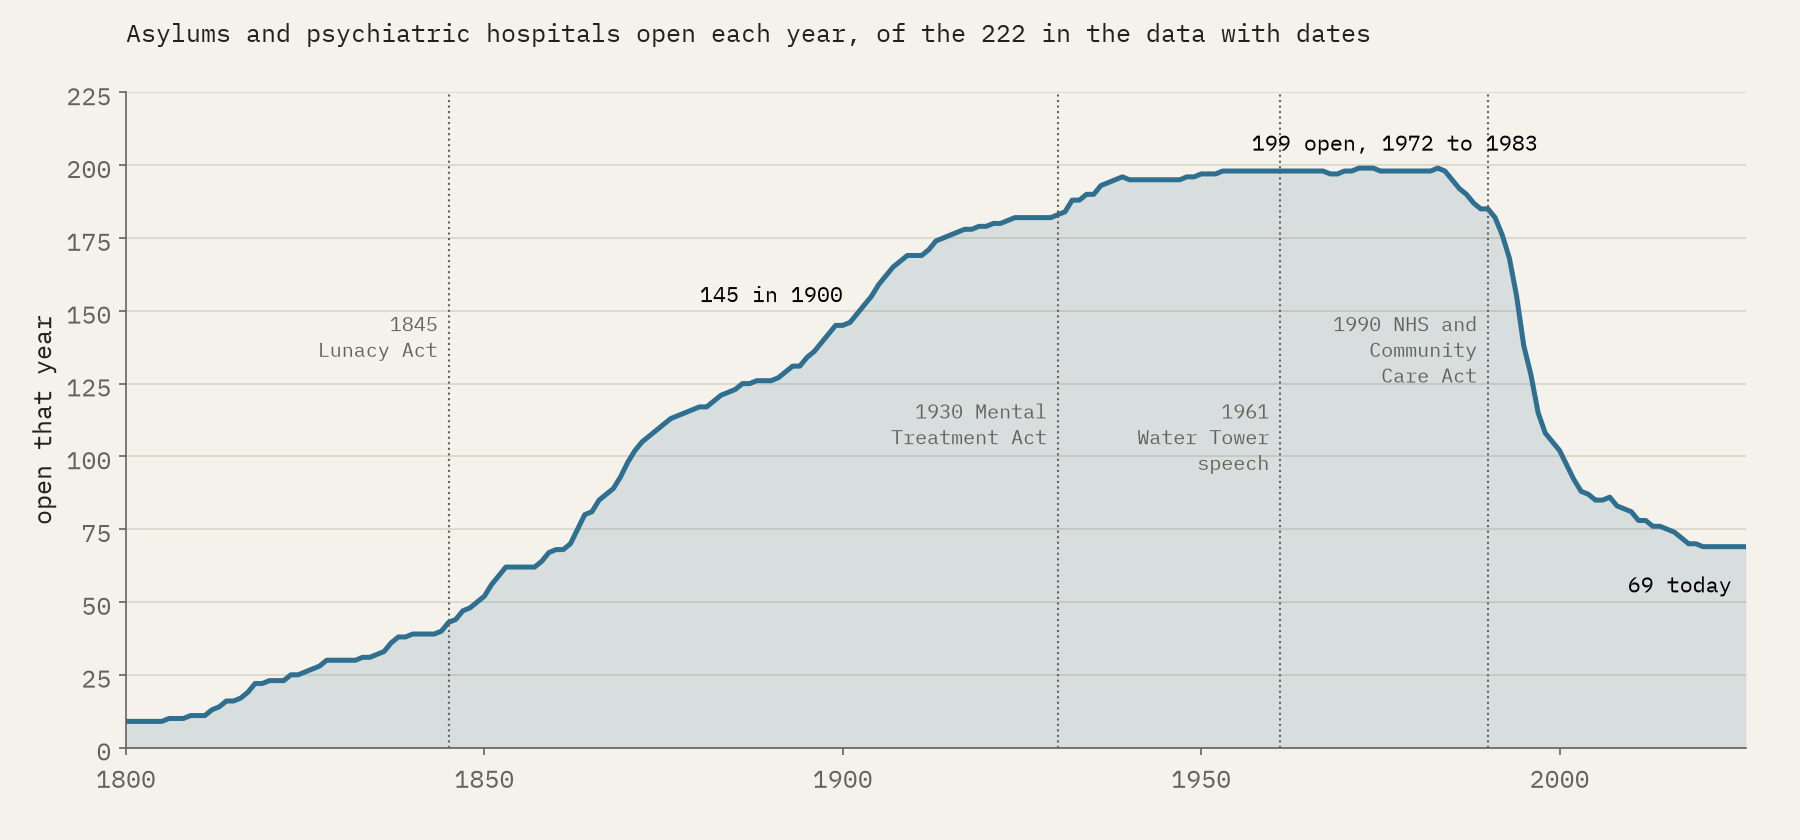
The Victorian asylums in my data lasted a median of 126 years. 78% of them lasted a century or more.
Small towns of their own
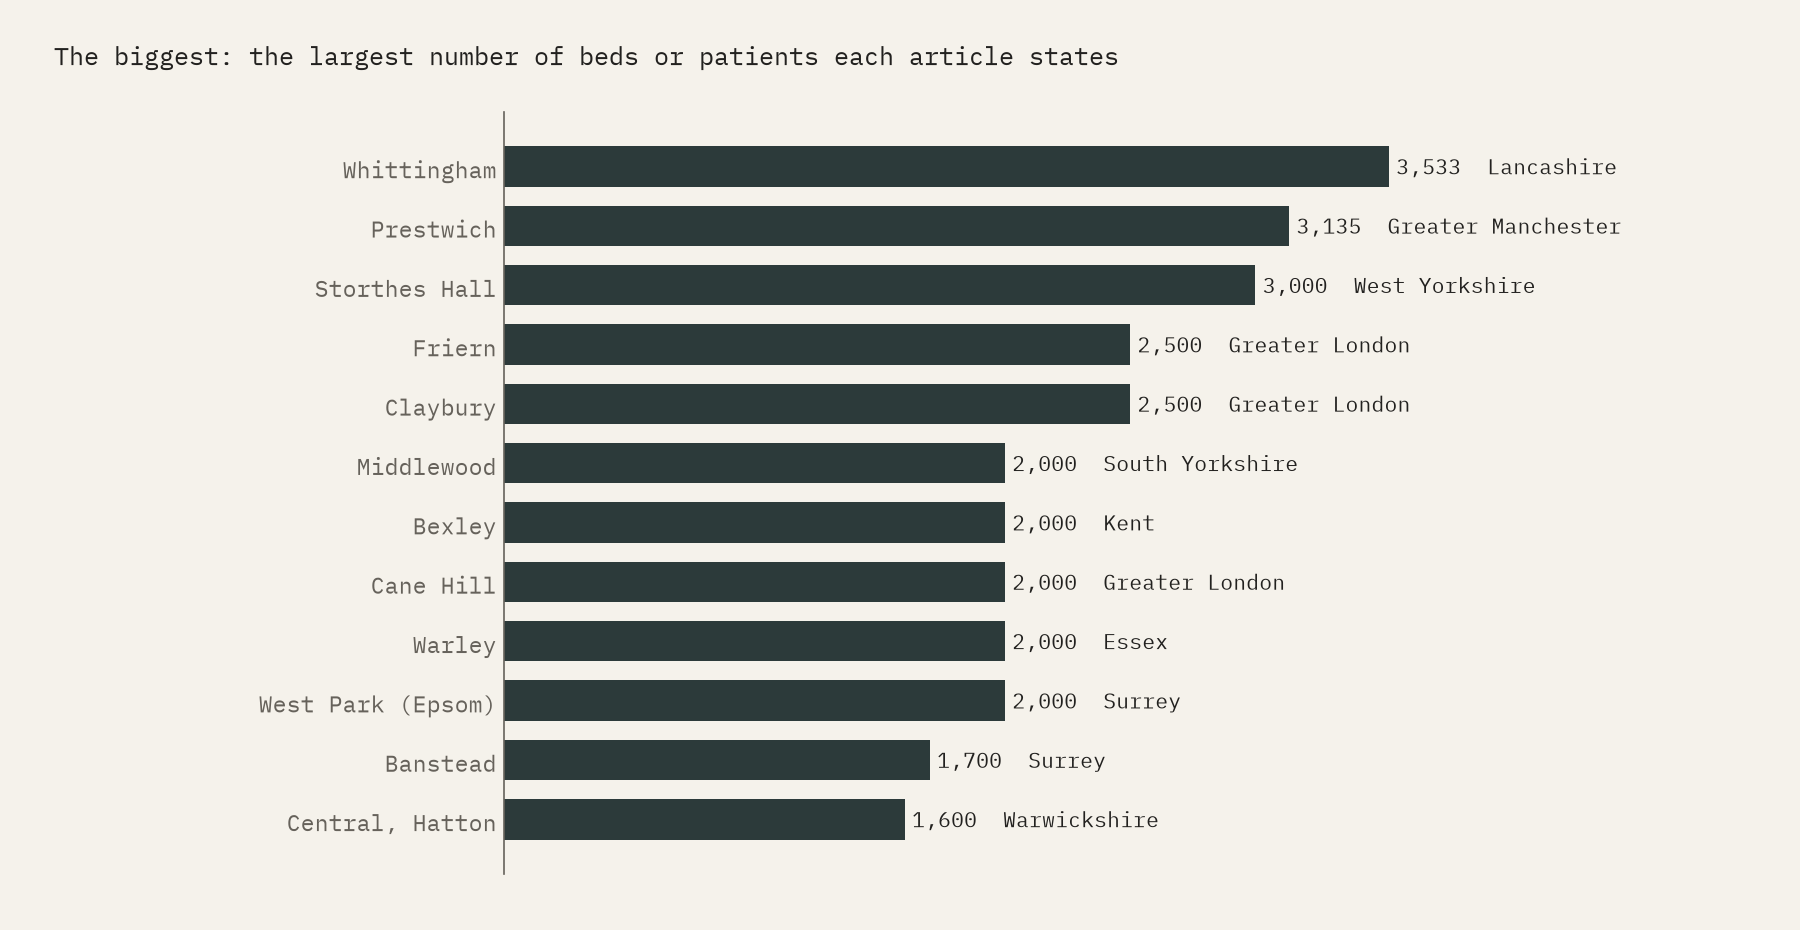
Asylums were enormous. 30 places in my data state a size of a thousand or more at some point, and 10 two thousand or more. The largest is Whittingham, near Preston, with 3,533 patients in 1939; its article calls it the largest mental hospital in Great Britain. Prestwich, near Manchester, held 3,135 by 1903. These figures come from different dates and are not exact comparisons, but they give the scale: villages of patients and staff, with farms, laundries and cemeteries.
London’s ring
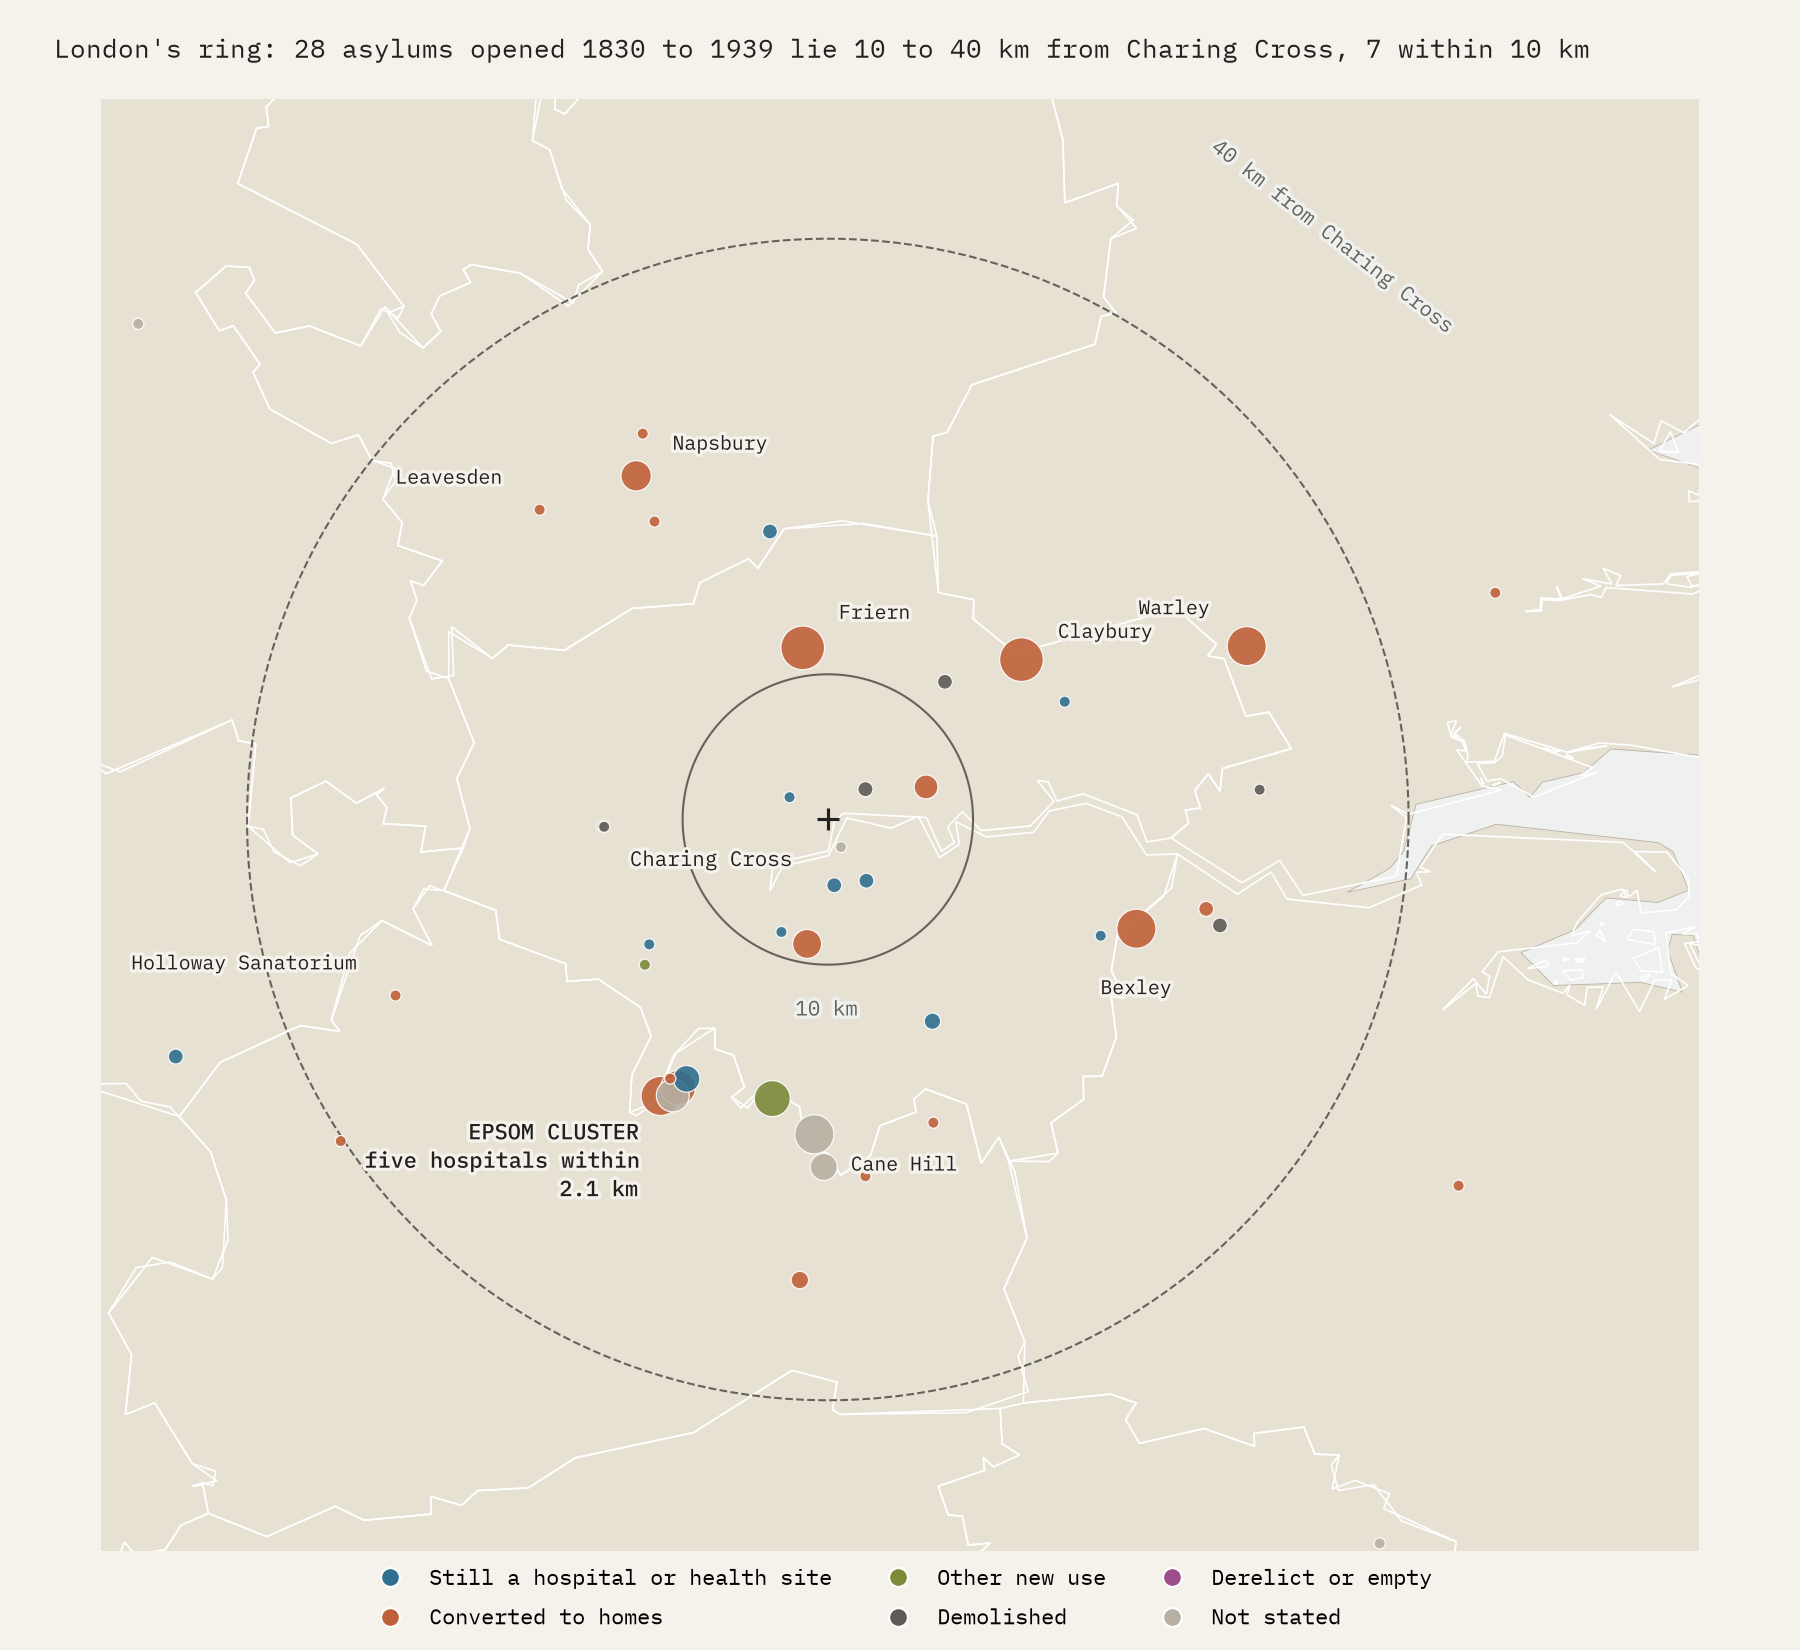
London built its asylums out of town. Of the places in my data that opened between 1830 and 1939, only 7 lie within 10 km of Charing Cross, against 28 between 10 and 40 km out, in Surrey, Hertfordshire, Kent, Essex and the outer edge of today’s Greater London. The tightest knot is at Epsom, where the London County Council built five hospitals on the Horton estate between 1899 and 1921, all within 2.1 km of each other. Most of the ring is now housing.
What they became
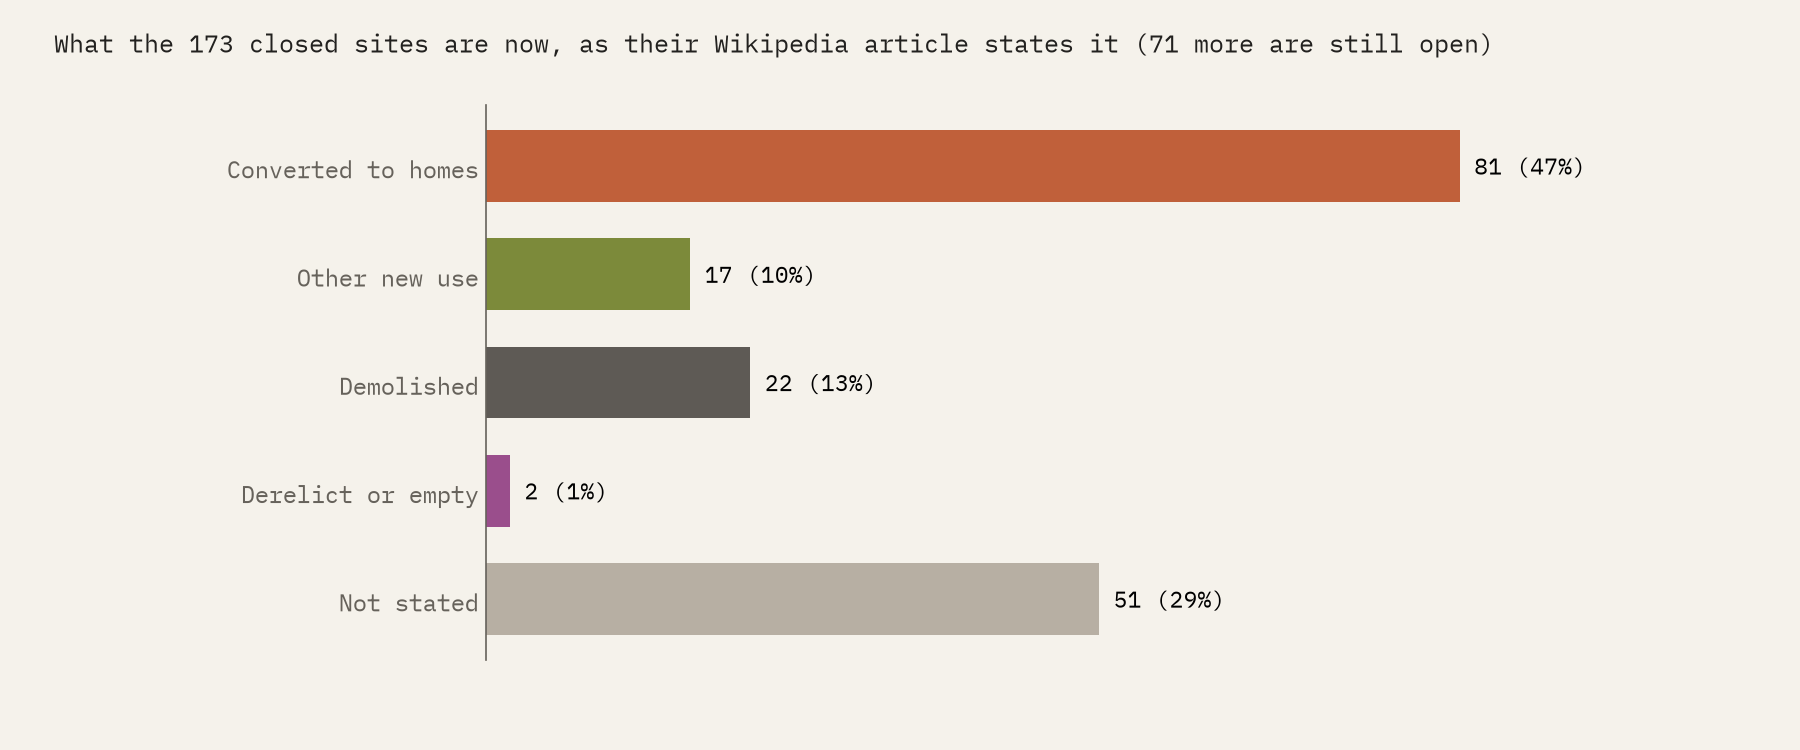
I read what each site is now from the words in its article: “converted into apartments”, “redeveloped for residential use”, “demolished” and so on. Of the 173 places that are no longer open, 81 are now homes, in the old buildings or in new housing on the grounds; 17 have another use, such as a university campus, offices or, at Banstead and Parc, a prison; 22 are recorded as demolished with nothing said about the site since; and 51 articles do not say. Of the closed sites whose fate is stated, 66% are homes. Many keep their buildings: 34% of the articles mention a listed building, and three are Grade I.
The names changed as often as the uses. 141 of the articles record a name with “asylum” in it and 82 a “mental hospital” name, the term the Mental Treatment Act of 1930 made official. Exminster in Devon is typical: Devon County Lunatic Asylum, then Devon Mental Hospital, then Exe Vale Hospital, and now apartments.
How I did this
Everything comes from English Wikipedia, read with rules I publish with the data. An article counts if it describes a single place and calls it an asylum, a psychiatric or mental hospital, or an institution for people with learning disabilities, in its opening sentences, its infobox or its categories. Years come from the infobox, or from phrases such as “opened in 1851”. Sizes are the infobox beds figure or the largest capacity the text states, at whatever date it gives. What a site is now comes from keywords, and each assignment is published with the phrase that set it, so you can check it. Only the opening text of each article was available, so the later history is often missing. The paper sets out every step and caveat. A note on words: I use the historical names because they are part of the record, not because they are how anyone should be described today.
Notes and sources
- English Wikipedia contributors, articles in the categories Psychiatric hospitals in the United Kingdom, Former psychiatric hospitals in the United Kingdom and Defunct hospitals in England, Scotland and Wales, and the articles on the County Asylums Act 1808, Lunacy Act 1845, Mental Treatment Act 1930, Care in the Community, Enoch Powell, Epsom Cluster and Whittingham Hospital, revisions of 2026, CC BY-SA 4.0.
- Natural Earth coastline and towns (public domain); ONS and OSNI county outlines (Open Government Licence).
- I wrote the text, with drafting and editing assistance from Claude (Anthropic), which also helped prepare the analysis code. I reviewed and checked all text and results.

