
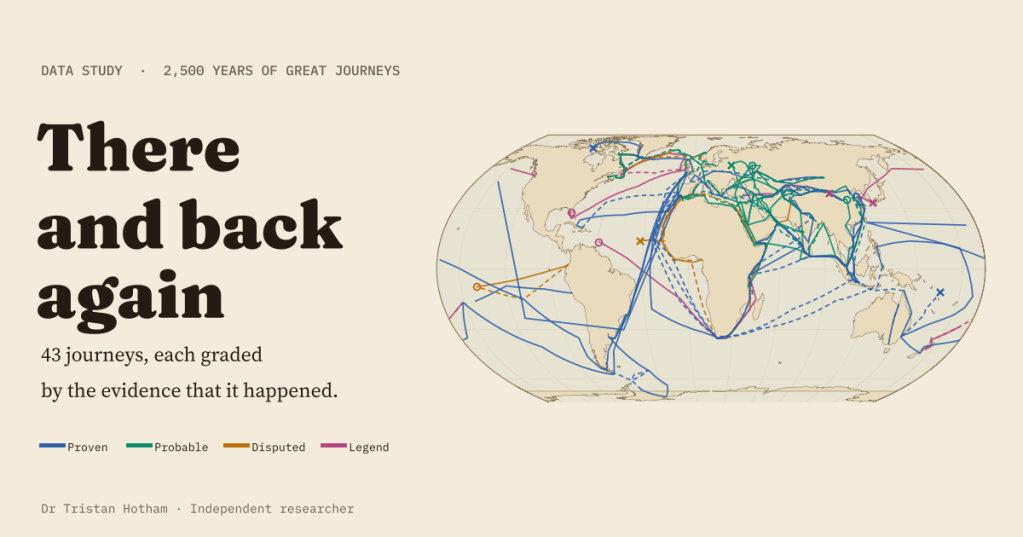
A line on a map looks like a fact, whether it stands for a ship’s log or a story told two centuries later. I mapped 43 great journeys from about 600 BC to 1947, out and back, and graded each one by how sure we can be that it happened.
Some journeys are as certain as anything in the past. Amundsen left a tent at the South Pole with a letter for the King of Norway inside it, and Scott’s party found it 34 days later. Others rest on a single sentence. Herodotus heard that Phoenician sailors went all the way round Africa for the pharaoh Necho. Mansa Musa told an official in Cairo that his predecessor sailed into the Atlantic with a great fleet and never came back. St Brendan’s voyage survives as a wonder tale in which the monks land on a giant fish.
Popular maps of exploration tend to draw all of these in the same confident ink. I wanted a map that shows how we know, as well as where they went. And I wanted it to answer the question every traveller’s family must have asked: did they come back?
Forty-three journeys, four inks
I chose 43 journeys: the famous voyages (Columbus, da Gama, Magellan and Elcano, Cook, Zheng He’s treasure fleet), envoys and pilgrims (Zhang Qian, Xuanzang, Ibn Fadlan, Marco Polo, Rabban Bar Sauma, Ibn Battuta), the Norse crossings to North America, Antarctic and Australian expeditions, lost expeditions, and a handful of beautiful legends. Each route is a chain of named stops, 405 in all, taken from the English Wikipedia article about the journey, with the article, the section and the source of every stop’s coordinates recorded.
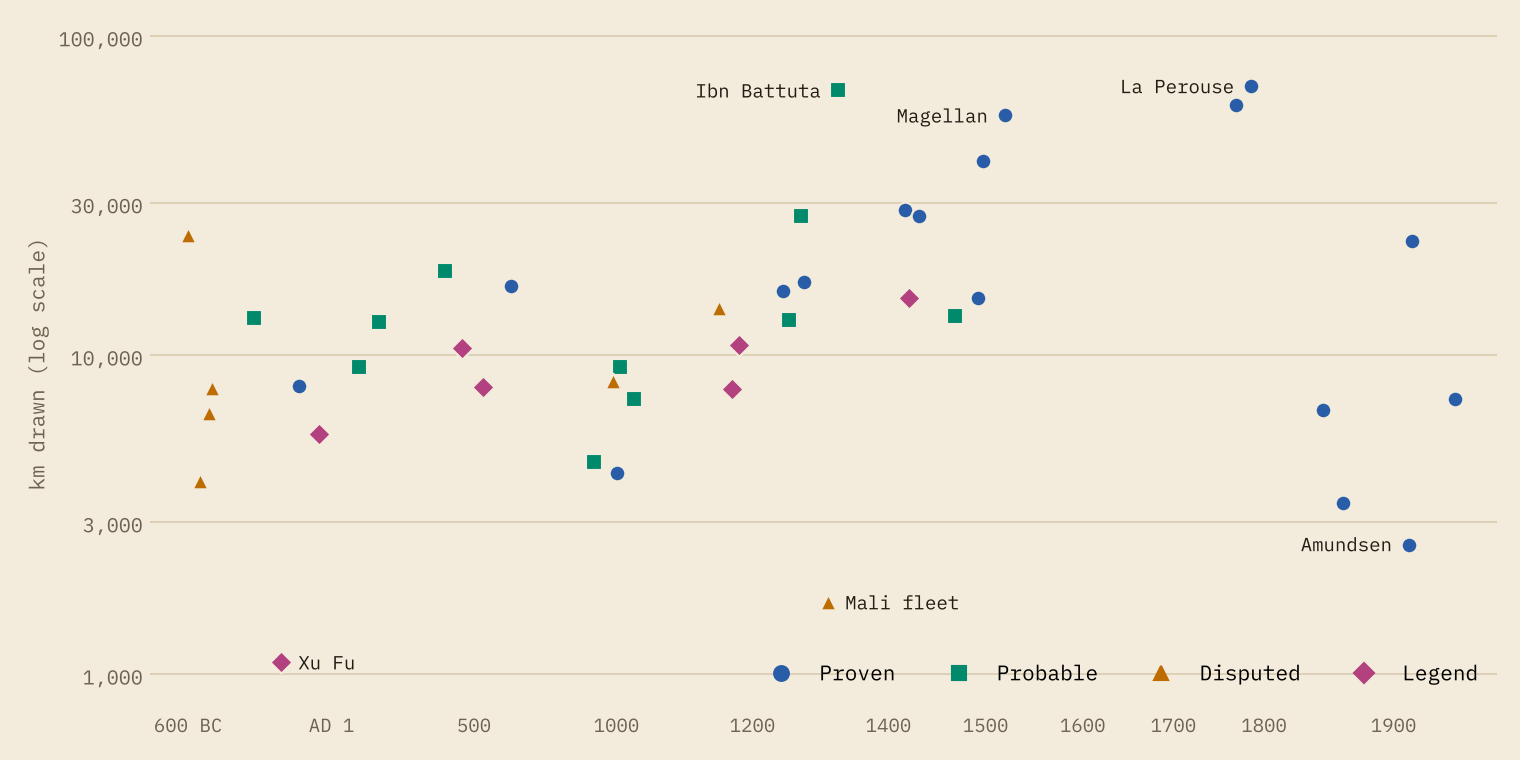
Then I graded each journey. Proven means archaeology, physical remains or several independent records. Probable means one good written source with nothing serious against it. Disputed means scholars seriously argue over whether, or how far, it happened. Legend means myth, oral tradition or modern speculation. The result: 18 proven, 11 probable, 7 disputed and 7 legends.
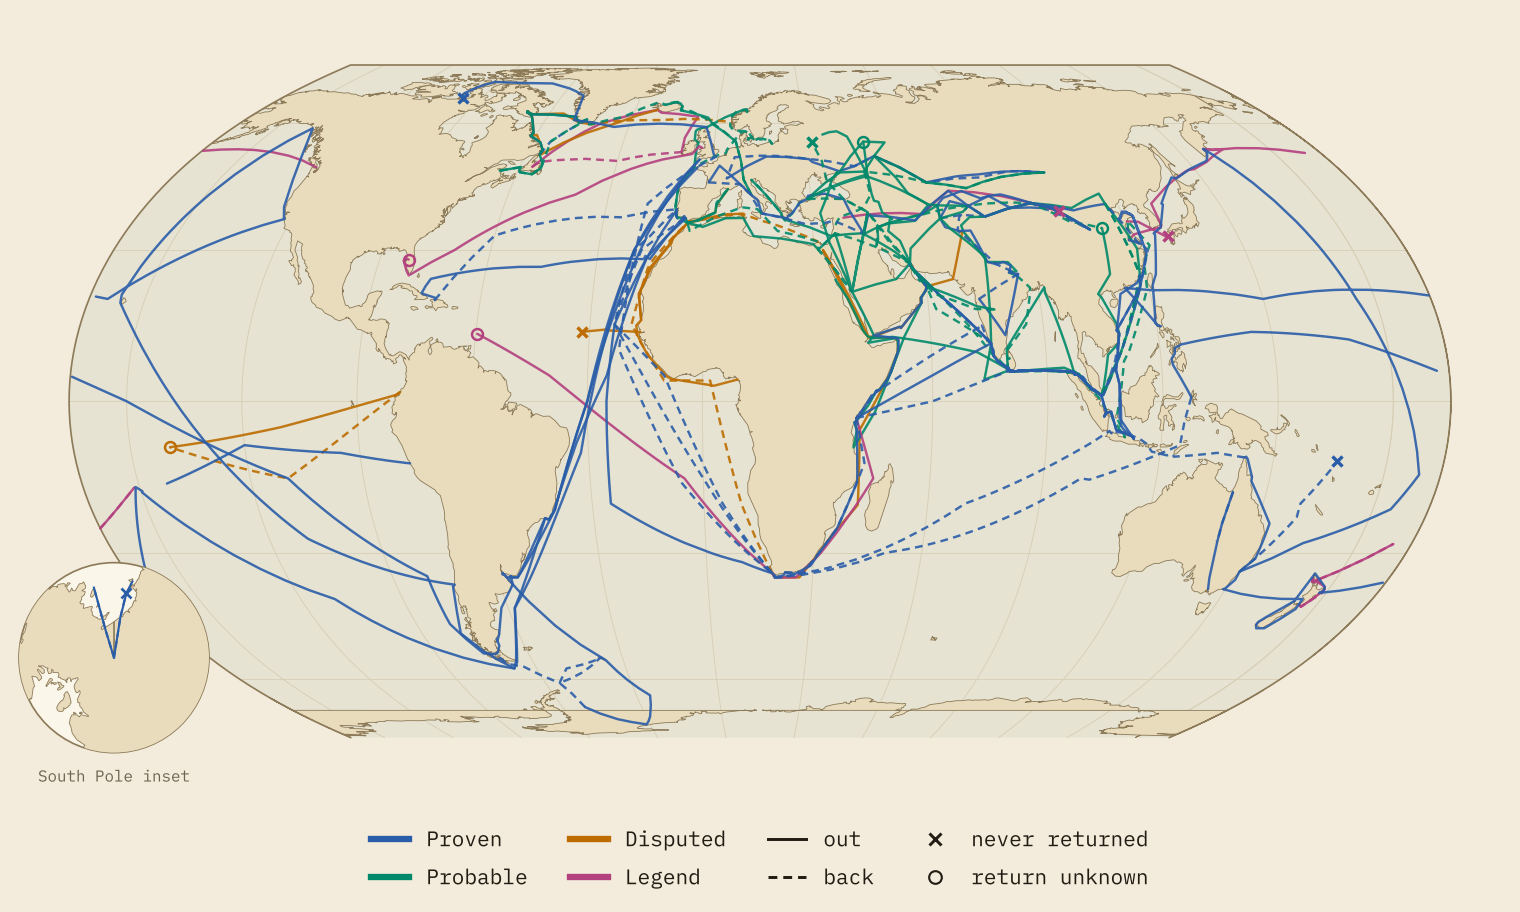
Altogether the routes add up to 725,858 km of drawn line. The longest single journey is La Perouse’s lost expedition, at 69,705 km before it vanished in the Pacific. Close behind is Ibn Battuta’s great circuit of 1325 to 1349, at 67,563 km drawn, which is longer than any voyage on the map before La Perouse’s.
The further back, the thinner the evidence
The grades are not spread evenly through time. Before AD 500, just 1 of 12 journeys is proven. Between 500 and 1449 it is 6 of 19. Between 1450 and 1799 it is 5 of 6, and from 1800 all 6 are. Put the line at 1450 and the contrast is stark: 7 of the 31 earlier journeys are proven, against 11 of the 12 later ones. Every one of the 7 legends, and every disputed journey, begins before 1450.
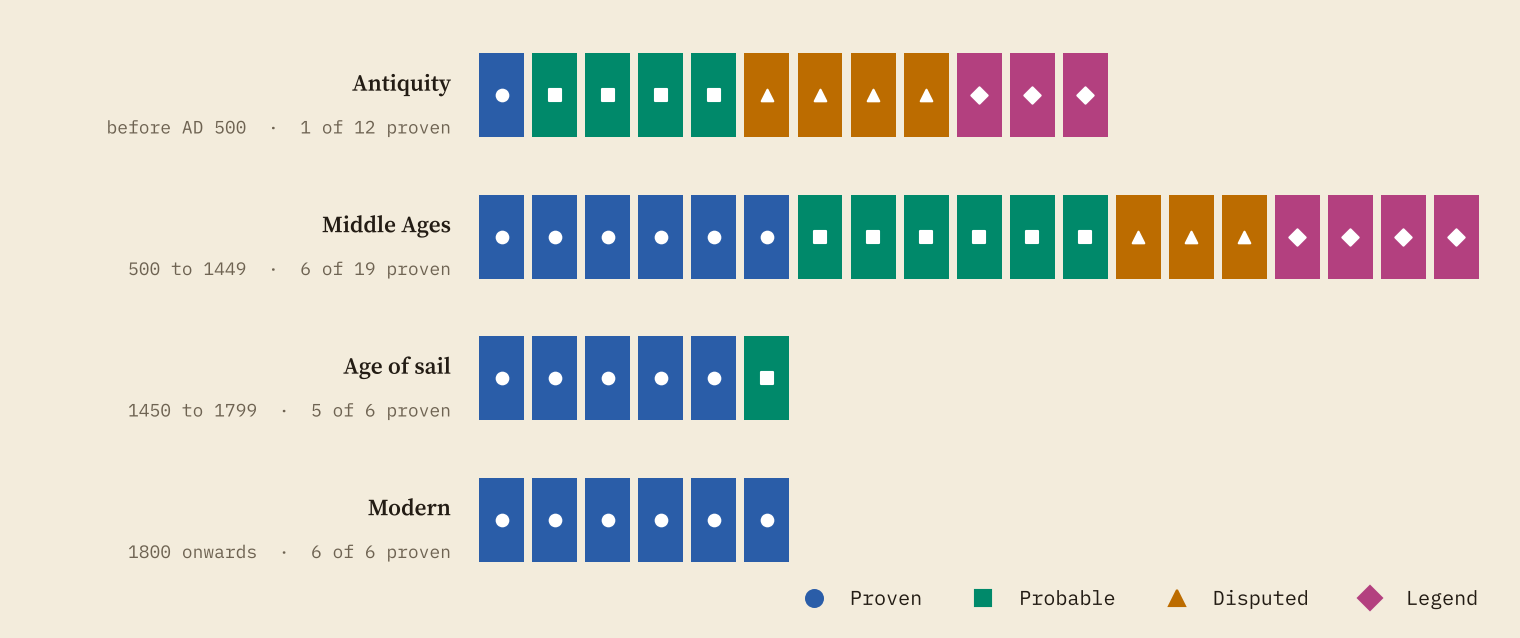
This is not a verdict on ancient travellers, many of whom certainly went very far. It is about what survives. An ancient journey is usually known from one narrative, often written long afterwards by someone who was not there. Early modern voyages left logs, letters, official inquiries and, for the lost ones, wrecks and graves. Franklin’s expedition never came home, yet we can follow it through the Victory Point note, Inuit testimony, graves on Beechey Island and King William Island, and the wrecks of Erebus and Terror.
Weak evidence, wobbly routes
A weaker grade does not only mean less certainty that a journey happened. It also means less certainty about where it went. I rated every stop as known, approximate or conjectural. On proven journeys only 3% of stops are conjectural. On probable journeys it is 13%, on disputed journeys 48%, and on legends 62%.
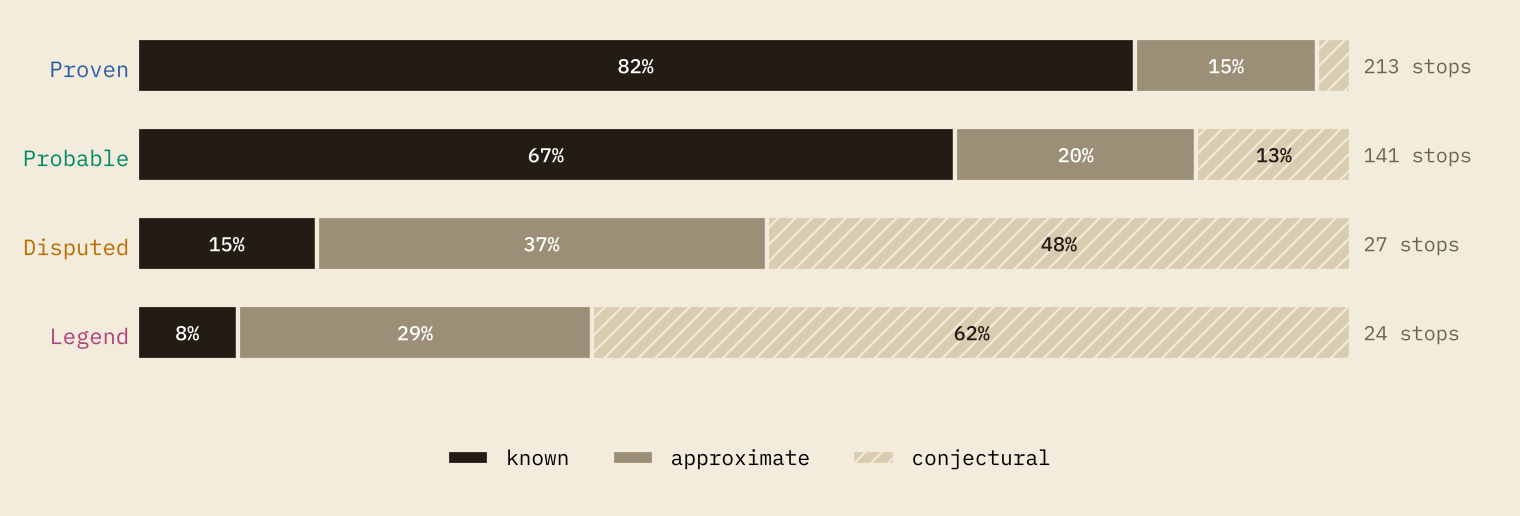
Measured by distance, 91% of the line on an average proven journey runs between stops that are known or approximately placed. On a legend it is 8%. The rest of a legend’s line joins one guess to another. Brendan’s North American landfall and Madoc’s “Terra Florida or thereabouts” are interpretations, not places, so drawing them in the same ink as Cook’s arrival at Botany Bay hides a real difference.
On a proven journey, 3% of stops are guesses. On a legend, 62% are.
Did they come back?
22 of the 43 parties came home whole, at least as their sources tell it. In 9 more, some came back and some did not, and these include the most famous voyages of all. Of roughly 170 men with da Gama, about 55 came home. Magellan was killed at Mactan, and 18 men returned with Elcano on the Victoria. Of the four men of Burke and Wills who reached the Gulf of Carpentaria, only John King made it back. 7 parties never returned, and for 5 nobody knows.
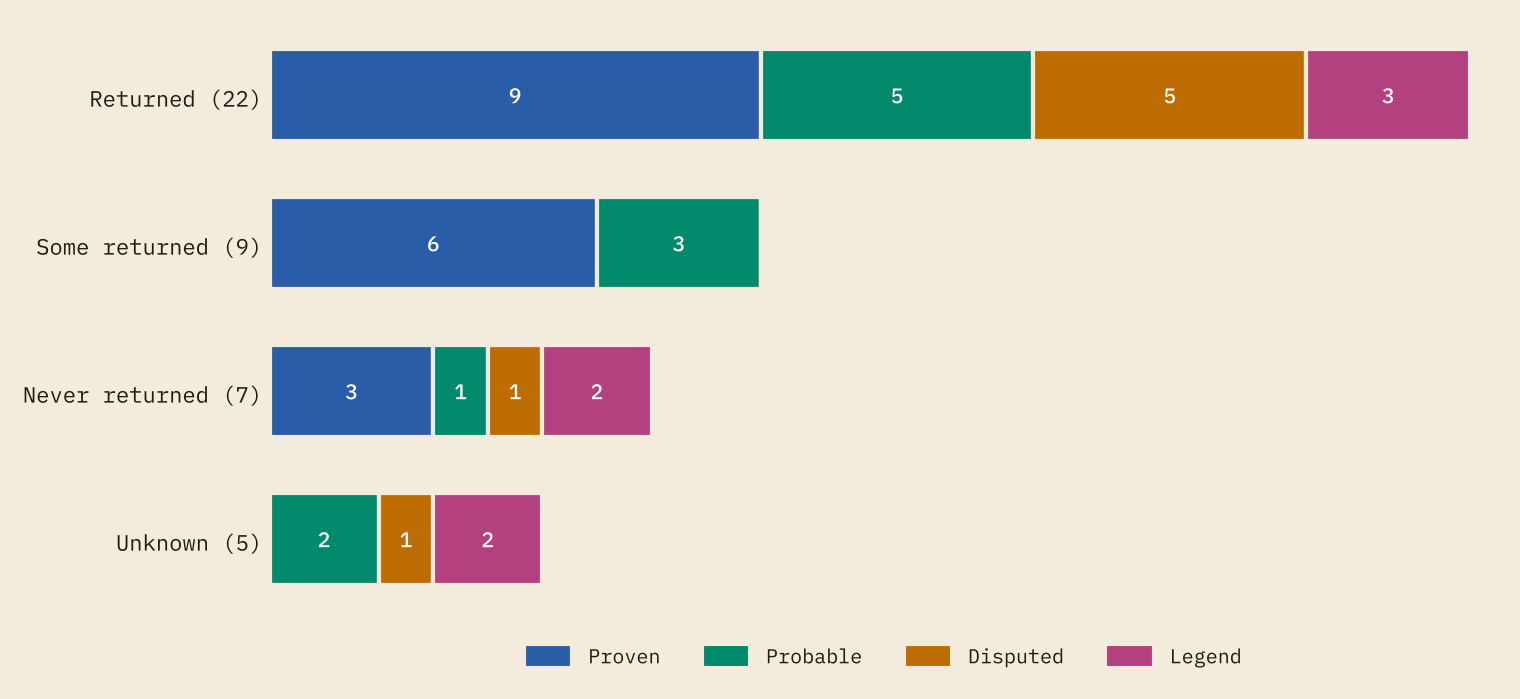
Coming back is usually how a journey becomes known, which makes the “never returned” group revealing. Its proven members, Franklin, La Perouse and Scott, are known through what was found afterwards. Two of its members are legends whose whole point is that nobody came back: Xu Fu, who sailed east to find the elixir of life, and the “lost legion” of Roman prisoners supposed to have ended up in China. And the Atlantic fleet of Mali is known only because the king who succeeded its leader explained how he came to the throne.
How fast is a sailing ship?
Where an article gives a date at both ends of a stretch, I can work out a pace. There are 21 such passages. Ships under sail made a median of 128 km a day, but the range, from 45 to 185, is mostly the wind. Da Gama crossed from Malindi to Calicut in 26 days with the monsoon behind him. Coming back, he set out too early and took 96 days, and about half his crew died on the crossing.
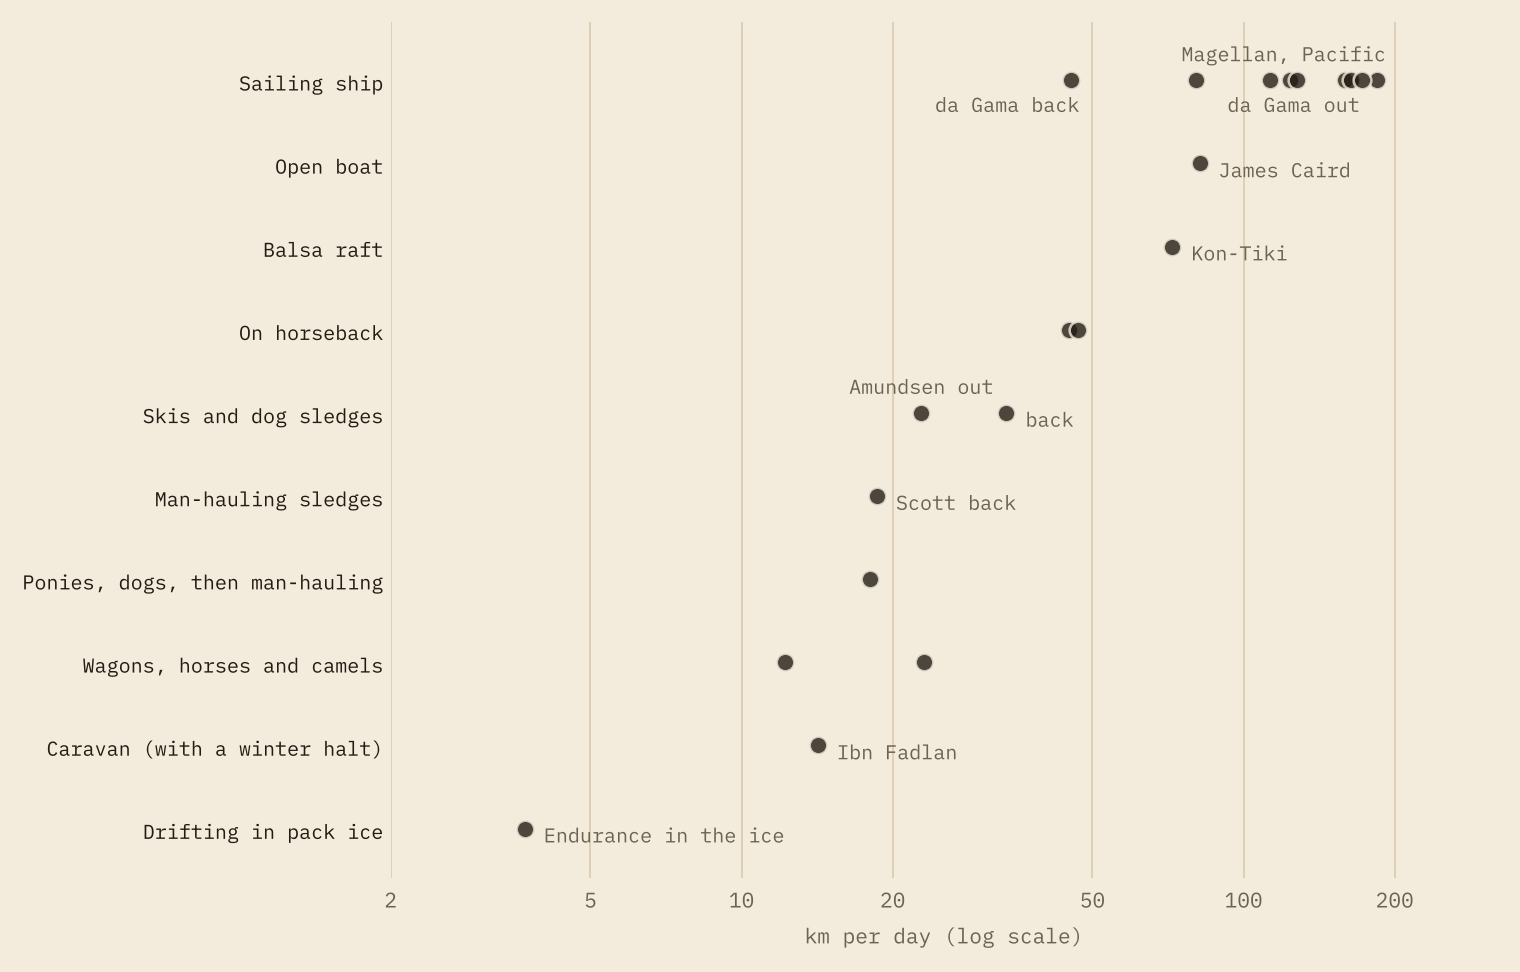
Friars riding across the steppe to the Mongol court averaged 45 to 47 km a day, not far off Kon-Tiki drifting across the Pacific (72) or Shackleton’s open boat, the James Caird, on its way to South Georgia (82). The slowest passage on the map is Endurance herself, carried through the Weddell Sea in the pack ice at 3.7 km a day for 281 days.
The two polar parties show how little pace explains on its own. Amundsen’s dog teams went out at 22.8 km a day and came home faster, at 33.7. Scott’s party, hauling their own sledges, made 18.0 km a day out and 18.6 on the way back, until a blizzard pinned them down eleven miles short of a depot. The speeds were close. The margins of food, fuel and health were not.
Mirror journeys
Putting everything on one map throws up some lovely pairs. Gan Ying set out for Rome from the Han frontier in AD 97 and turned back at the sea; in AD 166 men claiming to come from Rome reached the Han court from the other direction. Rabban Bar Sauma, a monk from Beijing, met the pope and the kings of France and England while Marco Polo was in China. Zheng He’s fleet called at Calicut and Malindi in 1418 and 1419, and eighty years later da Gama arrived at the same two ports from the other side of the world.
How I did this
For each journey I read the English Wikipedia articles (42 in all) for the route, dates, evidence and debates, and listed the stops they name, in order. Coordinates come from each place’s own Wikipedia article (128 stops), from the GeoNames gazetteer where the article names a region or an old site (258, using a nearby town that I note), or from positions given in the article text (19). Sea legs are routed round land on a half-degree grid from Natural Earth; land legs are great circles. Where an article states a distance, my drawn routes come to 71% to 116% of it in 6 comparable cases.
Some honest caveats. The grades are my judgements, and I give the reason for every one; reasonable people would move Marco Polo, or Polynesian contact with South America, which genetics now makes very likely. The selection is mine, not a sample. The lines show the order of places, not real tracks, and ignore winds and currents. And Wikipedia is the source for most facts, with all of its strengths and gaps.
Notes and sources
- Routes, dates, evidence and debates: English Wikipedia articles on each journey and traveller (CC BY-SA 4.0), read in October 2026 and listed per journey and per stop in the data.
- Place coordinates: Wikipedia article coordinates via the MediaWiki API, and GeoNames cities1000 (CC BY 4.0).
- Coastlines and sea routing: Natural Earth 1:50m countries (public domain).
- Polynesian contact: Ioannidis, A. G. and others 2020, Native American gene flow into Polynesia predating Easter Island settlement, Nature 583.
- Paper, data and code: Zenodo and GitHub. Data and text are CC BY-SA 4.0; code is MIT.
- I wrote the text, with drafting and editing assistance from Claude (Anthropic), which also helped prepare the analysis code. I reviewed and checked all text and results.

