
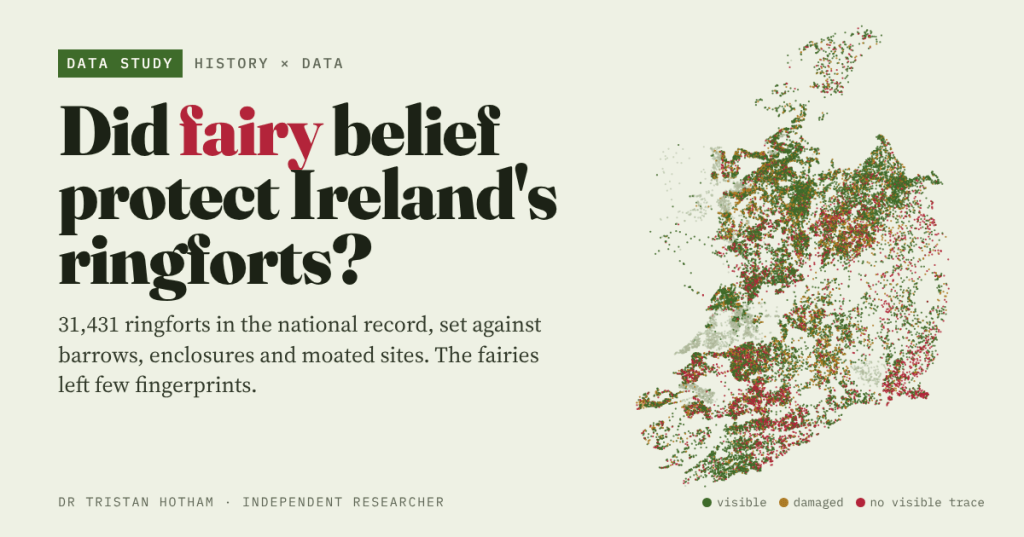
Ireland’s ringforts are fairy forts, and it was unlucky to disturb them. Did that belief really save them? I set all 31,431 ringforts in the national record against other earthworks to find out.
Drive through almost any part of rural Ireland and you pass them: a ring of bank and ditch in a field, often crowned with hawthorn and left alone while the land around it is grazed or ploughed. These are ringforts, the round farmsteads of the early Middle Ages, the ráth and lios of a thousand place names. They are also fairy forts. The story goes that the aos sí lived in them, and that anyone who levelled one, or cut its thorn bush, would pay for it.
People often say that this is why so many survive. It is a lovely idea. It is also one you can test, at least in part, because the National Monuments Service publishes its whole Sites and Monuments Record as open data: 151,308 entries, of which 31,431 are ringforts. If fear of the fairies protected them, ringforts should have outlasted other earthworks of similar build that carried less of the lore.
Thirty thousand rings
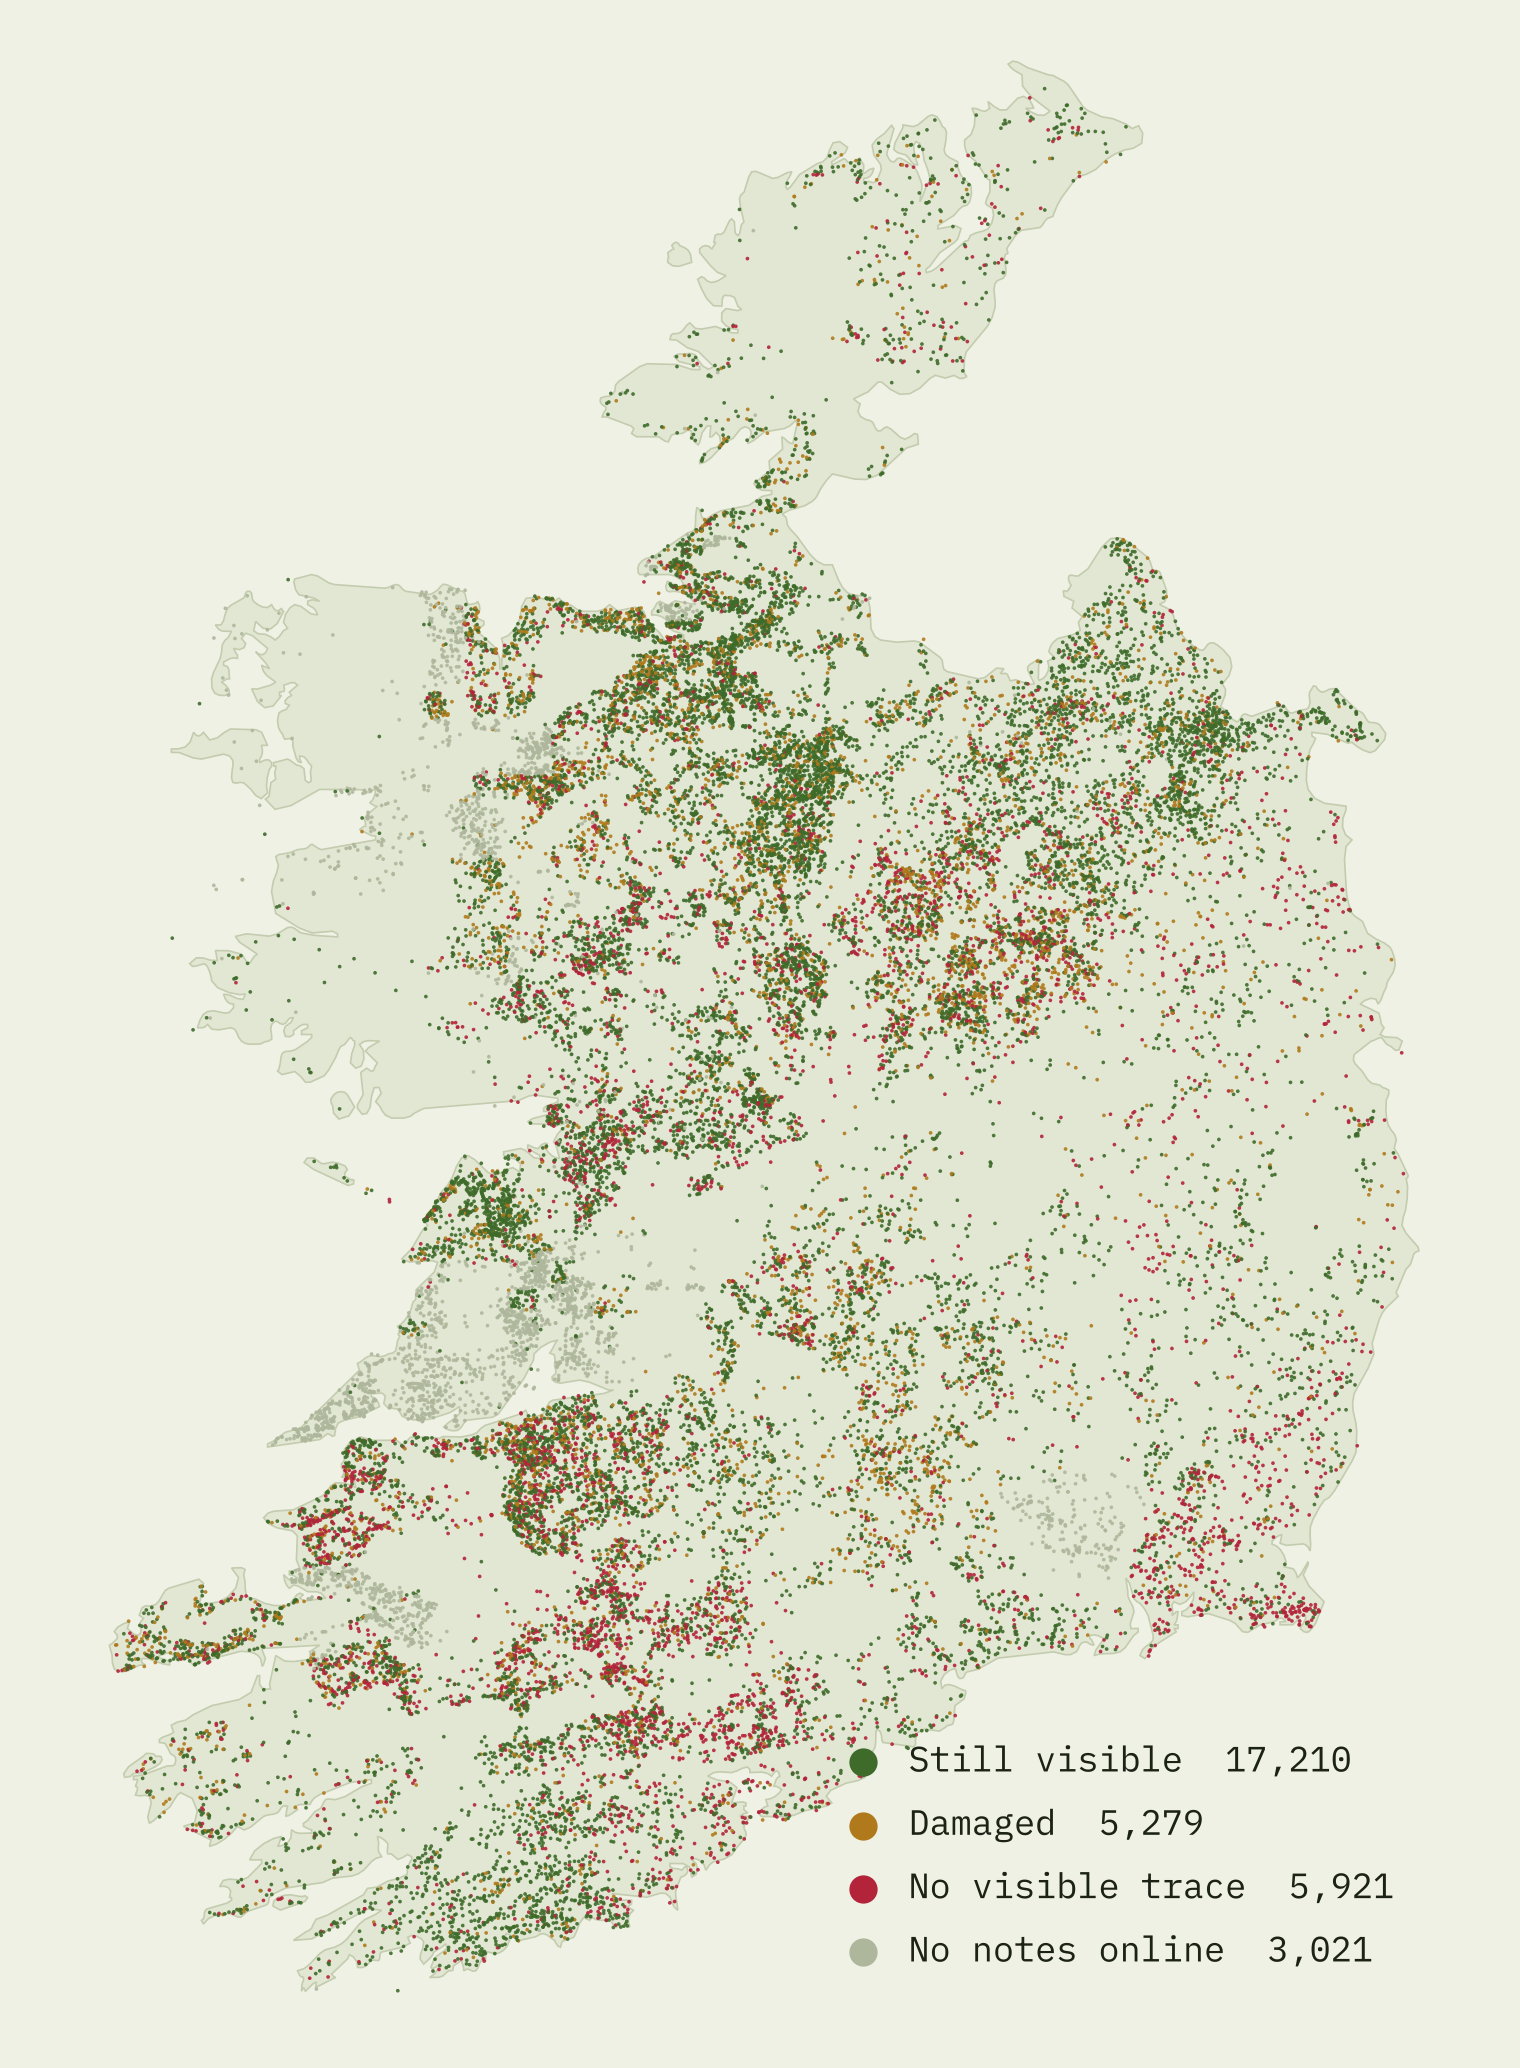
There are about 0.45 ringforts for every square kilometre of the state, one every 2.2 km². Sligo is the densest county, at 1.25 per km², and in the busiest patches there are more than three per km². Cork has the most, 3,863.
The record gives two ways to see what has survived. For many sites it says how they were drawn on the first Ordnance Survey six-inch maps of the 1830s and 1840s, and on the latest edition, which where dated is mostly from the 1910s and 1920s. And for ringforts and enclosures it holds the surveyors’ notes, which say plainly when a site has been “levelled” or has “no visible surface trace”. I read all of those notes with a set of rules and checked the rules against a random sample of notes read in full: they agreed 54 times out of 60.
Ringforts did well. So did barrows
Of the 11,555 ringforts drawn on the map around 1840, 88.6% were still drawn about eighty years later. Plain enclosures, round or oval banks that the survey could not firmly call ringforts, managed only 70.1%. That looks like a fairy premium.
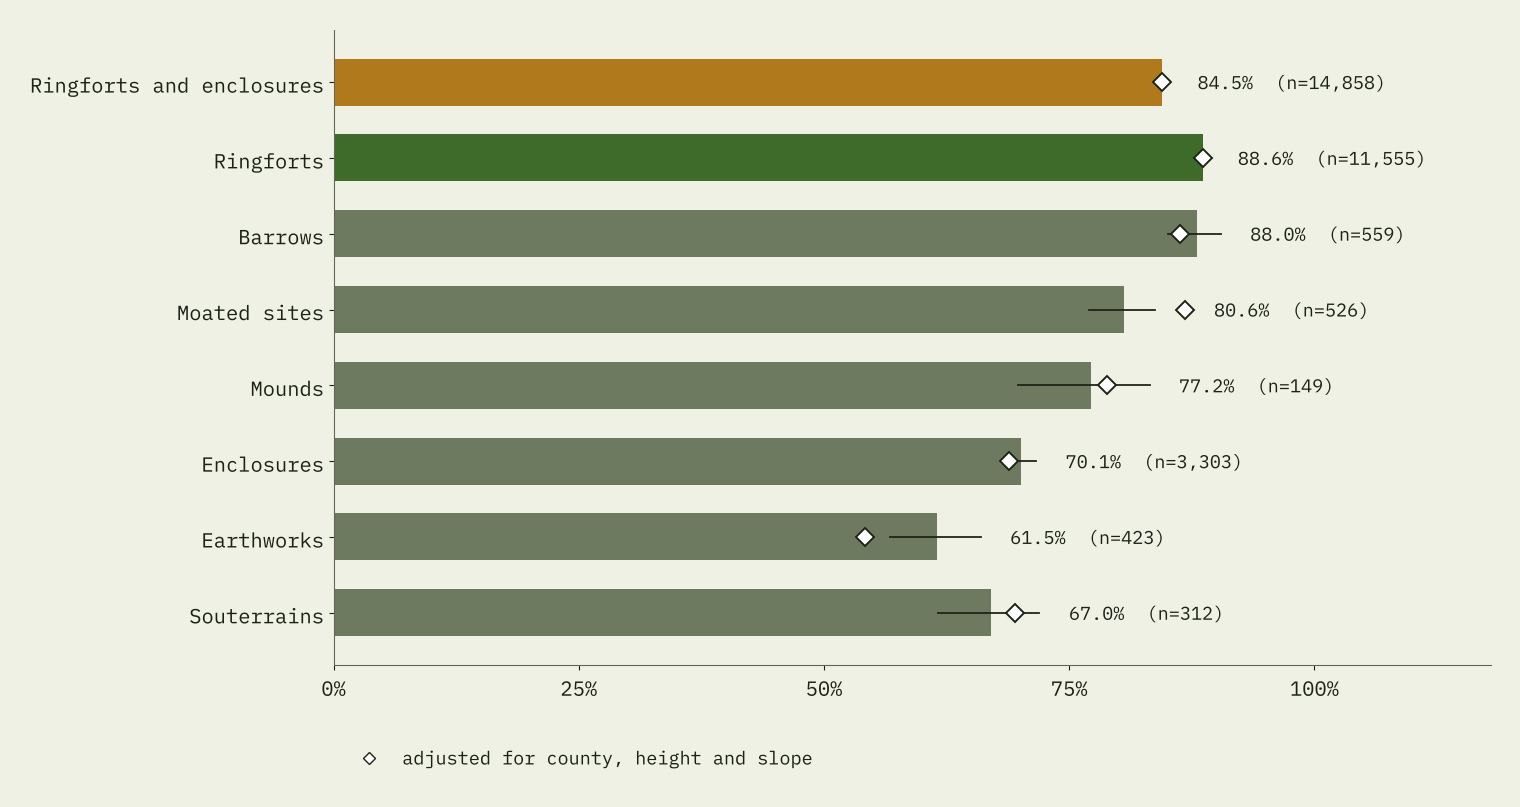
But look further down the list. Barrows, the prehistoric burial mounds that are not the forts of the fairy stories, kept their place on the map just as well, at 88.0%. Moated sites, the ditched homesteads of Anglo-Norman settlers, were not far behind at 80.6%. Allowing for county, height and slope, ringforts lead barrows by only 2.4 percentage points.
What counts as a ringfort?
The notes seem to tell a stronger story. Of the ringforts drawn around 1840, 16.3% now have no visible trace. For enclosures it is 42.4%. But there is a catch, and it is hiding in the record’s own labels.
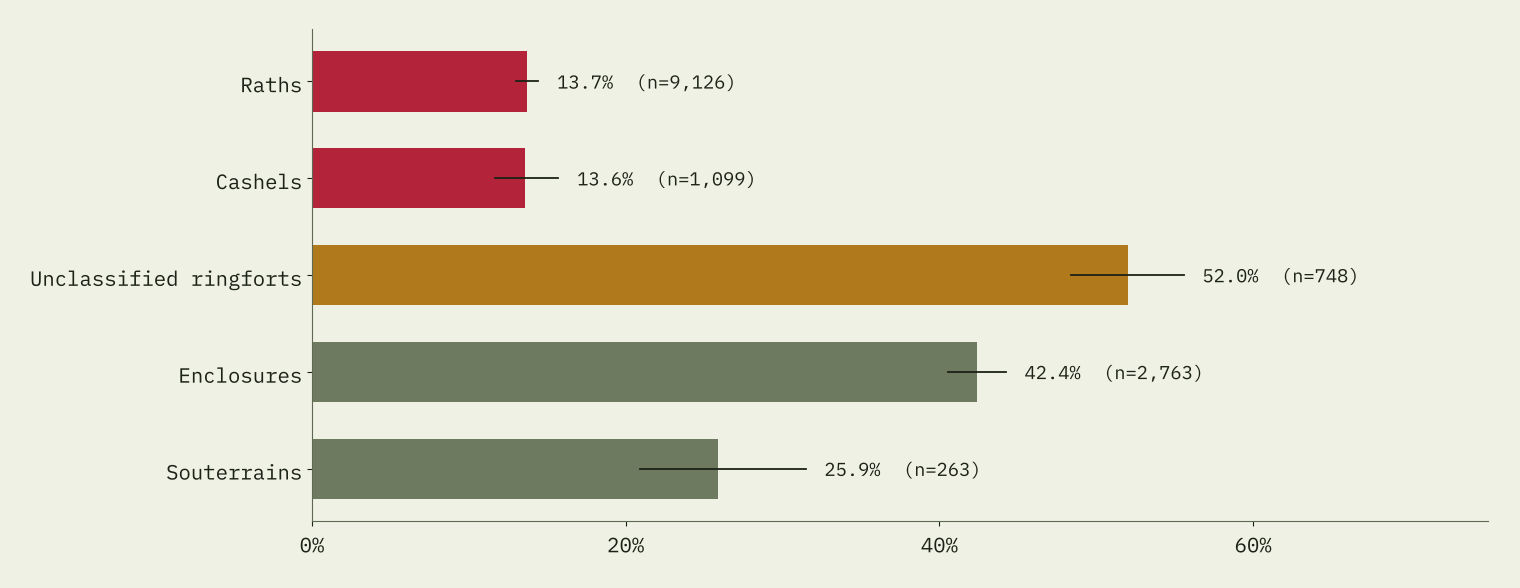
A site needs a good bank, ditch and entrance before a surveyor will call it a ringfort. One that was ploughed flat before anyone looked closely is more likely to be filed as an “enclosure” or an “unclassified” ringfort. You can see it in the chart: 52% of unclassified ringforts have gone, more than enclosures. So the word “ringfort” in the record already means, in part, “survived well”. Comparing ringforts with enclosures bakes survival into the test.
The fairer test is to stop letting survival decide the label: count every round earthwork drawn around 1840, ringfort or enclosure. Of those 14,858, 84.5% were still on the later map. Adjusted, that is 84.5%, against 86.3% for barrows and 86.6% for moated sites.
Count every round earthwork, not just the ones later called ringforts, and the fairy premium disappears.
Height beats lore
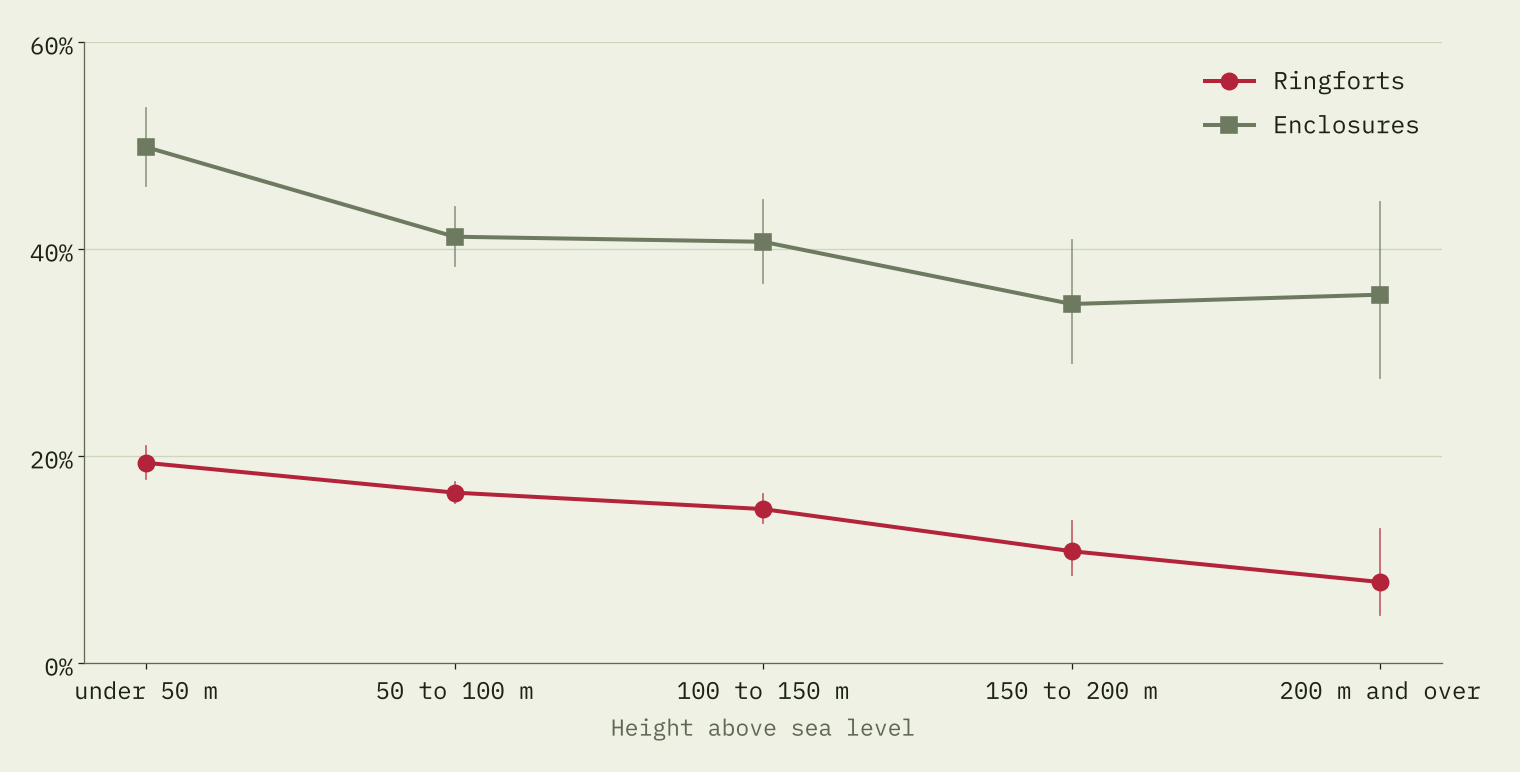
What does go with survival is the lie of the land. I have no soil map in this study, so height above sea level stands in, roughly, for how easy land is to plough and improve. Ringforts below 50 metres have gone 19% of the time; those at 200 metres and above, 8%. In the model, every extra 100 metres cuts the odds of a site having gone by about a quarter.
Where are the fairies?
If fear kept the plough away, you might expect surveyors to hear about it. I searched all 47,024 notes for fairies, the sí, the púca, superstition, bad luck and ghosts. Just 28 of 28,410 ringfort notes match. The few that do are wonderful. In Rathrobin, Co. Offaly: “The local landowner will not touch the overgrowth on this ridge because he believes that it is a fairy fort.” In Monsea, Co. Tipperary, a fort was flattened, yet “The site was levelled c. 50 years ago but because of superstition the area where the ‘fort’ stood has been left fallow.” And from a Wicklow school’s folklore collection of the 1930s: “It is said that a man went to plough it and as soon as he put his hands on the plough, The horse & Plough were took out of his hands and they never came back”
Several of these stories are about forts that went anyway: 10 of the 28 ringforts whose notes mention such beliefs now have no visible trace. Place names do not help much either. Ringforts in townlands called Lis-, Rath- or Caher- have gone slightly less often (19.0% against 21.0%), and forts written on the 1840 map as “Fort” did no better than unnamed ones once county and terrain are allowed for.
Across the water
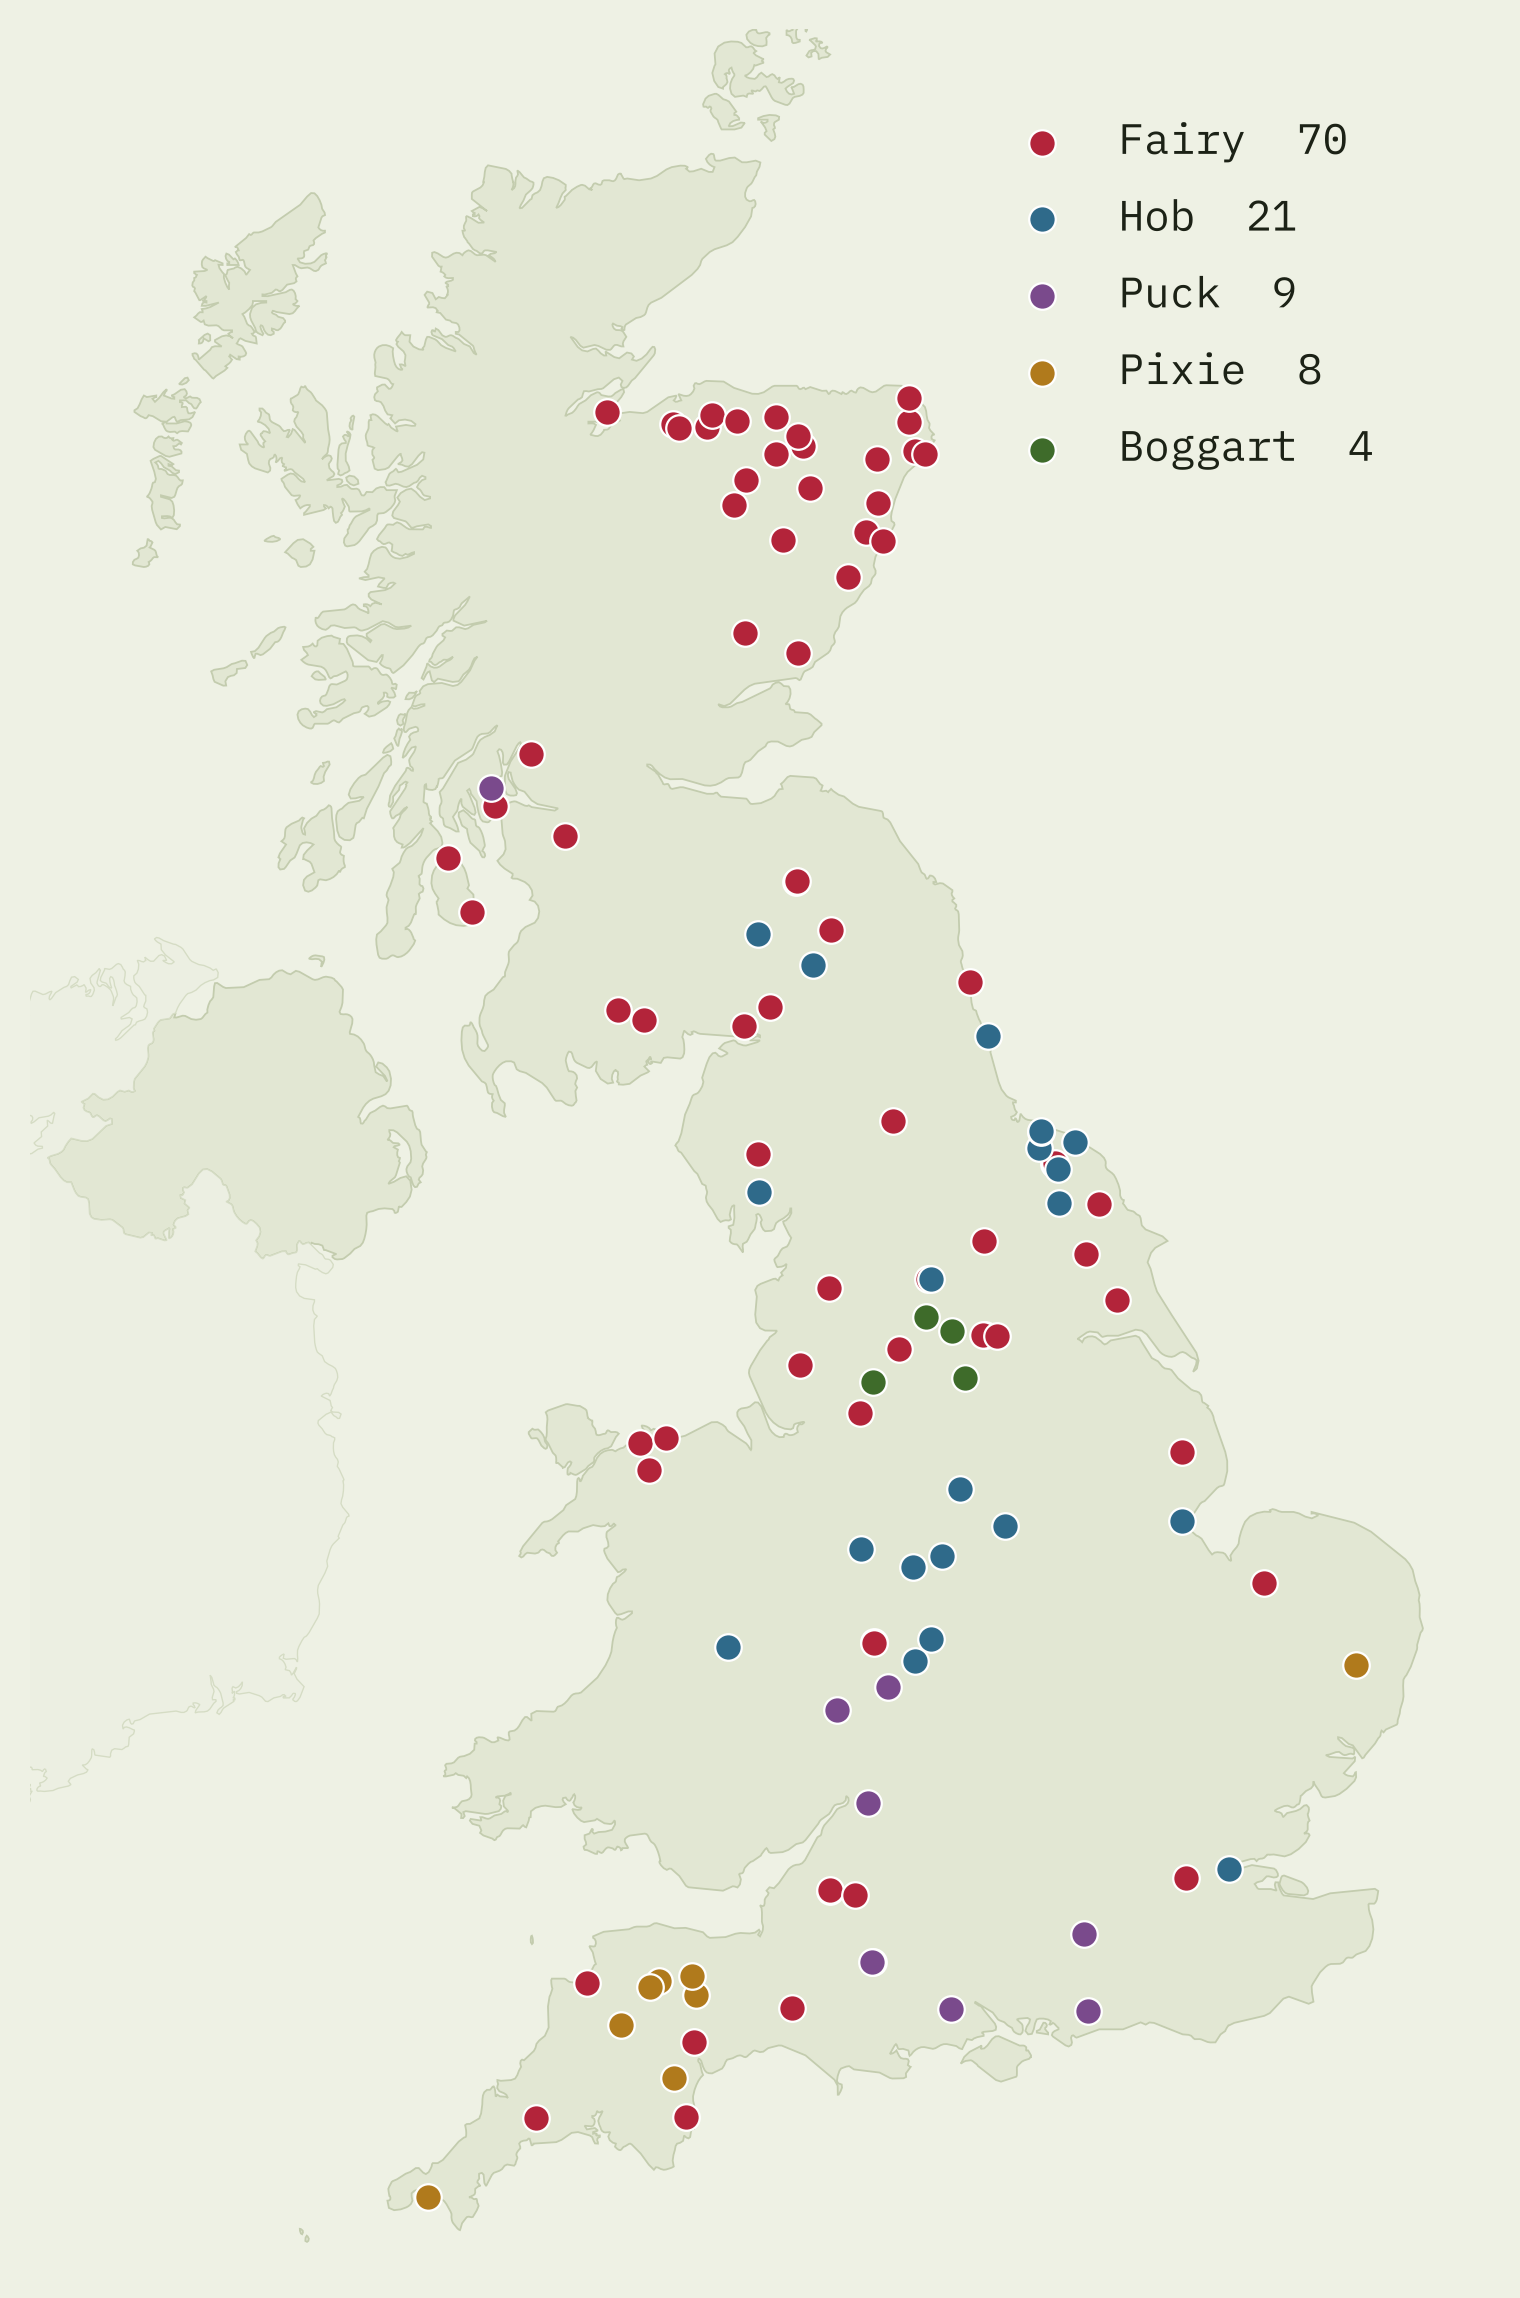
Britain’s small folk are on the map too, just less often. OS Open Names has 112 features named for them: 70 fairy, 21 Hob, 9 Puck, 8 pixie and 4 boggart. All 20 fairy hillocks are in Scotland. Some Hob and Puck names will be surnames or other words, so treat this as a curiosity, not a census of belief.
So, did the fairies do it?
Not in any way the national record can see. Ringforts are well preserved, but so are barrows, and once you stop letting survival decide what is called a ringfort, round earthworks kept their place on the map no better than other earthworks did. Belief may well have saved particular forts, one field at a time, and a few notes say so. It may also have protected all old earthworks alike, which a comparison like mine could not detect. But what mostly shaped survival was where the forts stood.
How I did this
I used the full Sites and Monuments Record for the Republic of Ireland and kept 68,000 earthworks: ringforts, enclosures, barrows, moated sites, mounds, other earthworks, souterrains and fulachta fia. A site counts as drawn around 1840 from the record’s own first-edition field; I ignore mentions of the old map in the notes, because they are far commoner for sites that have since gone. The notes were read with rules that look for whole-site loss sentence by sentence, and 3,021 ringfort records whose notes are not yet online were left out. Adjusted figures come from logistic regressions with county, height and slope. Heights come from a terrain model at about 90 metre resolution.
The limits matter. The record is a survey of what was noticed and recorded; map depiction and note wording are proxies for survival; the classes partly depend on survival; the first-edition field is nearly empty in some counties; and none of this shows cause. Northern Ireland has its own record and is not included.
Notes and sources
- Sites and Monuments Record: National Monuments Service, Department of Housing, Local Government and Heritage, Archaeological Survey of Ireland (CC BY 4.0). Quotations are from the record’s notes.
- Place names in Britain: OS Open Names, Ordnance Survey (Open Government Licence v3.0). Contains OS data © Crown copyright and database right 2026.
- Elevation: AWS Terrain Tiles (Mapzen/Tilezen). Outline of Ireland: Natural Earth. County areas: Wikipedia, List of Irish counties by area.
- Background on ringforts: Matthew Stout, The Irish Ringfort (Four Courts Press, 1997).
- Paper: Hotham, T. (2026) Did fairy belief protect Ireland’s ringforts? https://doi.org/10.5281/zenodo.23691874
- I wrote the text, with drafting and editing assistance from Claude (Anthropic), which also helped prepare the analysis code. I reviewed and checked all text and results.

