
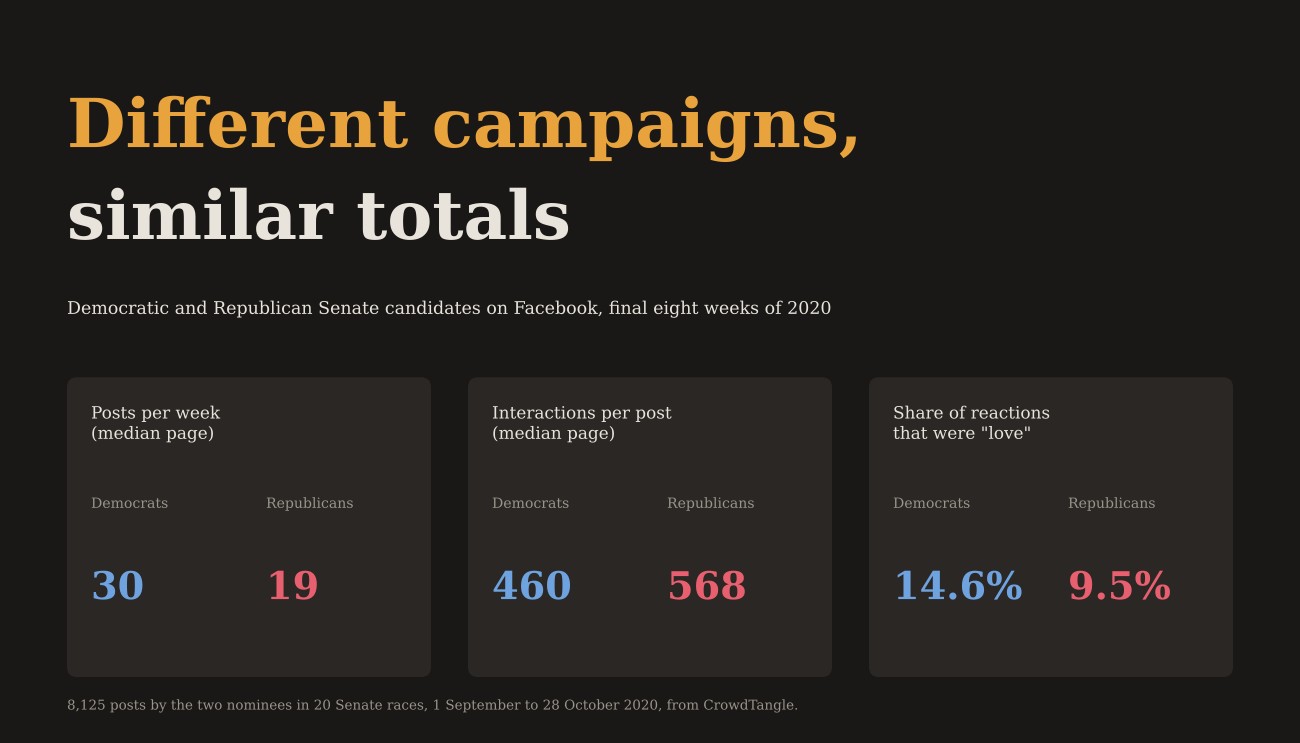
“Facebook rewards the right” is one of those claims everyone seems to know is true. Most of the evidence for it comes from news pages and lists of the most-shared posts. I wanted to test it somewhere fairer: two candidates fighting for the same seat, at the same time, in front of the same voters.
In October 2020 I pulled every post from the Facebook pages of US Senate candidates through CrowdTangle. Six years on, I’ve matched up the Democrat and Republican in 20 contested races and compared them over the final eight weeks of the campaign. The paper is Different Campaigns, Similar Totals: Republican and Democratic Senate Candidates on Facebook in 2020, free on Zenodo.
The preprint
Open access, free to read, share and cite. 13 pages, 4 figures. Not peer reviewed. Page-level and race-level aggregates are in the record; no post text is shared.
Cite as: Hotham, T. (2026). Different Campaigns, Similar Totals: Republican and Democratic Senate Candidates on Facebook in 2020. Zenodo. https://doi.org/10.5281/zenodo.23297218
Democrats posted twice as much
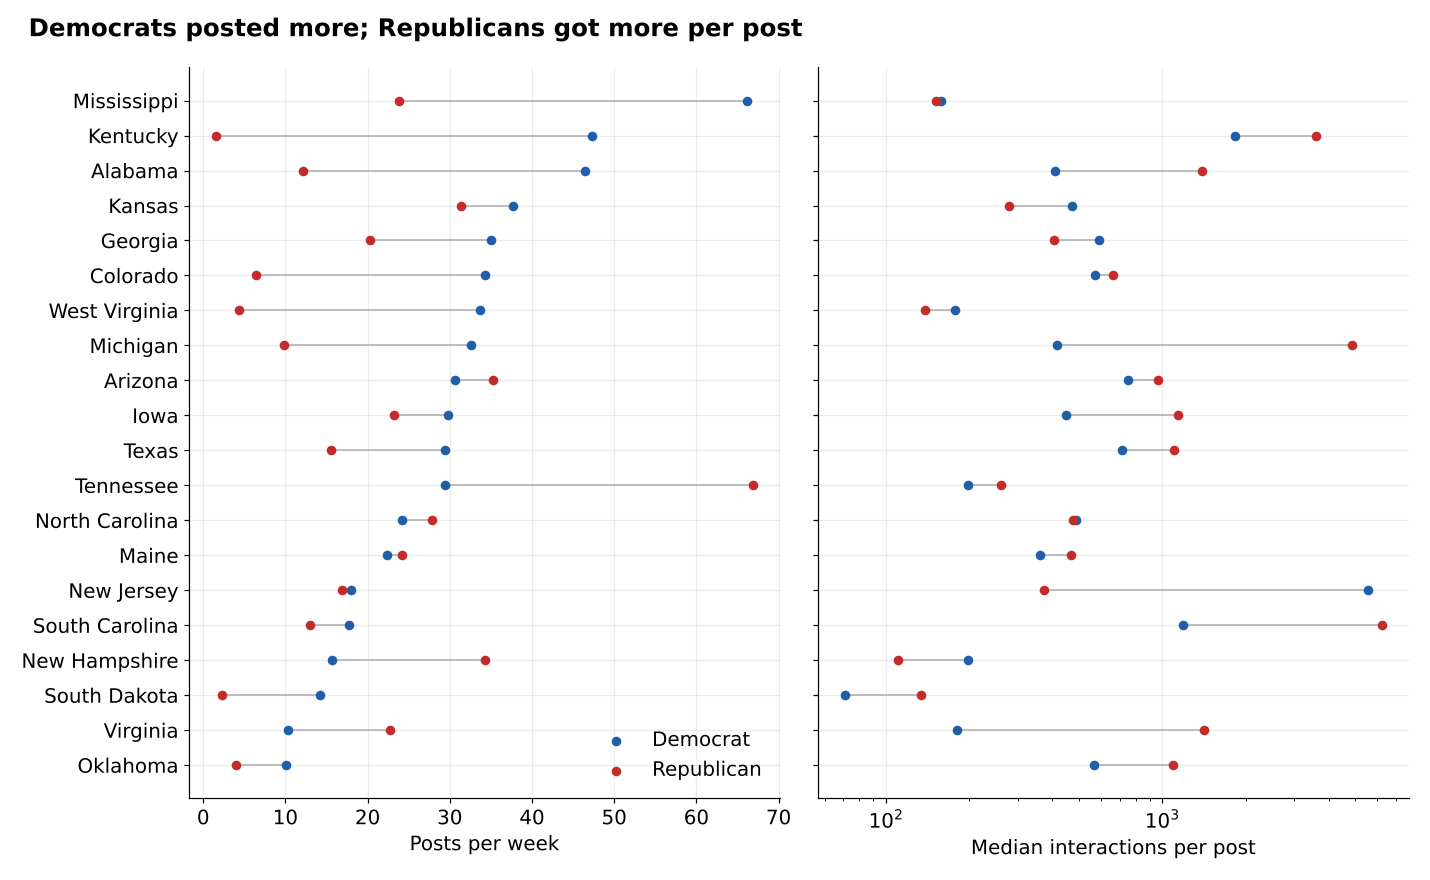
The first thing that jumps out is volume. The typical Democratic nominee posted about 30 times a week; the typical Republican about 19. Mike Espy in Mississippi managed 66 a week. Mitch McConnell’s campaign page posted about twice a week while Amy McGrath, his challenger, posted 47 times.
Each Republican post did tend to do better. Within the same race, Republican posts drew roughly 50% more shares and comments, and those are the kinds of engagement that push a post out to new people. But Democrats made up for it by posting so much more. Add it all up and neither side clearly came out ahead. Measured against the size of each page’s audience, Democrats did at least as well.
Love for Democrats, laughs for Republicans
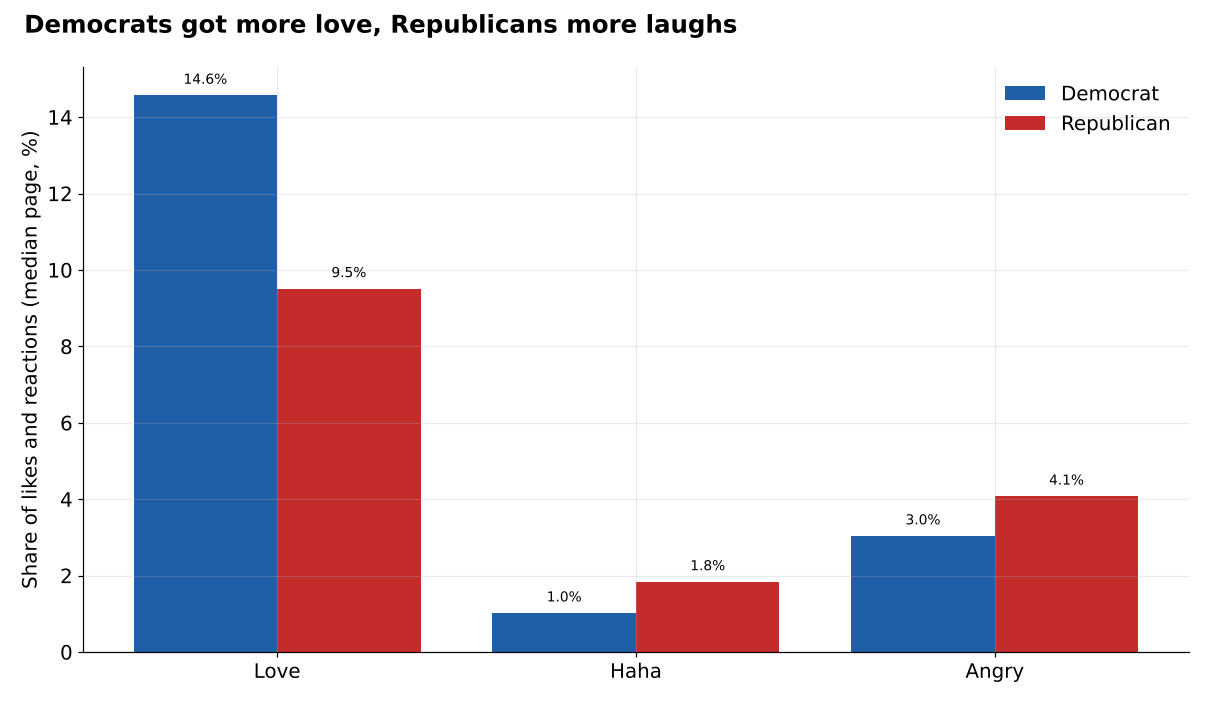
The clearest difference wasn’t how much engagement each side got but what kind. Democrats got more love reactions in 17 of the 20 races. Republicans got more laughing faces. Anger was surprisingly even.
Two different campaigns
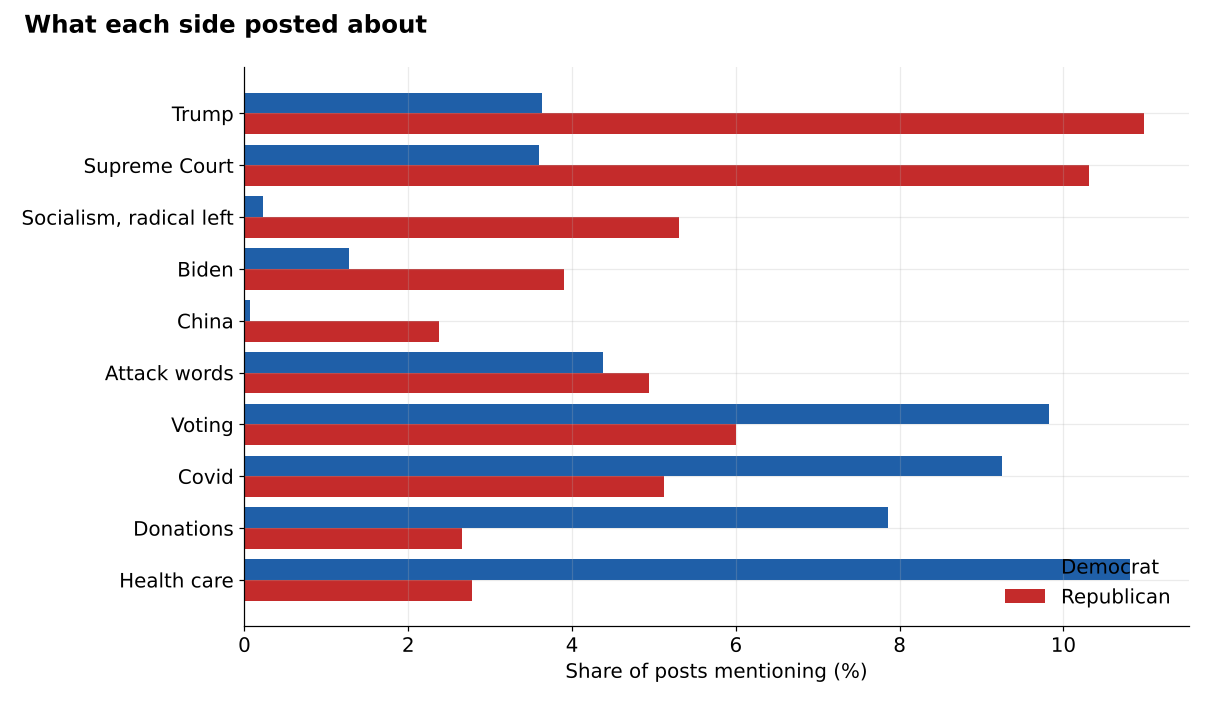
Republicans ran on Trump, the Supreme Court (this was the Amy Coney Barrett autumn) and warnings about socialism. Democrats ran on health care, Covid, getting people to vote and asking for money. Posts about the Supreme Court, Trump or attacks on an opponent drew the most engagement on both sides. Posts asking people to vote drew less.
The angry reactions followed the other side. When a Democrat mentioned Trump, the share of angry reactions jumped by about 14 points. When a Republican mentioned Biden, it rose by about 9. Neither side’s followers got angry about their own candidate.
And none of it tracked the vote
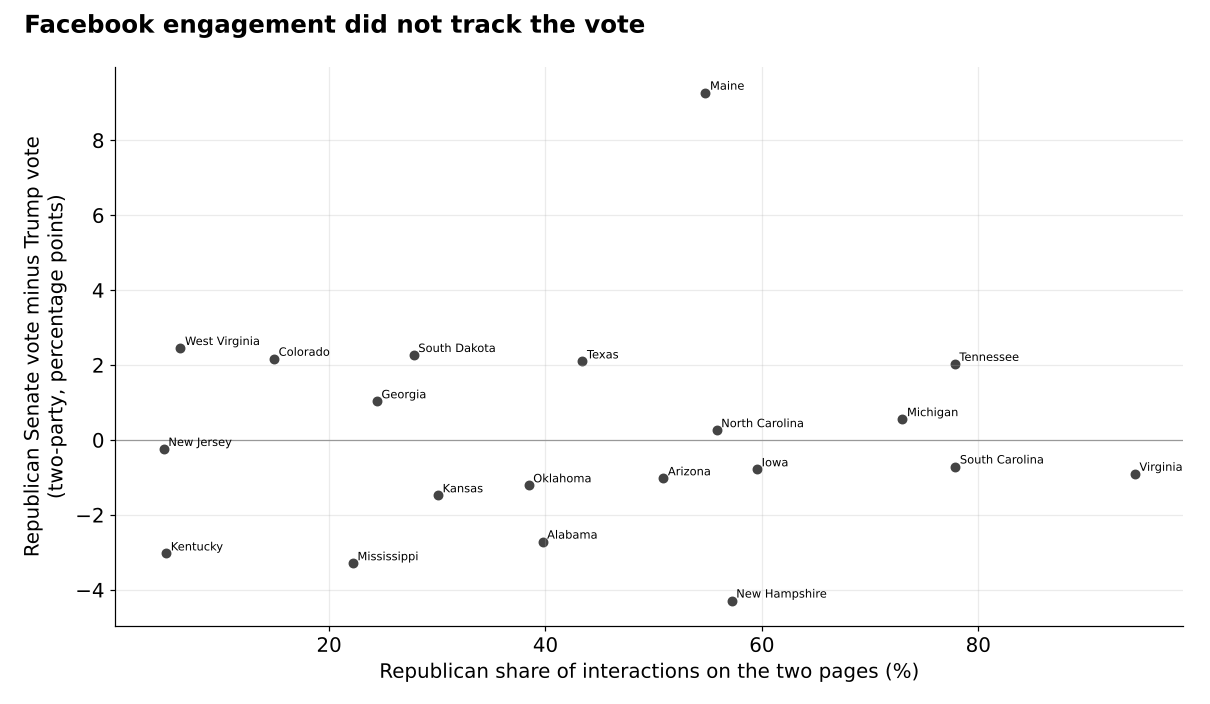
Knowing how Trump did in a state told you nearly everything about how the Senate race went. Knowing who won the Facebook engagement battle added nothing. Lindsey Graham’s page got more than three-quarters of the engagement in South Carolina and he still ran slightly behind Trump. Susan Collins got about half in Maine and ran nine points ahead of him.
The caveats
This is 20 races, not all of them, and only the candidates’ own pages: no adverts, no groups, no influencers. How strong the Republican per-post edge looks depends on how you weight busy and quiet pages, and I report all the versions in the paper. Twenty races is too few to rule out a small link between engagement and votes. And the data stop six days before polling day.
Read it
Hotham, T. (2026). Different Campaigns, Similar Totals: Republican and Democratic Senate Candidates on Facebook in 2020. Preprint, Zenodo. https://doi.org/10.5281/zenodo.23297218
For the 2016 version of the story, see the crowd in Trump’s and Clinton’s comments.
The views in this post and the paper are my own.

