
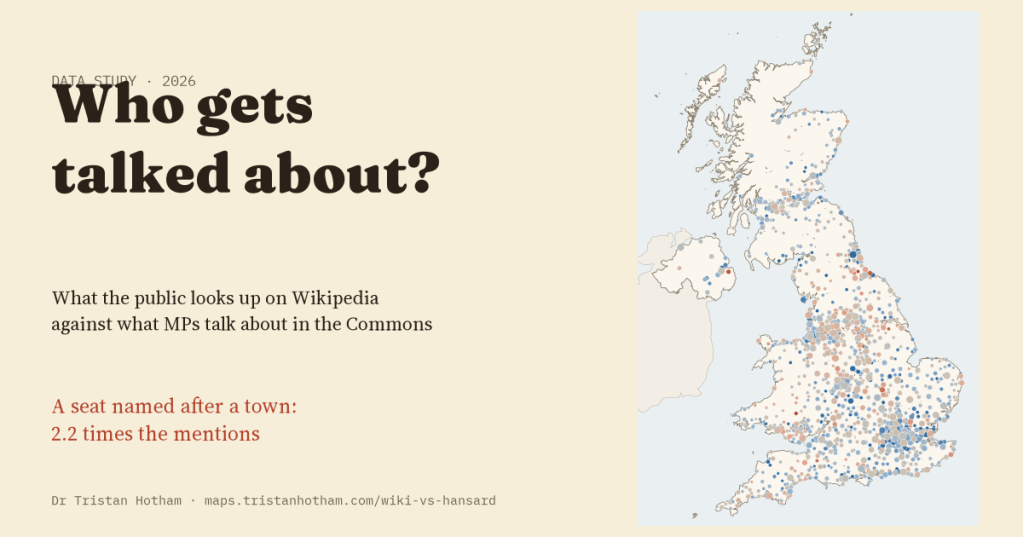
Which places does the public look up, and which does Parliament talk about? I set a year of Wikipedia reading against twenty-one years of Commons debate for 1,425 towns and cities across the UK. The two mostly agree. Where they part ways, the electoral map seems to be doing a lot of the work.
Some places are famous and hardly ever said in Parliament. Others come up in the Commons week after week while few people outside them look them up. I wanted to know how far the two kinds of attention line up, and where they don’t.
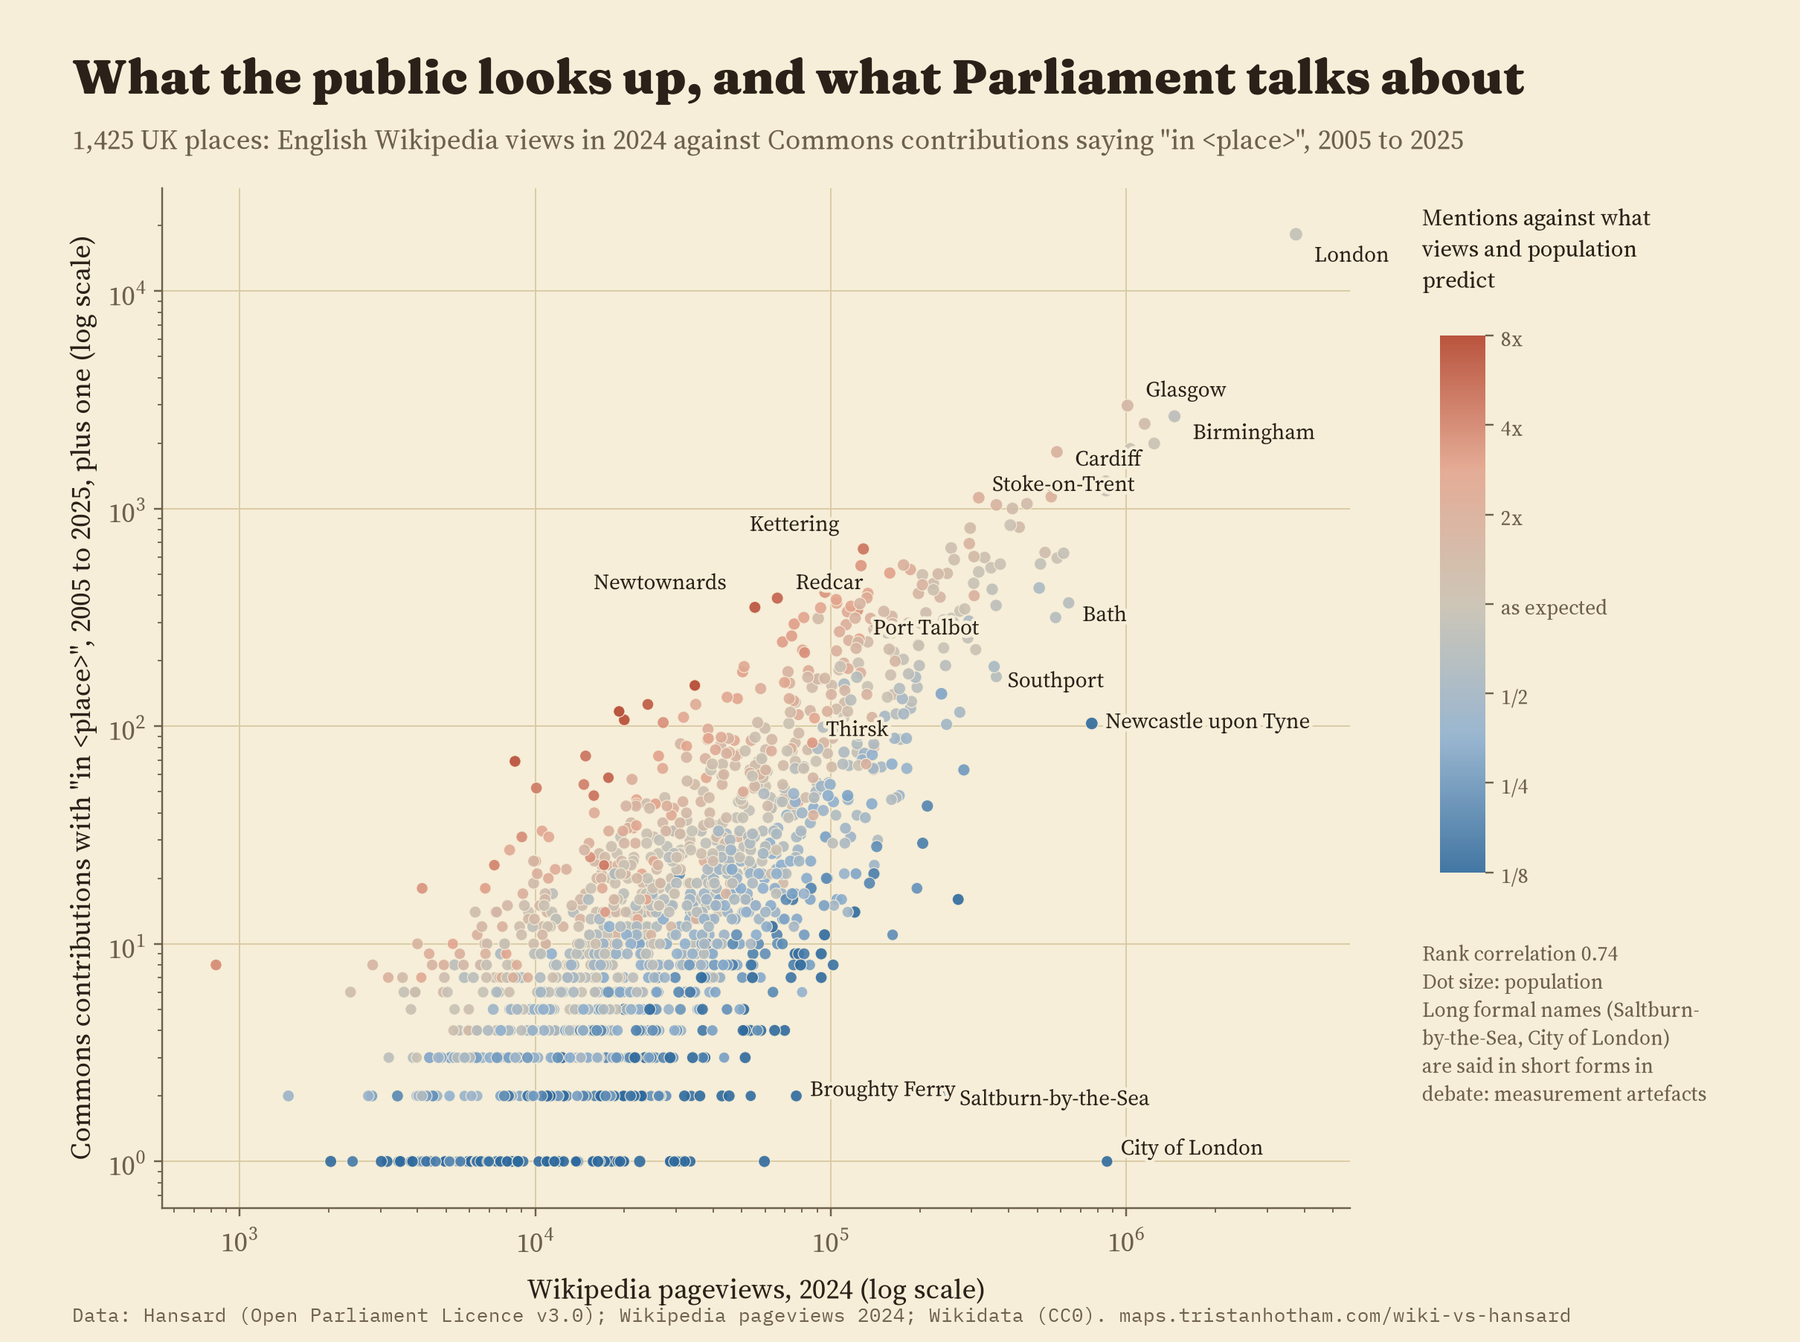
For Parliament I used my earlier count of Hansard: how many Commons speeches from 2005 to 2025 said “in” followed by a place’s name, “in Kettering”, “in Port Talbot”. For the public I used the number of times people opened each place’s English Wikipedia article in 2024. Matching one to the other took care: there are several Ripleys and Farnboroughs, some articles were renamed during the year, and Wikidata’s list of UK settlements even includes Gibraltar. I matched 1,634 of 1,661 names and kept 1,425 places with a clean match on both sides.
Mostly, they agree
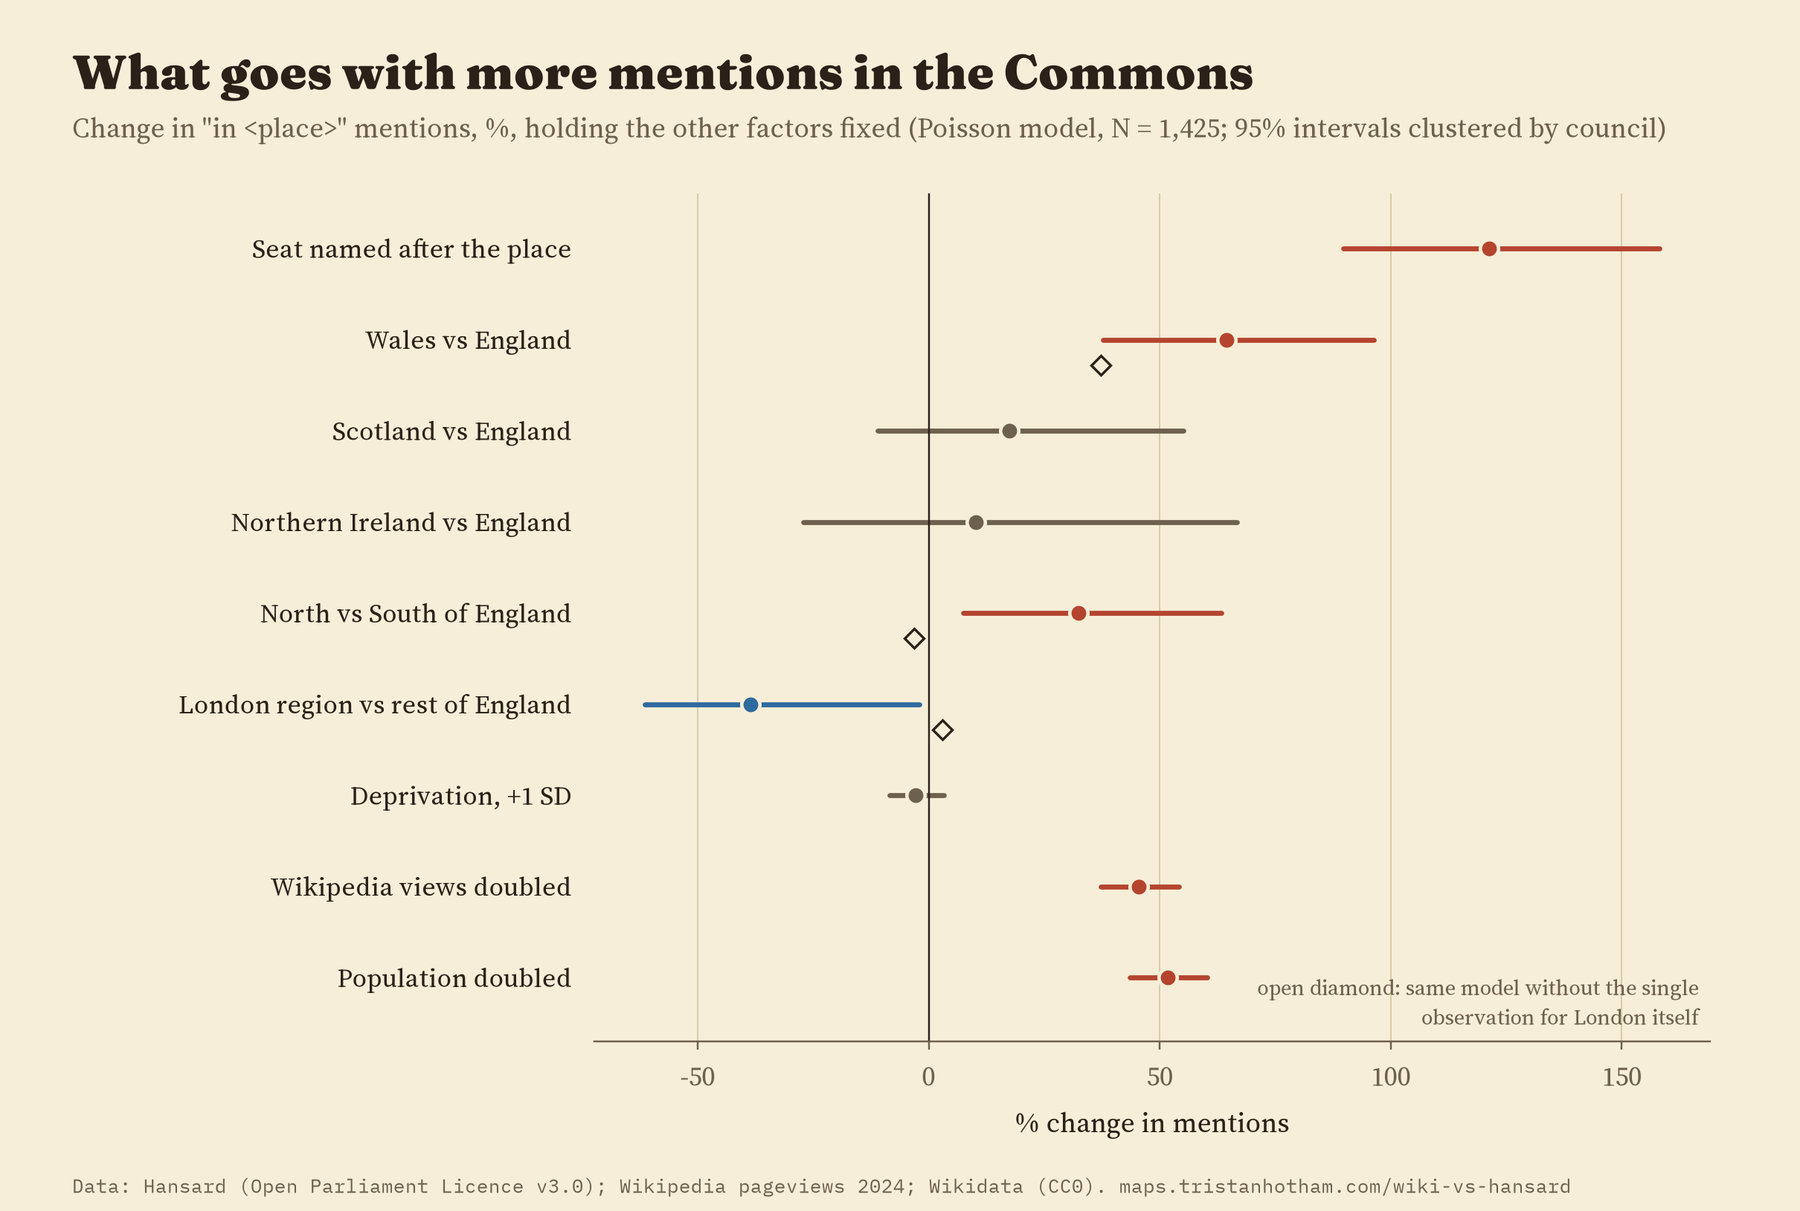
Big, well known places get both kinds of attention, and the two rankings line up closely (a rank correlation of 0.74). But not one for one. Comparing places of the same population, one with twice the Wikipedia views gets about 45% more mentions in the Commons, not twice as many. London alone takes 16.5% of all the mentions here but only 4.2% of the views.
A seat named after you
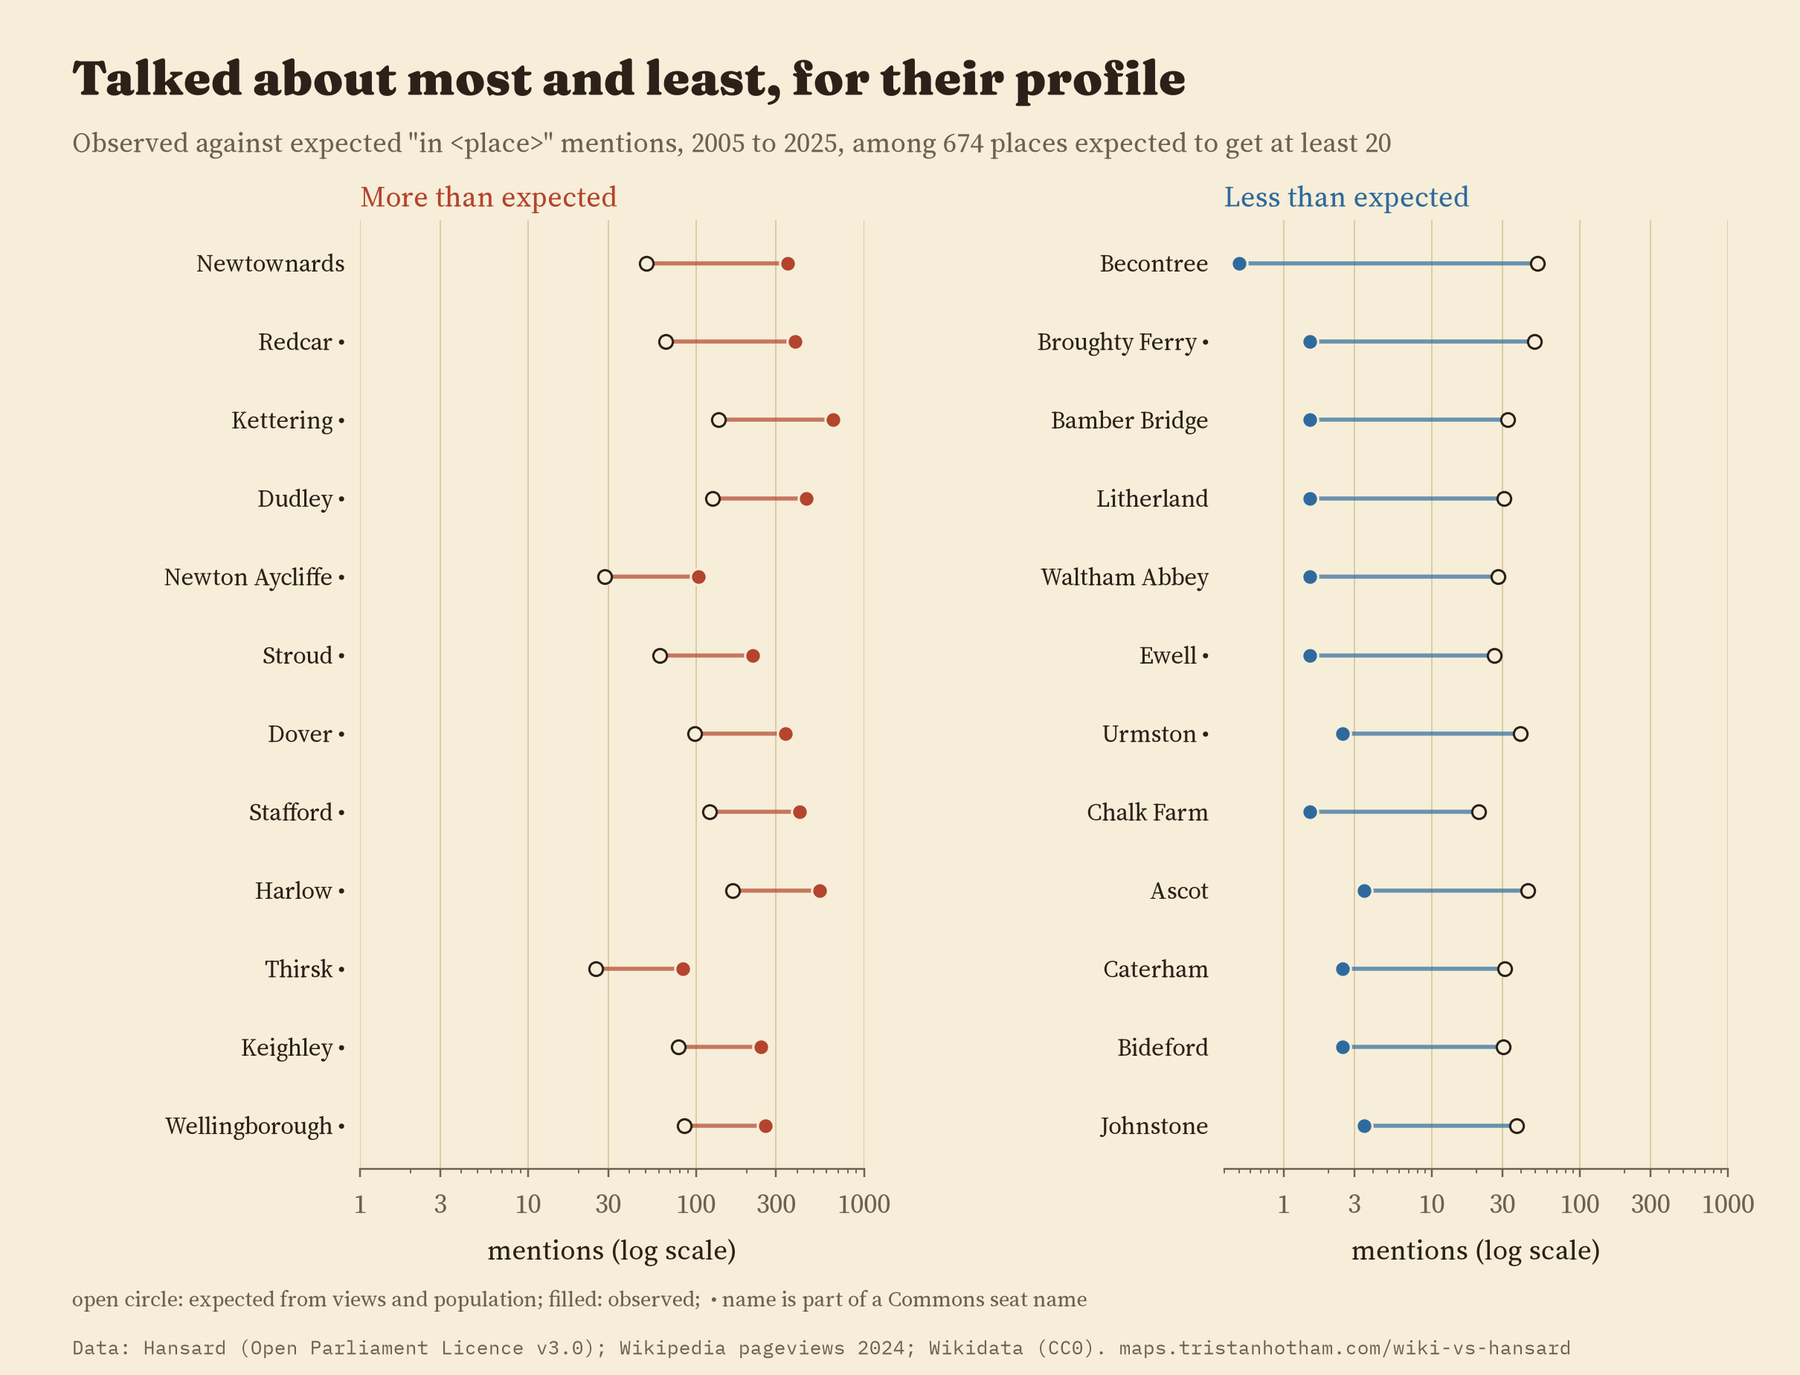
The biggest difference is about names on the electoral map. A place whose name is part of a Commons seat’s name, like Kettering, Redcar or Dudley, gets 2.2 times the mentions of a place with the same views and population. When I shuffled the seat names at random among similar places a thousand times, nothing came close. Part of this is how the counting works: a search for “in Bury” also finds “in Bury North”, and “in Kettering” can mean the seat as well as the town. But places that only appear later in a seat’s name, like Morley in Leeds South West and Morley, where neither of those can happen, still get 67% more mentions. Of the 25 places most talked about for their profile, 84% have a seat named after them; of the 25 least talked about, 32%.
Is it the name itself? Seat names change when boundaries are redrawn, so I followed the 87 places that first got a seat named after them at the 2024 election. Their mentions rose by 24% in 2024 and 58% in 2025 compared with 2023. But they were already rising for years before. The places that get seats named after them are places on the up, so I can’t say how much of the jump the name causes.
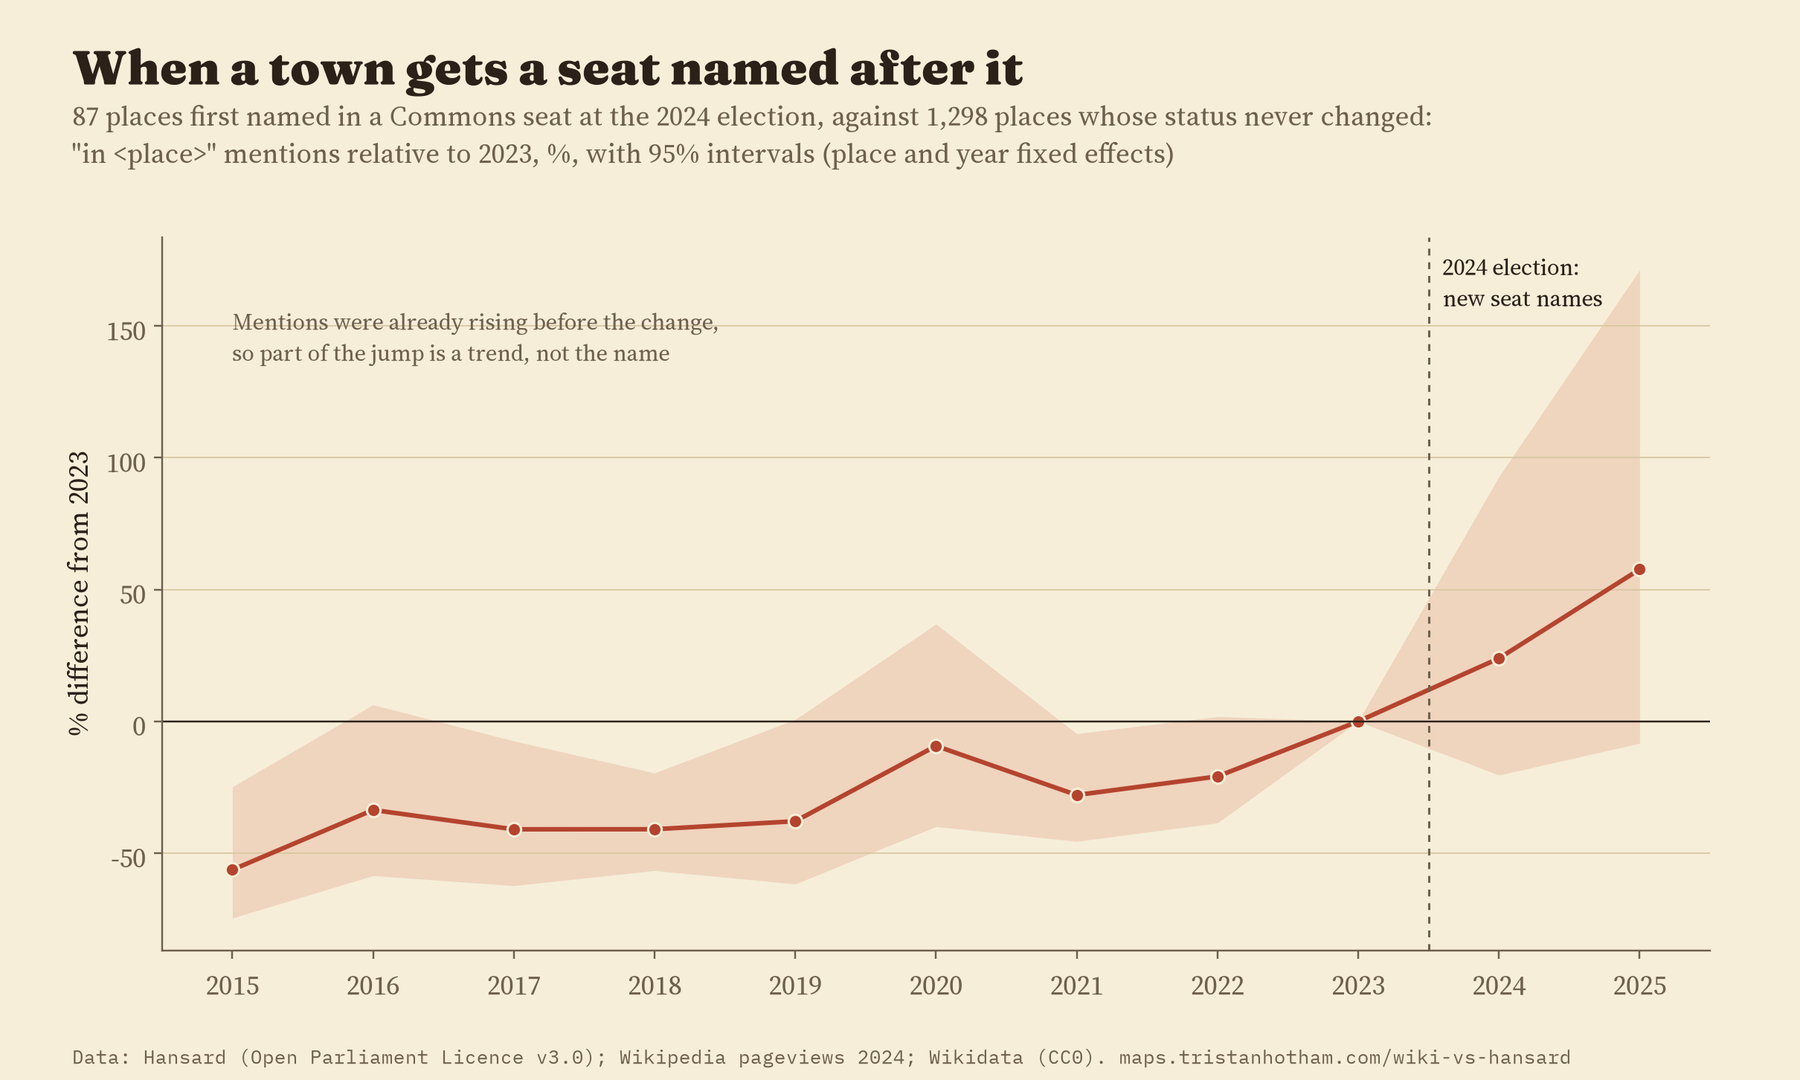
The electoral map is part of what Parliament talks about. A town with a seat named after it gets more than twice the mentions.
No sign that the edges are forgotten
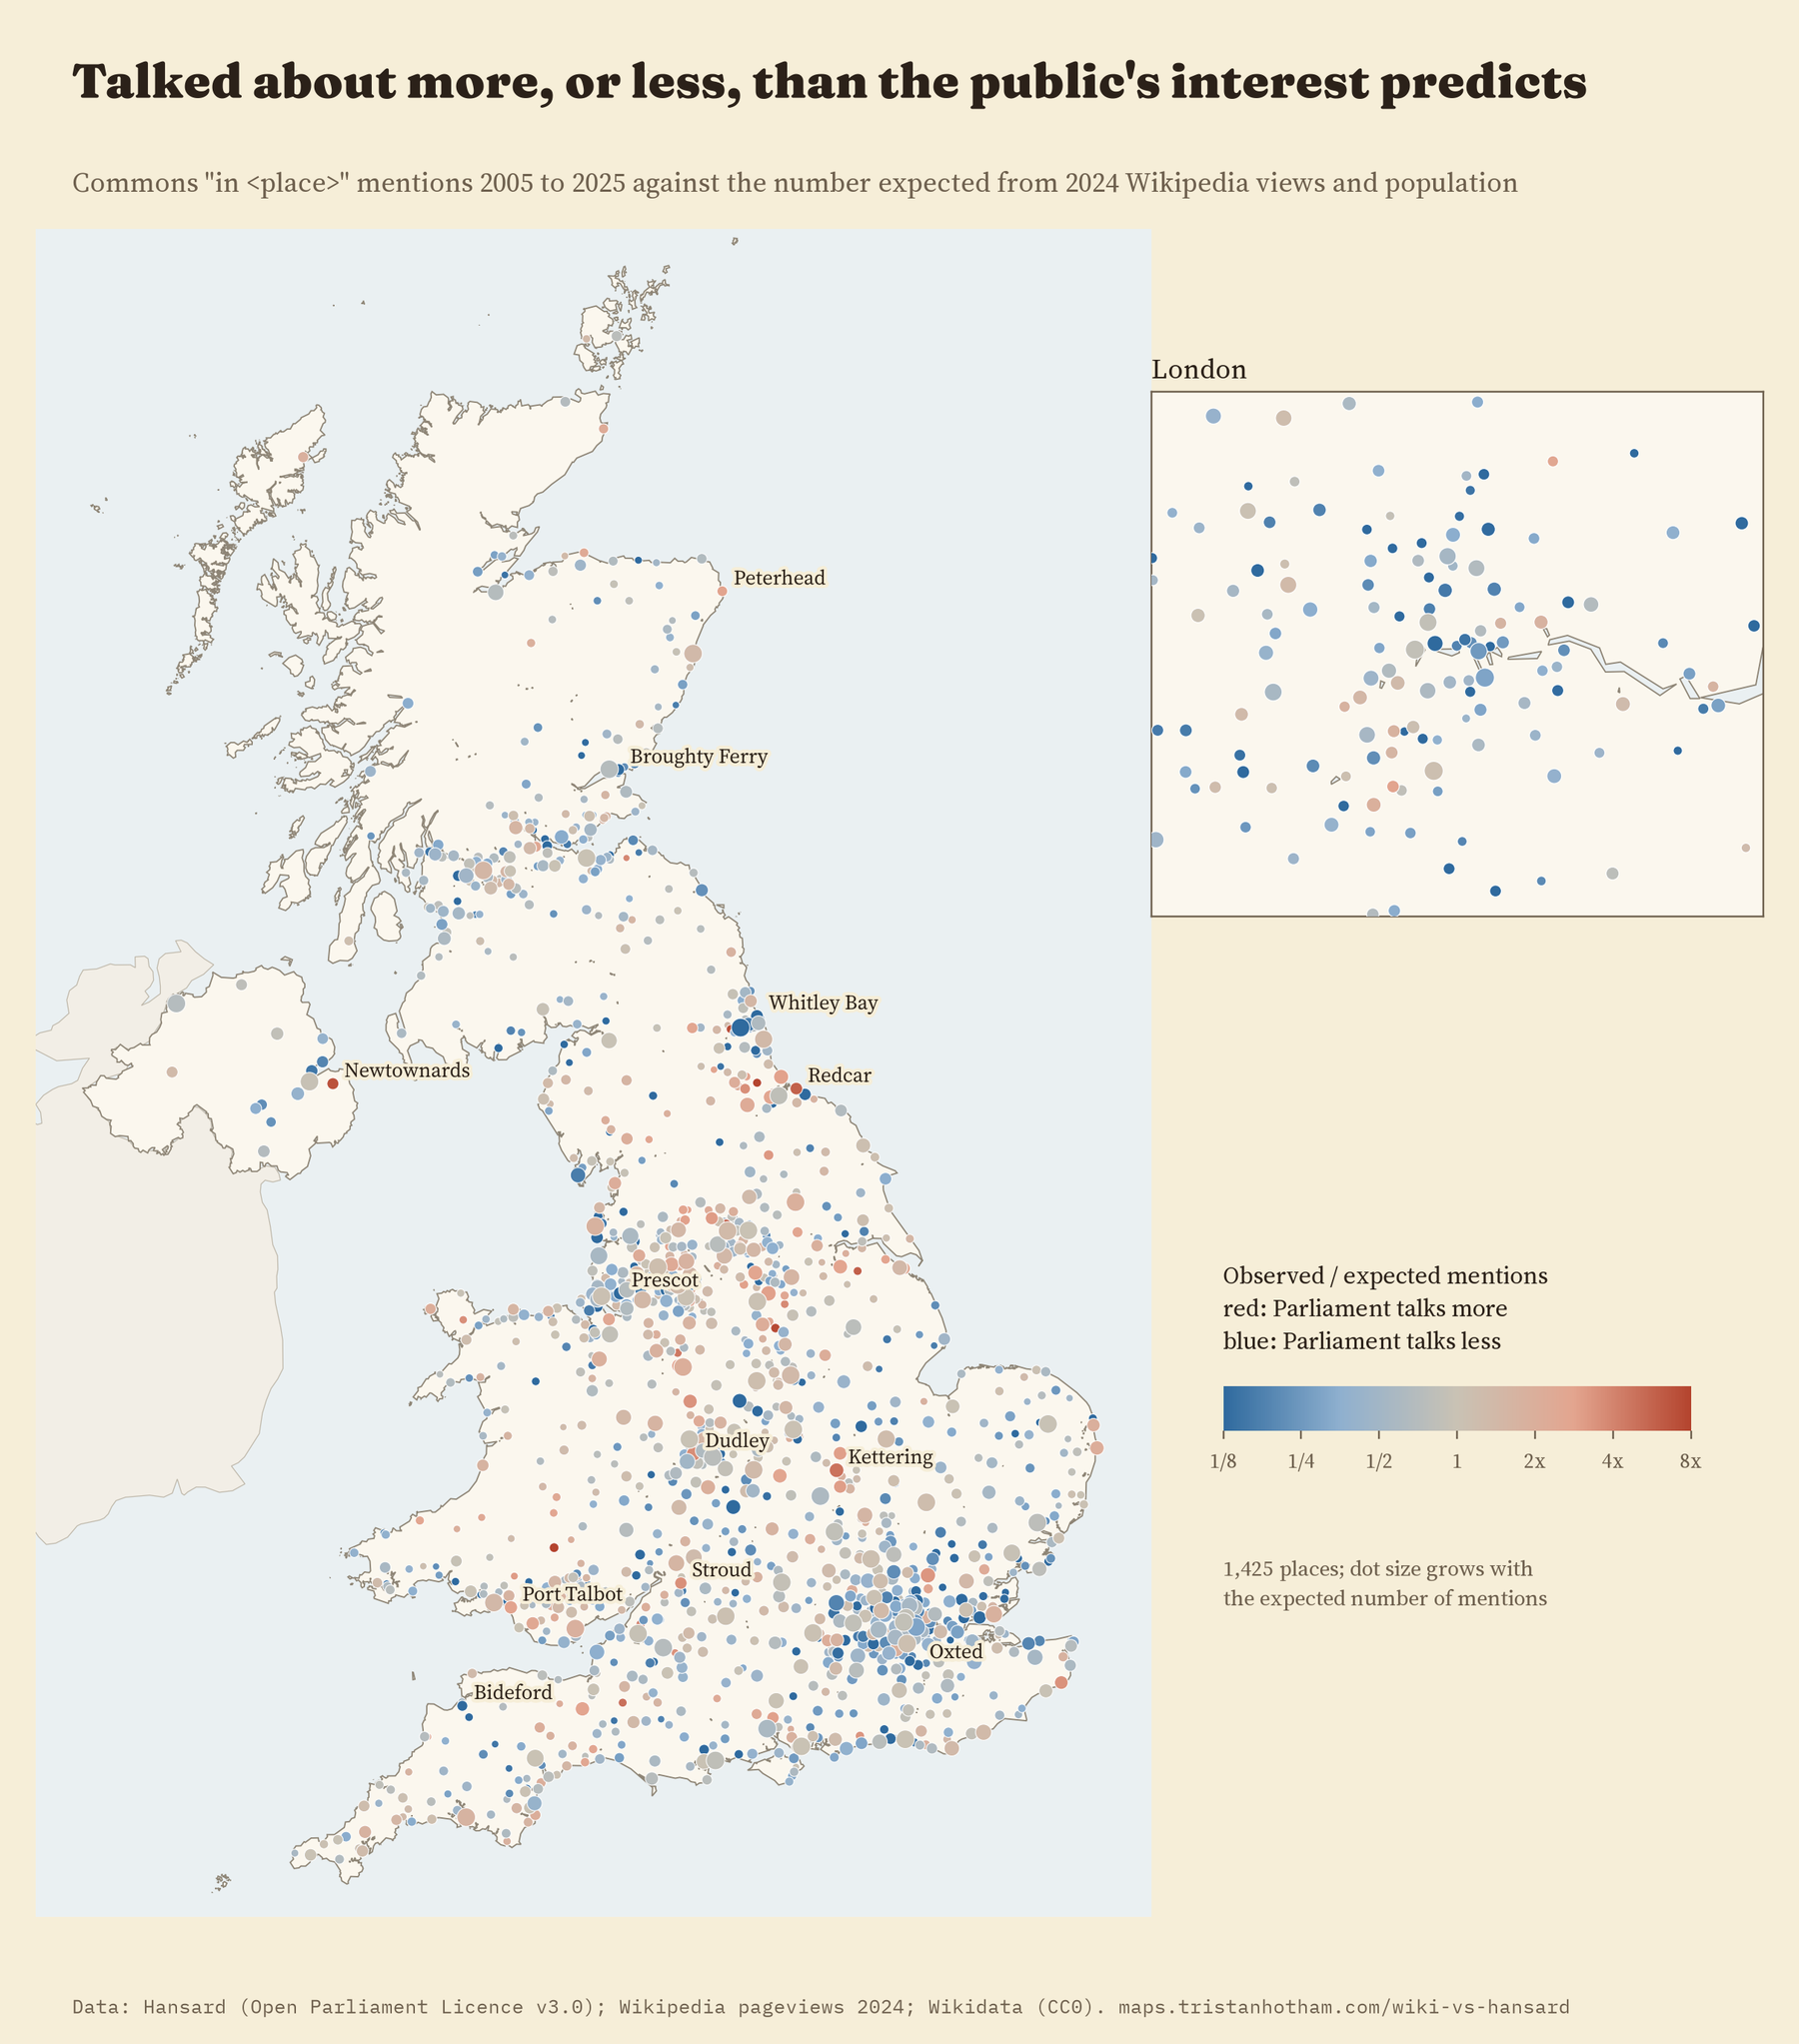
A lot has been written about places that feel ignored by Westminster. On this measure there is no sign of it. Welsh places get 64% more mentions than English places with the same attention and population, in every version of the analysis I tried. Scotland and Northern Ireland are not clearly different from England. The first model also said northern English towns get more mentions than southern ones, and London’s districts fewer, but both of those turn on one place, London itself: leave it out and the gaps disappear. How deprived a place is makes no clear difference.
Talked about more, and less
Among places big enough to expect at least 20 mentions, Newtownards in County Down was mentioned 6.9 times as often as its views and population predict, then Redcar (5.8), Kettering (4.8) and Dudley (3.6). At the other end are suburbs and towns inside seats named after somewhere else: Bamber Bridge, Litherland, Waltham Abbey, Ewell. Some gaps come from the public side. Southport had 357,120 Wikipedia views in 2024, a year of terrible news there. Saltburn-by-the-Sea had 245,592 after a hit film took its name, but people usually just say “Saltburn”, so its full name barely appears in debate, and I keep names like that out of the rankings.
Drifting apart
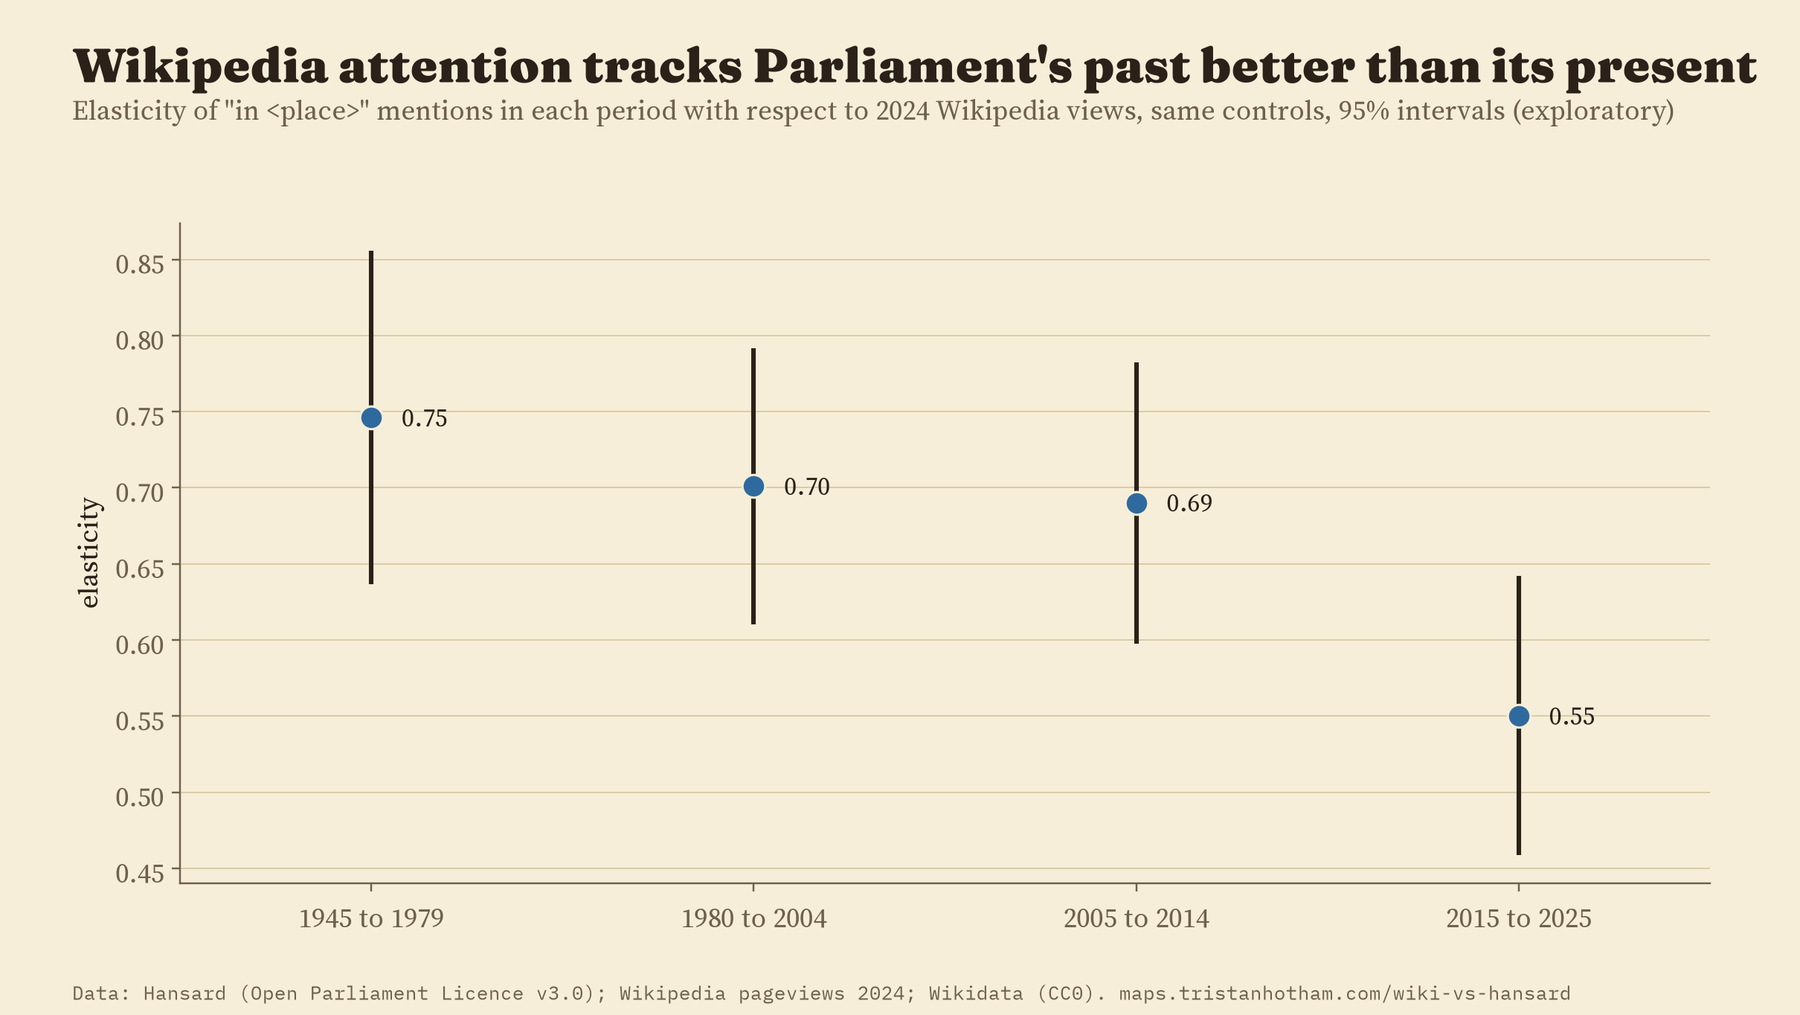
The link between the two weakened over time. Today’s Wikipedia views predict mentions from 2005 to 2014 better than mentions from 2015 to 2025, and, more oddly, they line up best of all with the debates of 1945 to 1979. What people look up now looks more like Parliament’s old map of Britain than its current one.
How I did this
The Commons counts come from Mentioned in the House. The “in” phrase leaves out “the hon. Member for”, surnames and lists of votes; names that are ordinary words were checked by sample, and names shared by two places were left out. Wikipedia views are human readers only, from Wikimedia’s pageview counts, for the article each place’s Wikidata entry points to. I wrote the analysis plan down before running the models, then reran the main model 20 ways: other years, other population sources, stricter or looser name matching, without the biggest places, and with one region left out at a time. The share of extra mentions linked to a seat name stayed between 92% and 154%.
This is a comparison, not an experiment. Wikipedia views follow tourism, television, news and naming quirks, and readers come from all over the world. One year of reading is set against twenty-one years of debate. And being talked about in Parliament is not the same as being helped by it.
Notes and sources
- Hansard, House of Commons, via the UK Parliament Hansard API, counted in Mentioned in the House (Hotham 2026). Contains Parliamentary information licensed under the Open Parliament Licence v3.0.
- Seat names at the 2005, 2010 and 2024 general elections from Who Won Here? (Hotham 2026).
- English Wikipedia pageviews (Wikimedia, CC0) and Wikidata (CC0). 2011 Census and boundaries from the ONS (Open Government Licence v3.0). Base map: OpenFreeMap, OpenStreetMap contributors (ODbL).
- Further reading: F. R. Baumgartner and B. D. Jones, Agendas and Instability in American Politics (1993); A. Rodríguez-Pose, The revenge of the places that don’t matter, Cambridge Journal of Regions, Economy and Society (2018); T. Yasseri and J. Bright, Wikipedia traffic data and electoral prediction, EPJ Data Science (2016).
- I wrote the text, with drafting and editing assistance from Claude (Anthropic), which also helped prepare the analysis code. I reviewed and checked all text and results.

