
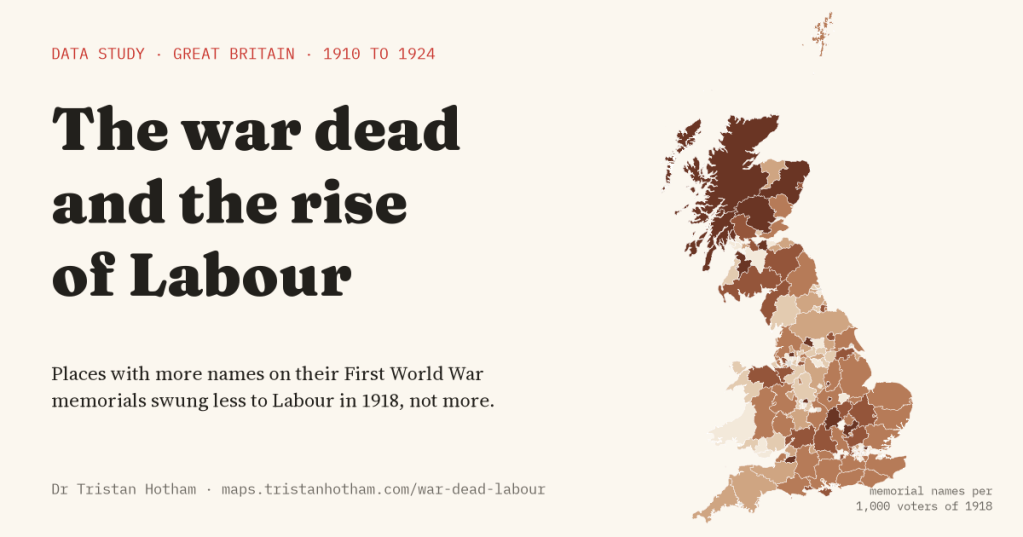
After the First World War, Labour swept past the Liberals. It is tempting to think grief and anger at the slaughter drove voters to the new party. I set the names on 17,689 places’ war memorials against every election from 1906 to 1924 to find out. The places that lost more men swung to Labour less, not more.
On 14 December 1918, a month after the guns stopped, Britain voted for the first time in eight years. Almost every man over 21, and women over 30 who met a property test, could now vote, and the electorate in Great Britain was 2.8 times the size it had been in 1910. Labour’s share of the vote in contested seats rose from 6.8% to 23.8%, and by 1924 it was the main opposition. The Liberals, the party of government when the war began, never recovered.
Historians still argue about why. Some point to the new voters, some to the Liberal split over the war, some to Labour’s growing strength in the unions before 1914. And there is a darker idea: that the slaughter itself turned people against the old order. In Italy and Germany, places that lost more men did go on to back radical parties. Did the same happen here, towards Labour?
Few studies have tested this for how Britain voted between the parties, partly because there is no count of the dead by constituency and no map of the 1918 seats. But there are the war memorials. Almost every village, town and parish put up a cross, a plaque or a board with the names of its dead, and the Imperial War Museums’ War Memorials Register records how many names most of them carry. I had already counted them place by place for an earlier study, taking one community memorial per place so that nobody is counted twice. Here I set those names against every election result from 1906 to 1924.
More names, less Labour
Because the 1918 seats were new, I compared the same ground before and after the war: 176 counties, county towns and boroughs, with every seat and every memorial placed inside one of them. In the typical one there were 44 names on community memorials for every 1,000 voters of 1918.
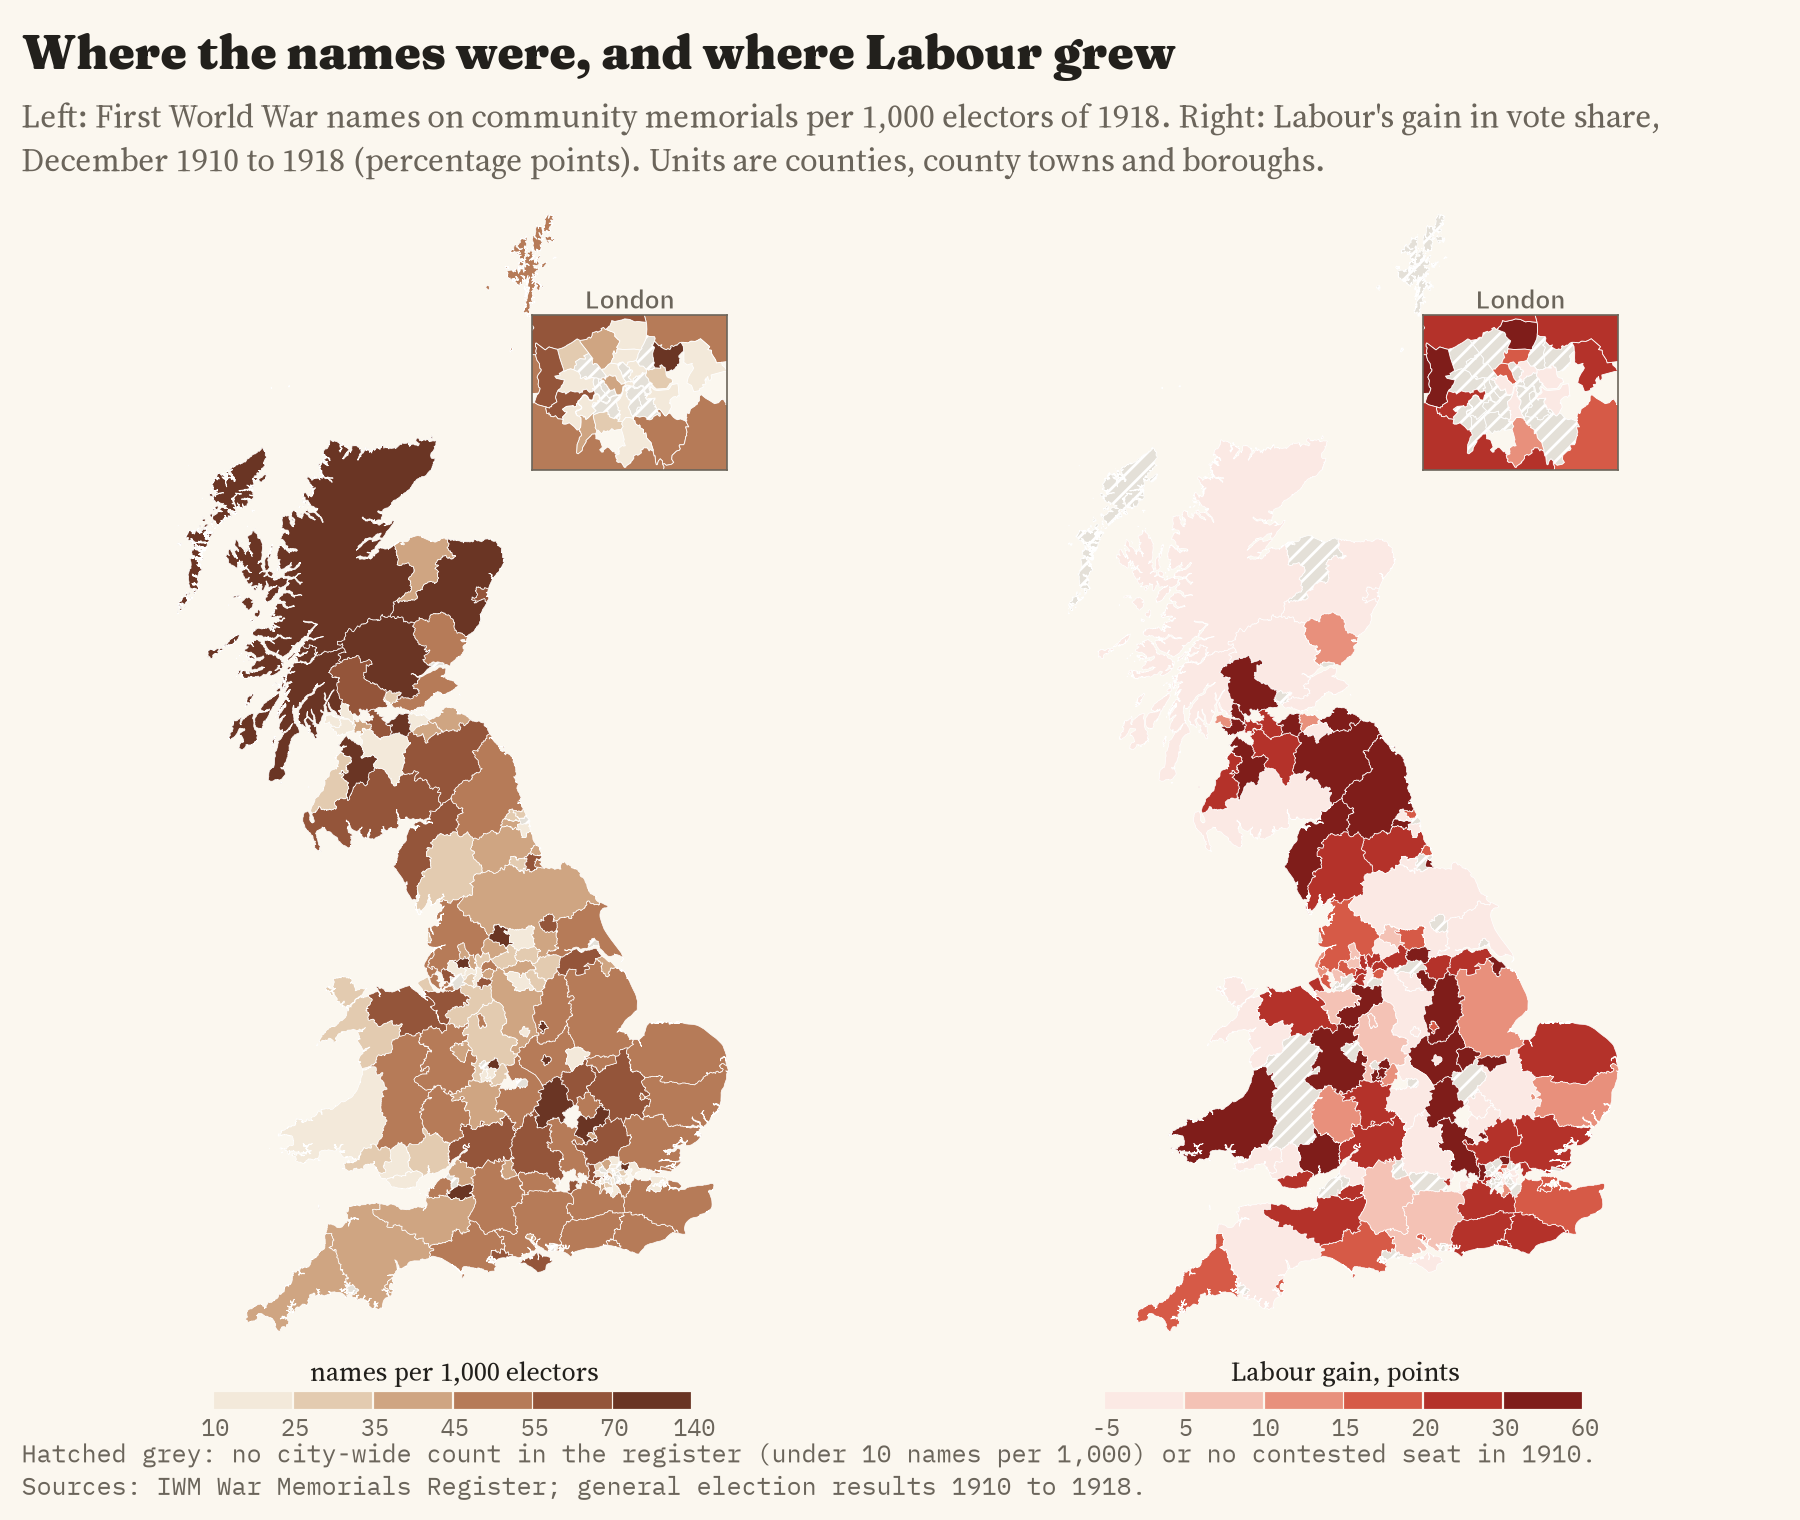
Put the two side by side and they do not match. Where there were more names per voter, Labour grew less. Comparing places in the same region, and allowing for how built up they were and how Labour and the Liberals had done in 1910, each step of 22 more names per 1,000 voters went with a Labour gain 2.9 points smaller. The average gain was 17.6 points, so this is a modest difference. It is also not a sure thing: I looked at four outcomes, and once I allow for that, a gap this size could turn up by chance about one time in six. Read it as a hint, not a settled finding.
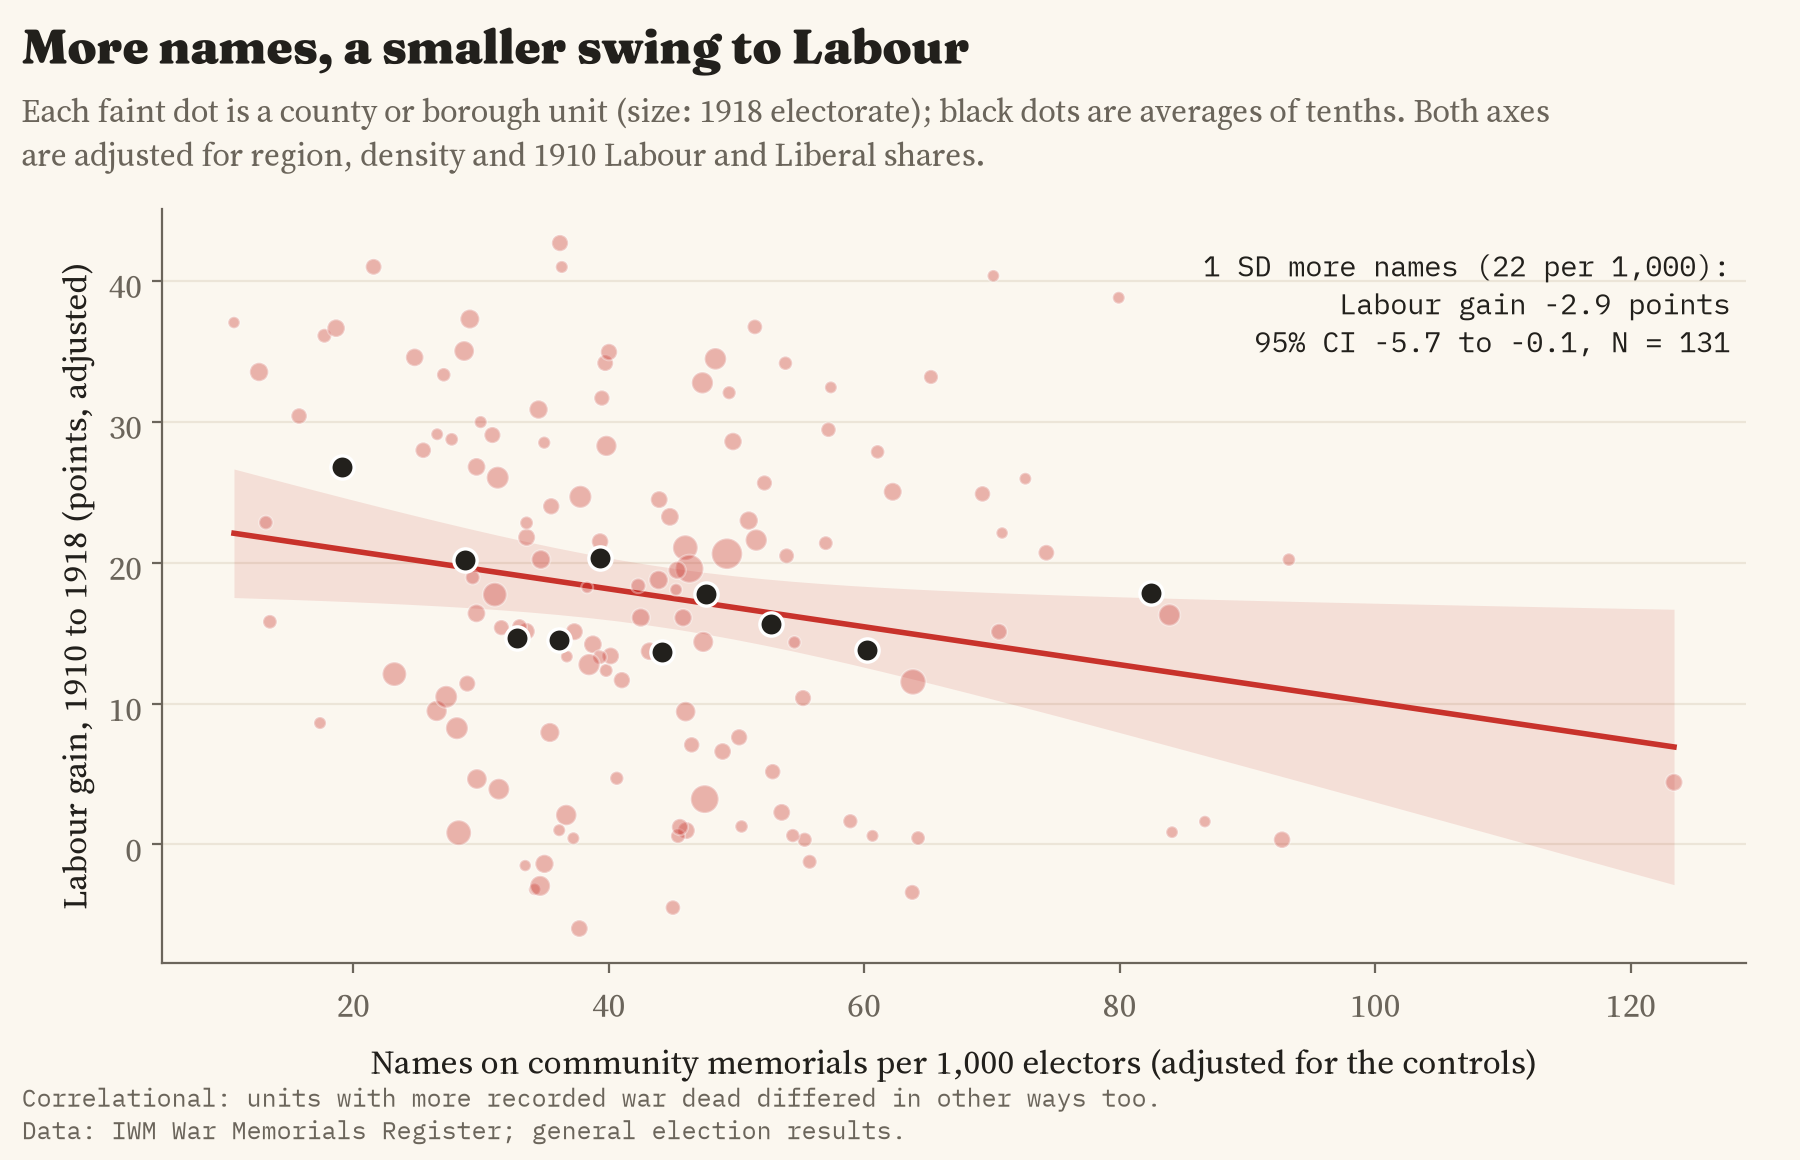
The places that gave most men to the war were not the places where Labour advanced.
Not there before the war, wider after it
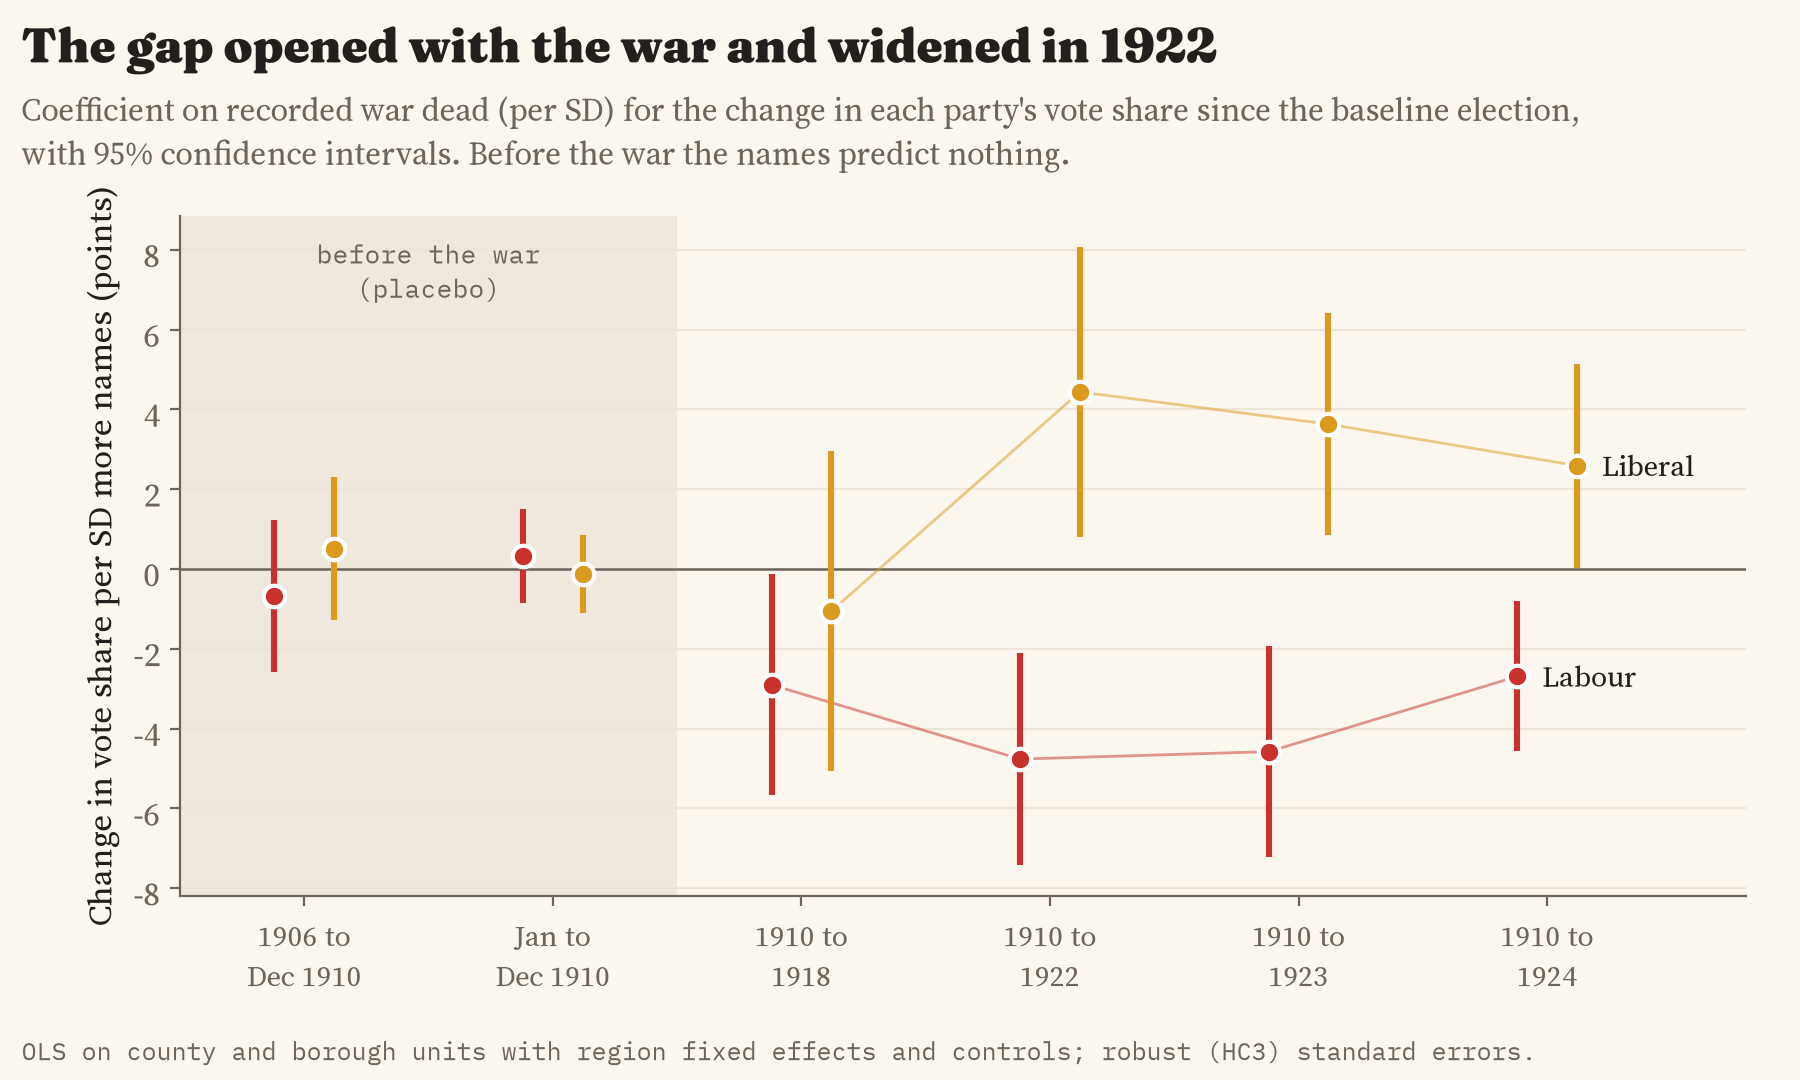
The obvious worry is that the memorials are just picking out a kind of place: rural, settled, never very likely to vote Labour. If so, they should predict how places voted before the war too. They do not. Between 1906 and 1910, and between the two elections of 1910, the names predict nothing at all. The gap opens in 1918, and by 1922 it is wider still: Labour’s gain since 1910 was 4.8 points smaller for the same step, and the Liberals held up 4.4 points better.
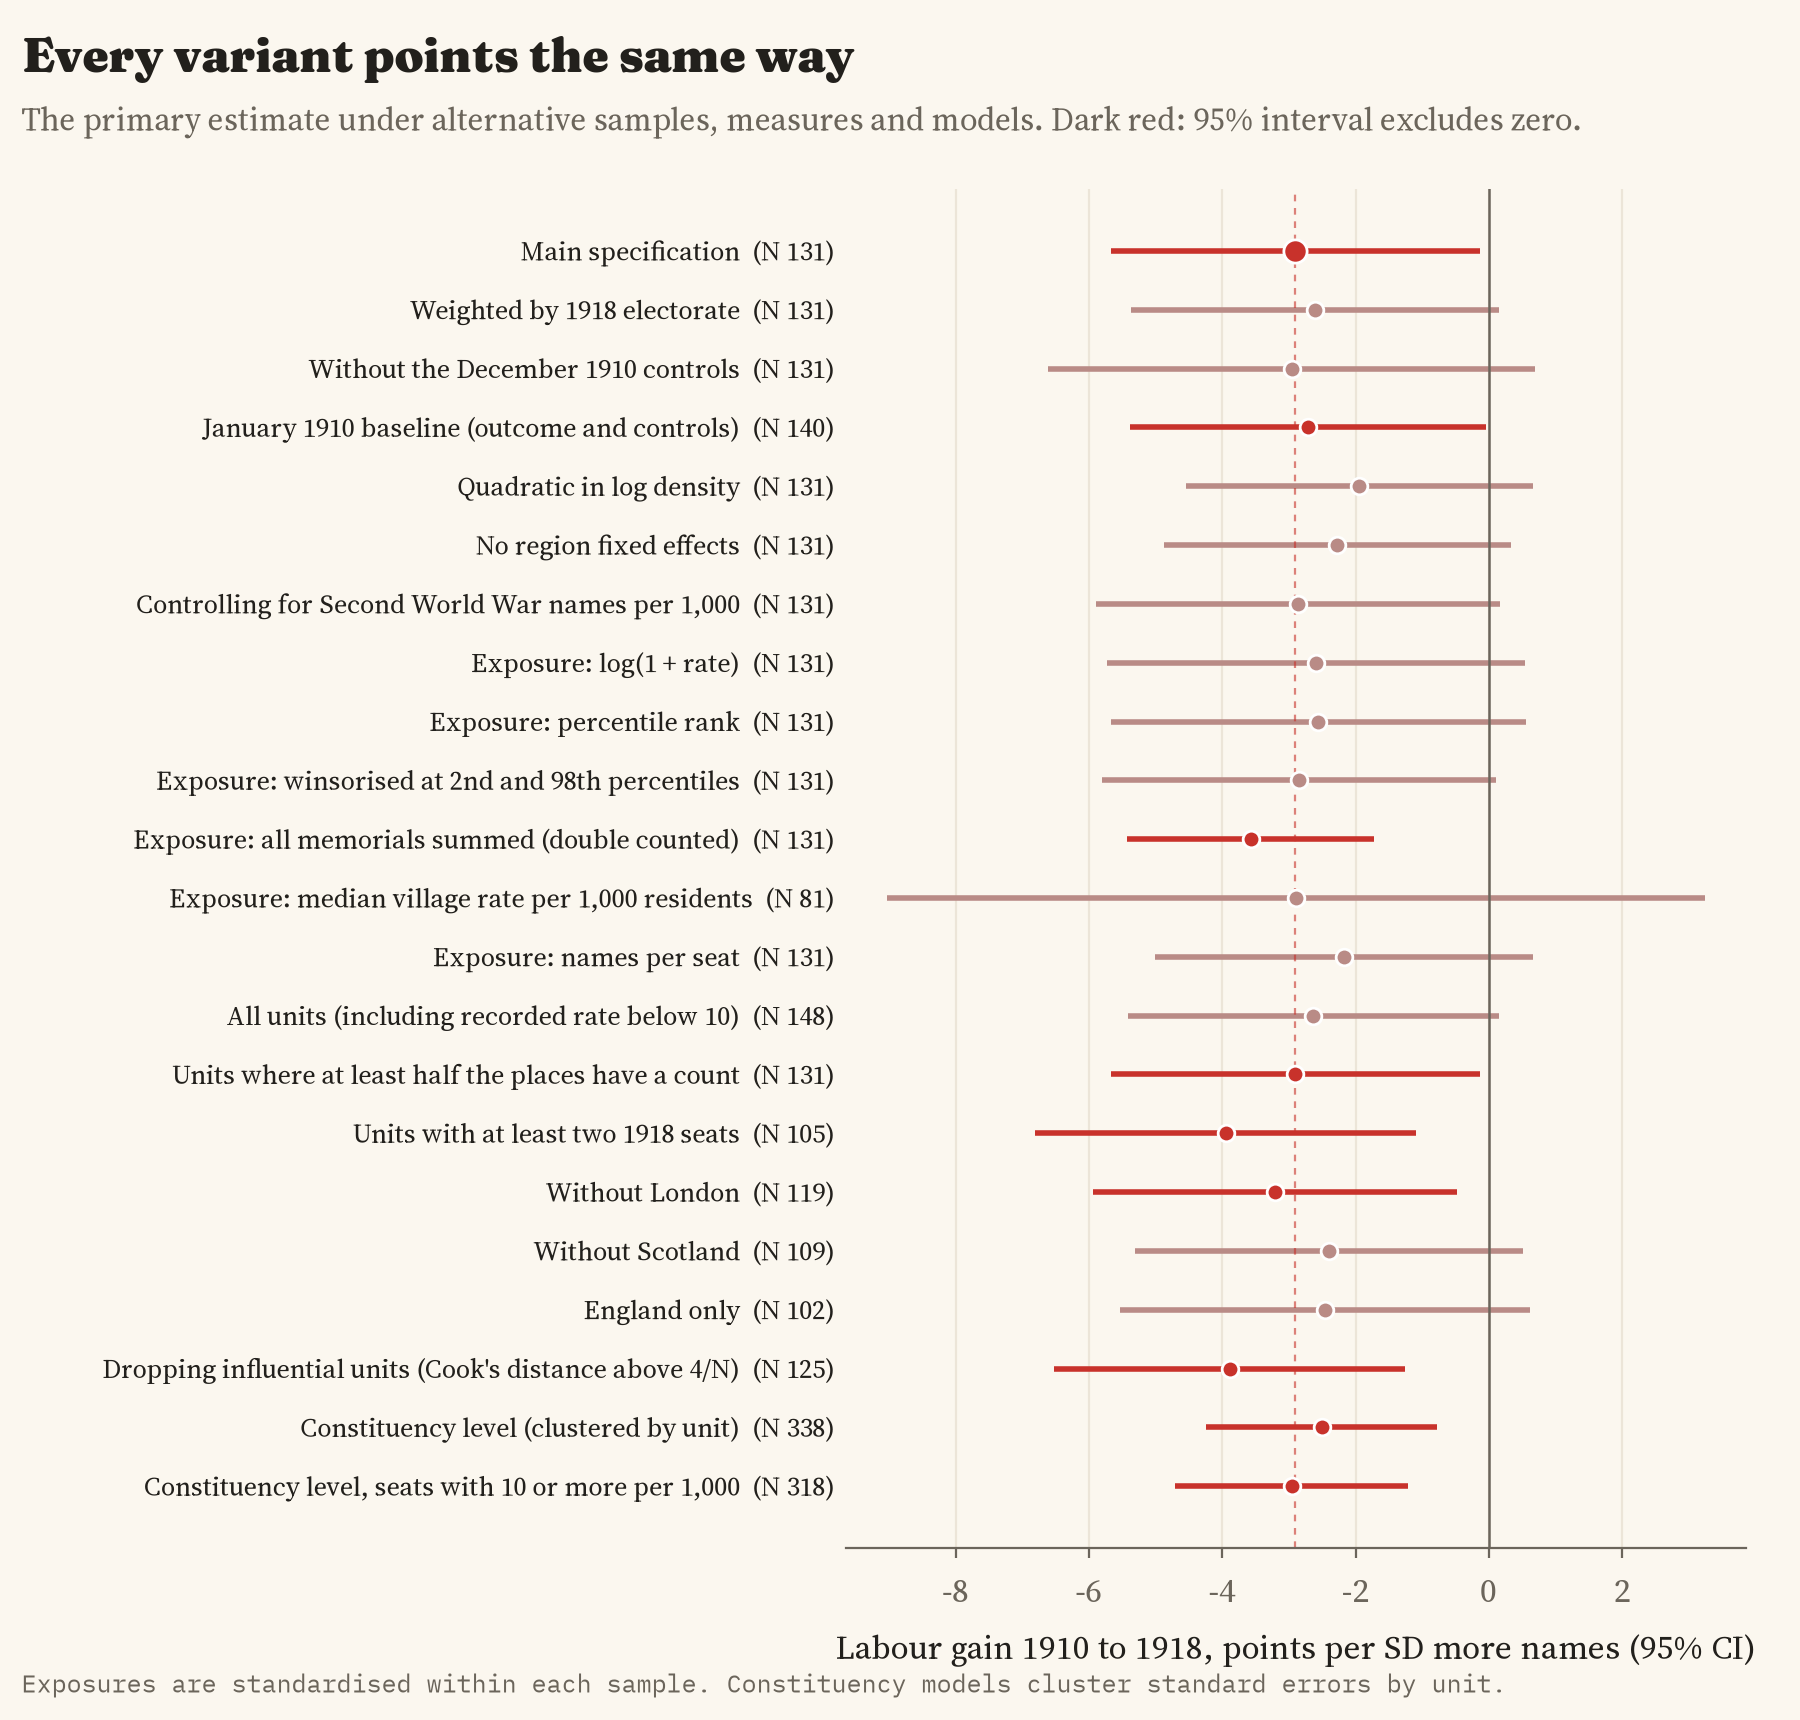
I wrote down what I would test, and what would count against each idea, before I ran any of these models. Then I tried many other ways of asking the same question: different ways of counting the names, weighting big places more, leaving out London, Scotland or any one region, and working seat by seat. Every one of them points the same way, though more than half are too uncertain on their own to rule out no difference at all.
What it does not mean
This does not show that grief made people vote Liberal or Conservative. Men did not die at random. The volunteers of 1914 and 1915 came more from some trades than others, and miners, munitions workers and shipbuilders were often kept at home because the war needed them there. Those industrial places were exactly where Labour grew fastest, and I have no figures on industry for 1918 to separate the two. Part of what the memorials measure is who went to war, not only who grieved.
One more check, which I had not planned, points the same way. In the places where Labour put up a candidate in 1918, the names barely predict how well it did. Most of the gap comes from where Labour stood at all: places with more names on their memorials had fewer Labour candidates. That is a story about local parties and unions as much as about voters.
Whatever the reason, the old picture of a grieving country turning to Labour does not fit the map. In Italy and Germany the parties that gained from the dead were the ones that rejected the peace. In Britain the war had been won, and the party that claimed the victory was Lloyd George’s coalition. The places with most names, if they leaned anywhere, leaned that way.
How I did this
The memorial names come from the War Memorials Register, grouped into places; for each place I took the one community memorial with the most names of the dead, so a man named on a village cross, a church board and a works roll counts once. That gives 717,287 names across Great Britain. The election results come from my map of every general election since 1832. Because there are no maps of the 1918 seats, I put seats and memorials into the same 176 areas: English counties with their big towns and London boroughs as separate areas, Welsh counties and Scottish council areas. I checked the matching by testing whether places named after a borough seat ended up in it: 92% went to the right seat and 97% to the right area.
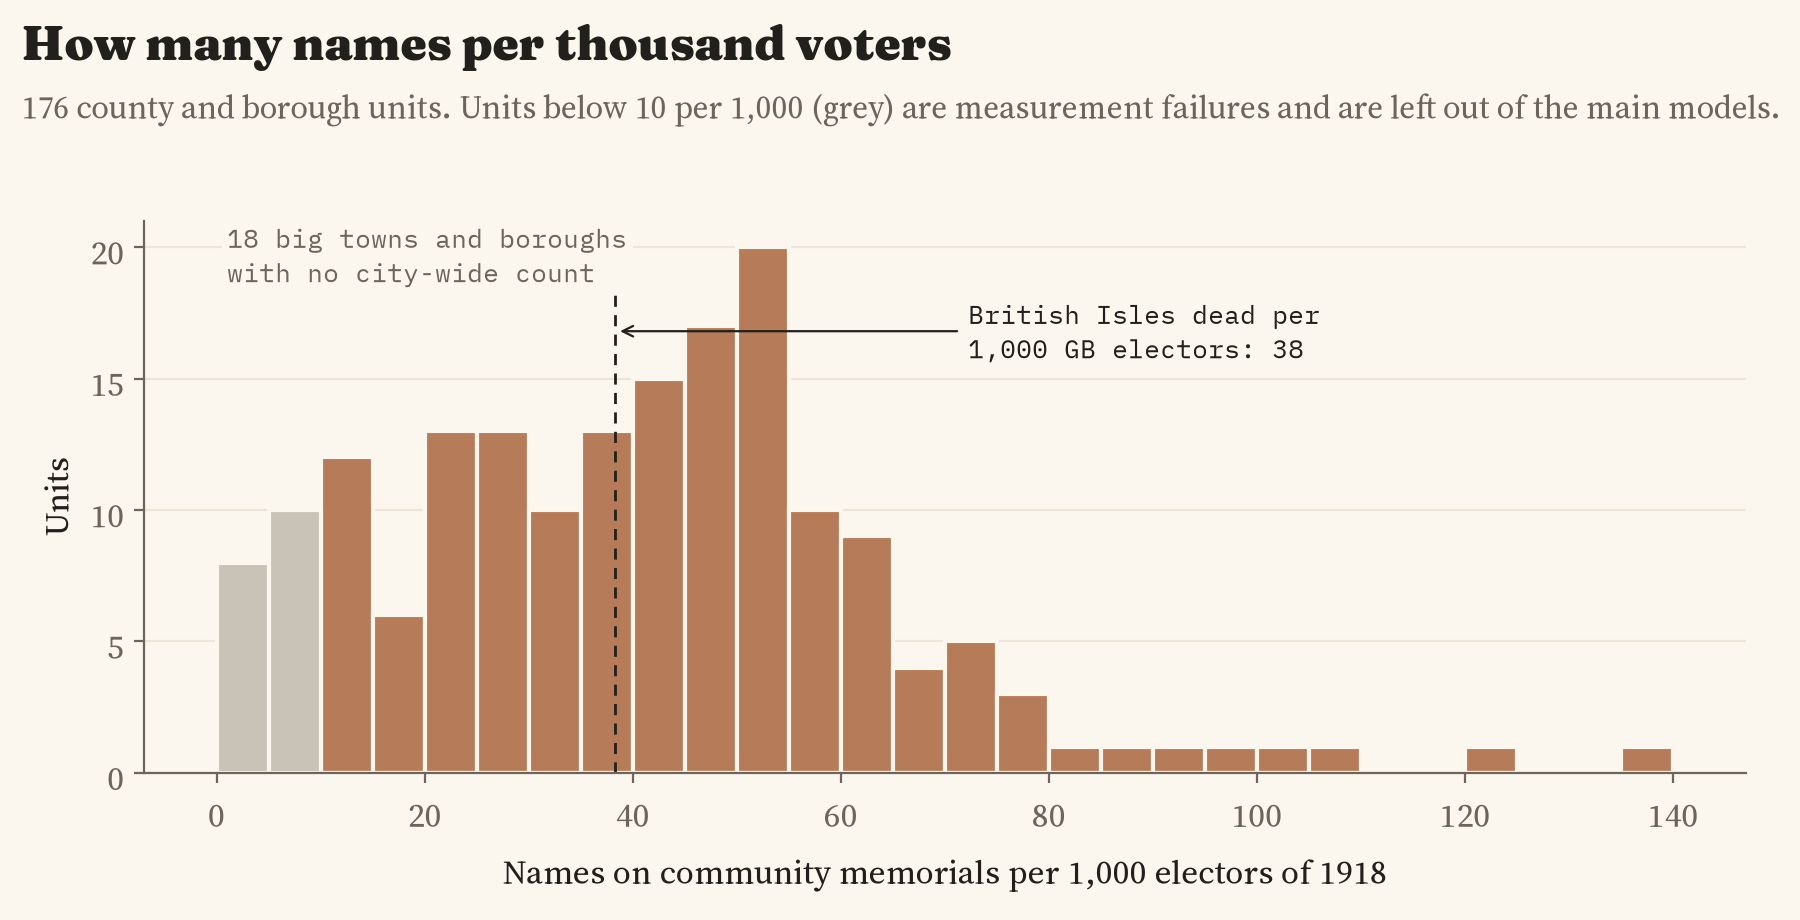
The caveats matter. Memorial names are not a census of the dead: many memorials have no count, men were sometimes named where their parents lived rather than where they did, and 18 big towns and boroughs, Plymouth, Portsmouth and Bristol among them, have no city-wide roll in the register at all. I left those out of the main comparison and put them back in as a check, which made the gap slightly smaller and less certain. The number of voters is worked out from turnout, and 79 seats had no contest in 1918. And an area as big as a county lumps a mining valley and a market town together. This is a pattern across places, not a measure of how any family voted.
Notes and sources
- War memorials: Imperial War Museums, War Memorials Register, reused for non-commercial research. Elections: constituency results 1906 to 1924 from the UK Parliament general election results (Open Parliament Licence), matched to Wikidata. Boundaries: ONS (Open Government Licence). Base map: OpenFreeMap, OpenStreetMap contributors (ODbL).
- Further reading: T. Wilson, The Downfall of the Liberal Party 1914 to 1935 (1966); R. McKibbin, The Evolution of the Labour Party 1910 to 1924 (1974); D. Tanner, Political Change and the Labour Party 1900 to 1918 (1990); J. M. Winter, The Great War and the British People (1985); A. King, Memorials of the Great War in Britain (1998); D. Acemoglu and others, War, Socialism, and the Rise of Fascism, Quarterly Journal of Economics (2022).
- I wrote the text, with drafting and editing assistance from Claude (Anthropic), which also helped prepare the analysis code. I reviewed and checked all text and results.

