
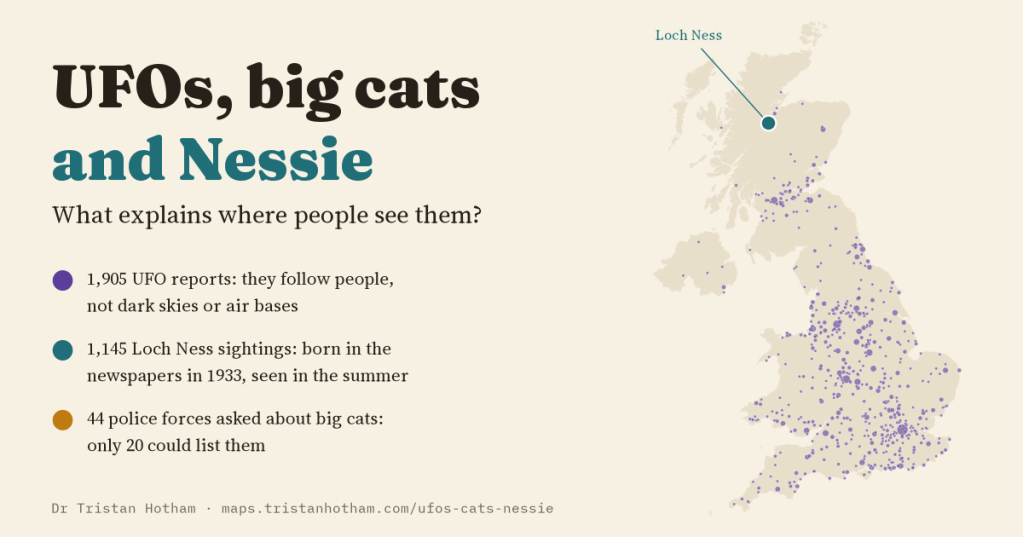
Lights in the sky, a black cat the size of a Labrador, a hump in Loch Ness. People in the UK report all three, and the reports have been collected. I set 1,905 UFO reports, 1,145 Nessie sightings and the replies of 44 police forces about big cats against the ordinary things that might explain them. The ordinary things win.
After the ghosts and the ley lines, I wanted to finish the set. Haunted houses turned out to be mostly old castles and old pubs, and ley lines turned out to be what you get when you draw lines through a crowded landscape. This time it is the three great British mysteries of the living sky and countryside: UFOs, big cats and the Loch Ness Monster.
I am not going to argue about any single sighting. That argument never ends, because one report almost never holds enough to settle it. Instead I counted. If the reports come from ordinary things (people looking, the places they look, the seasons when they are outside, the newspapers that tell them what to look for, and the offices that write it all down) those things should leave fingerprints on where and when the reports turn up. I wrote down the tests before I looked at the answers.
UFOs: where the people are
The US National UFO Reporting Center takes reports from anyone, and a cleaned copy of its records holds 80,332 of them up to 2014. 1,905 come from the UK, each pinned to the town the witness named. I counted them by council. London’s 231 reports count as one place, because most of them sit on one central London point.
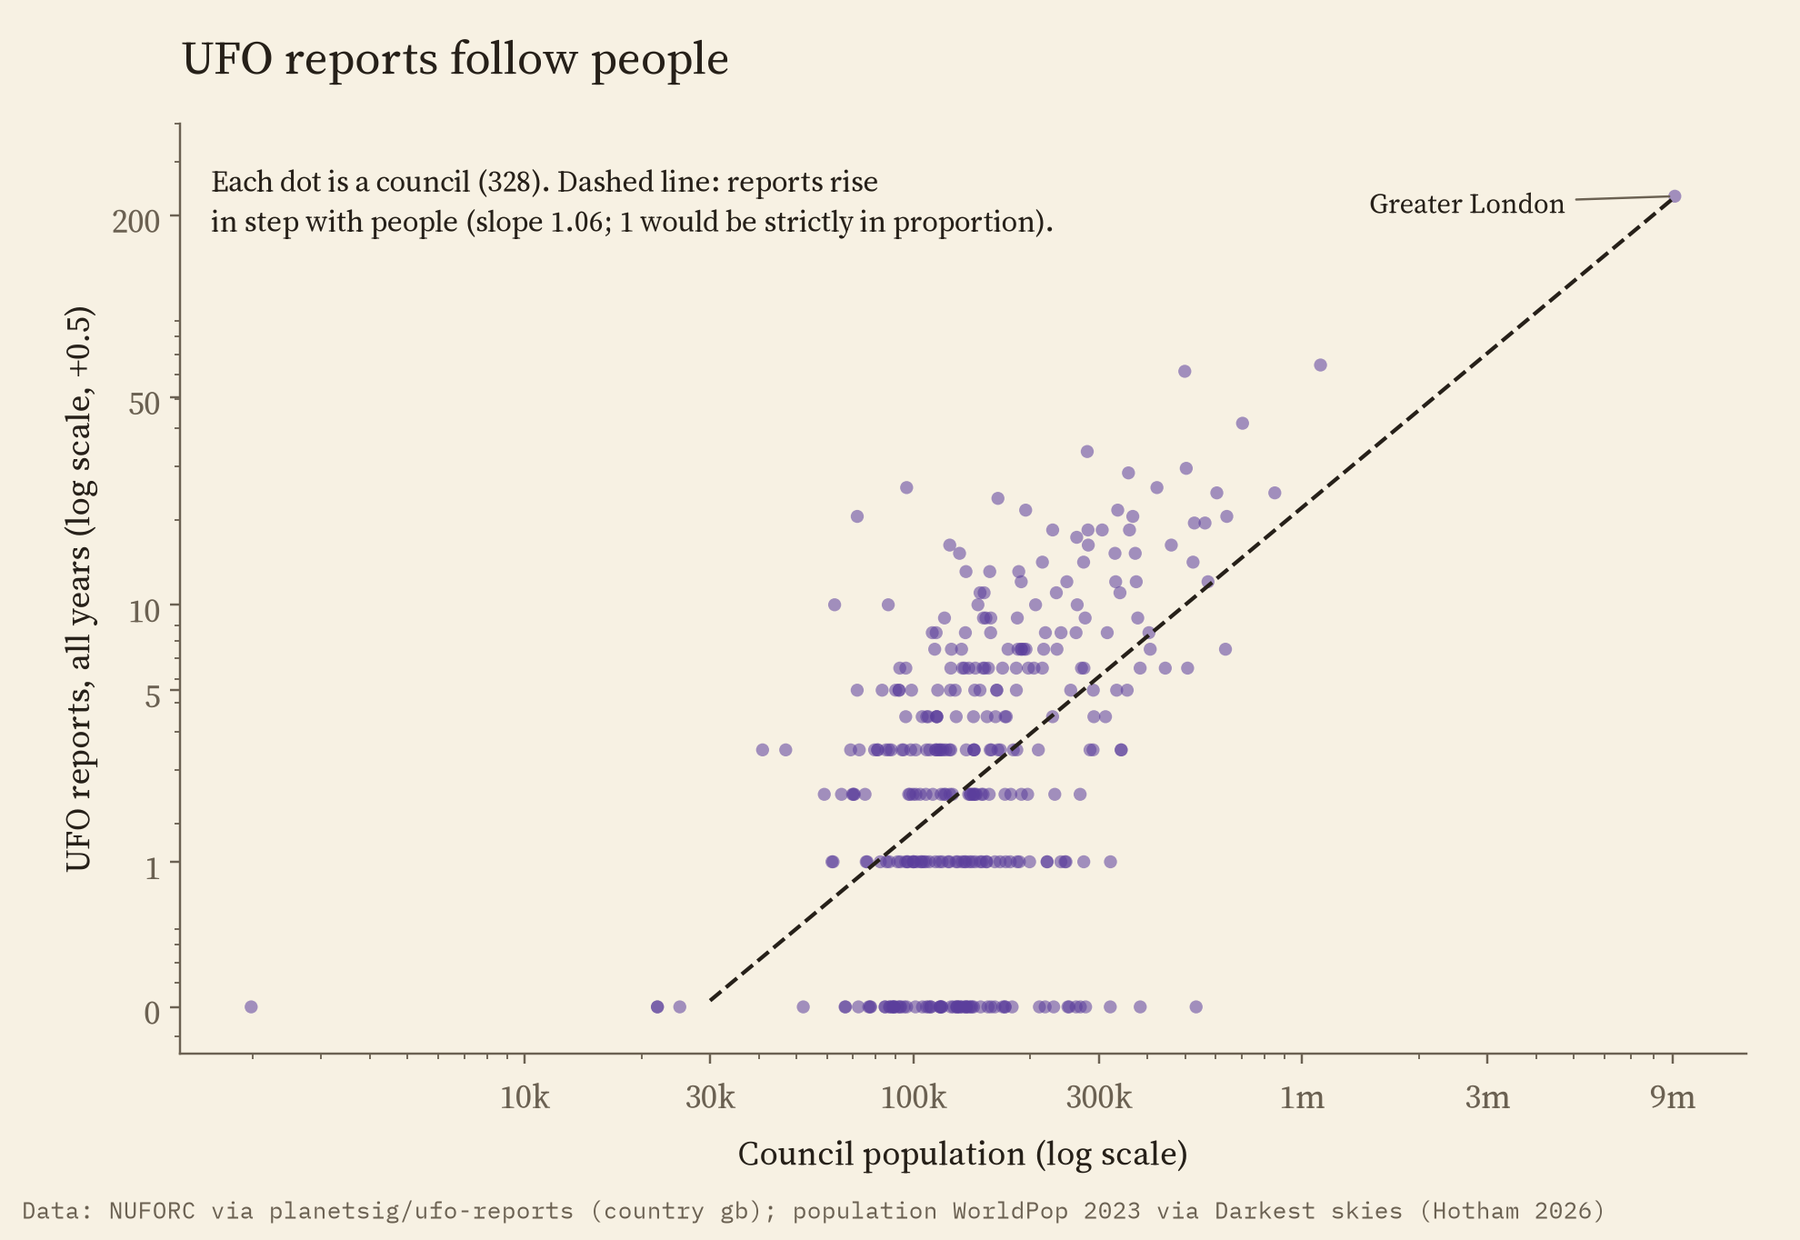
The first thing that predicts reports is people. Double a council’s population and its reports roughly double too. The scaling is 1.08, where 1 would be exactly in step.
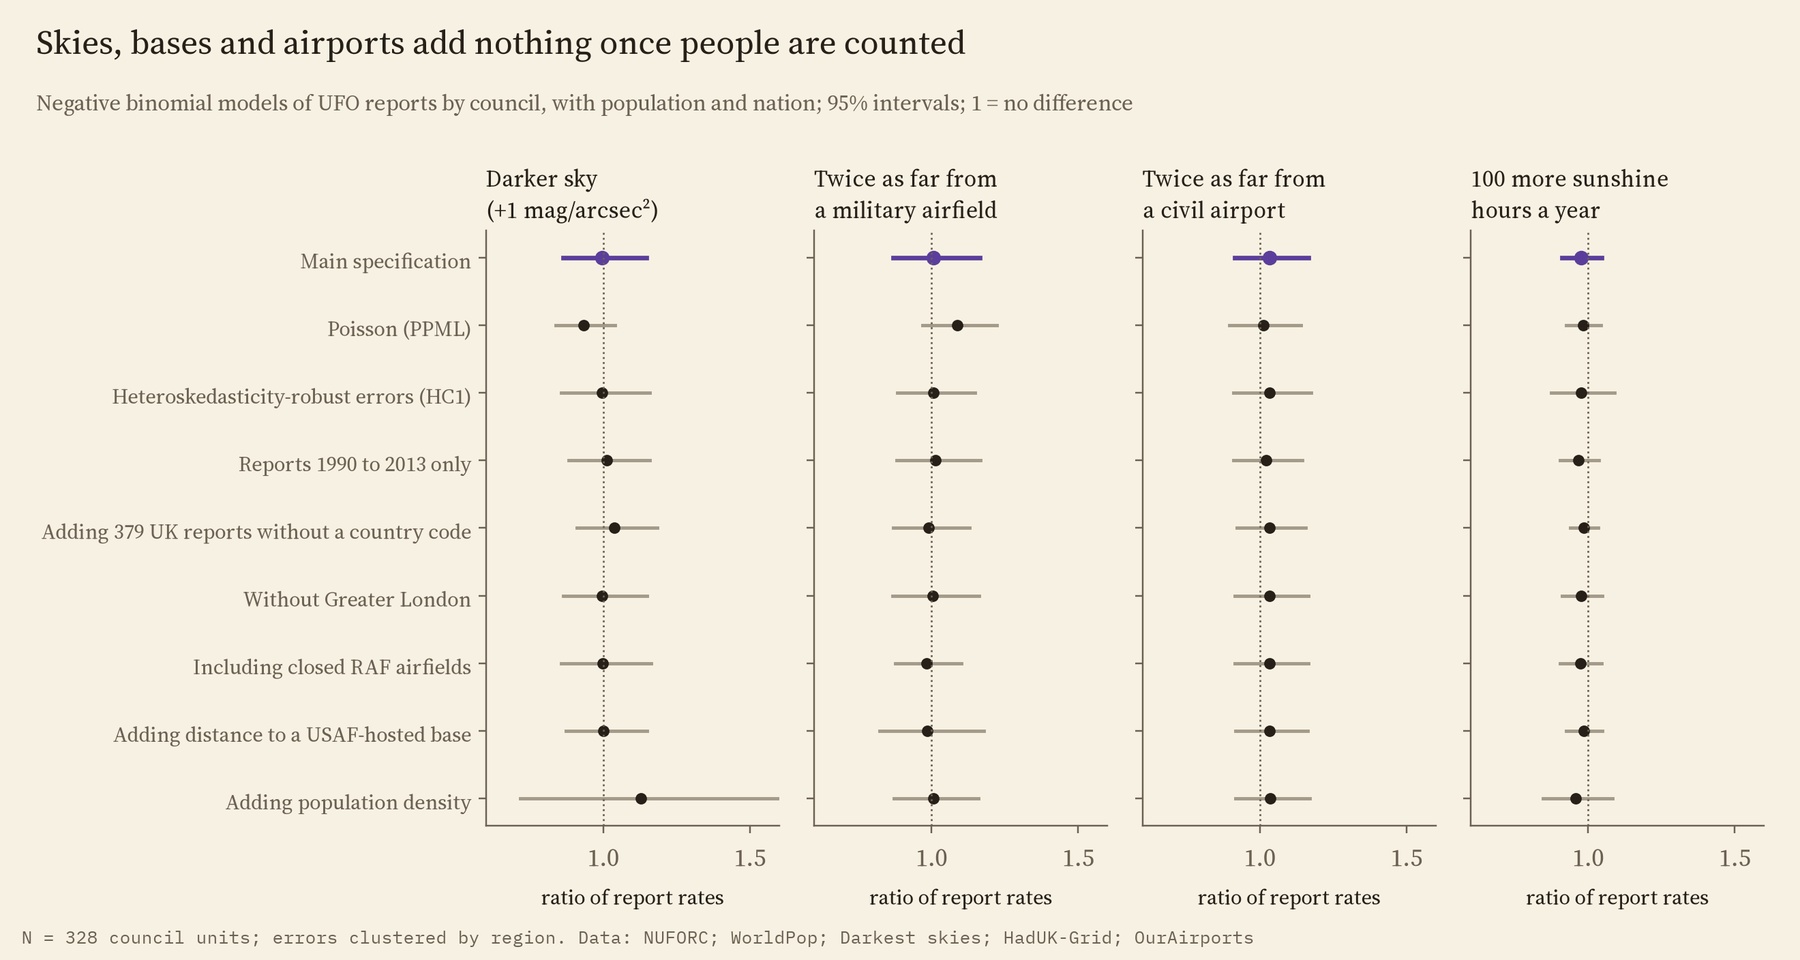
Then I tried the usual suspects. Dark skies should let people see more. Air bases and airports put more lights in the sky. Sunny places should have more clear nights. If any of these mattered, councils with more of them should have more reports for their size. None of them does. Darker skies, a military airfield nearby, a civil airport nearby, more sunshine: every one comes out at about no difference, and the uncertainty rules out anything more than a modest effect.
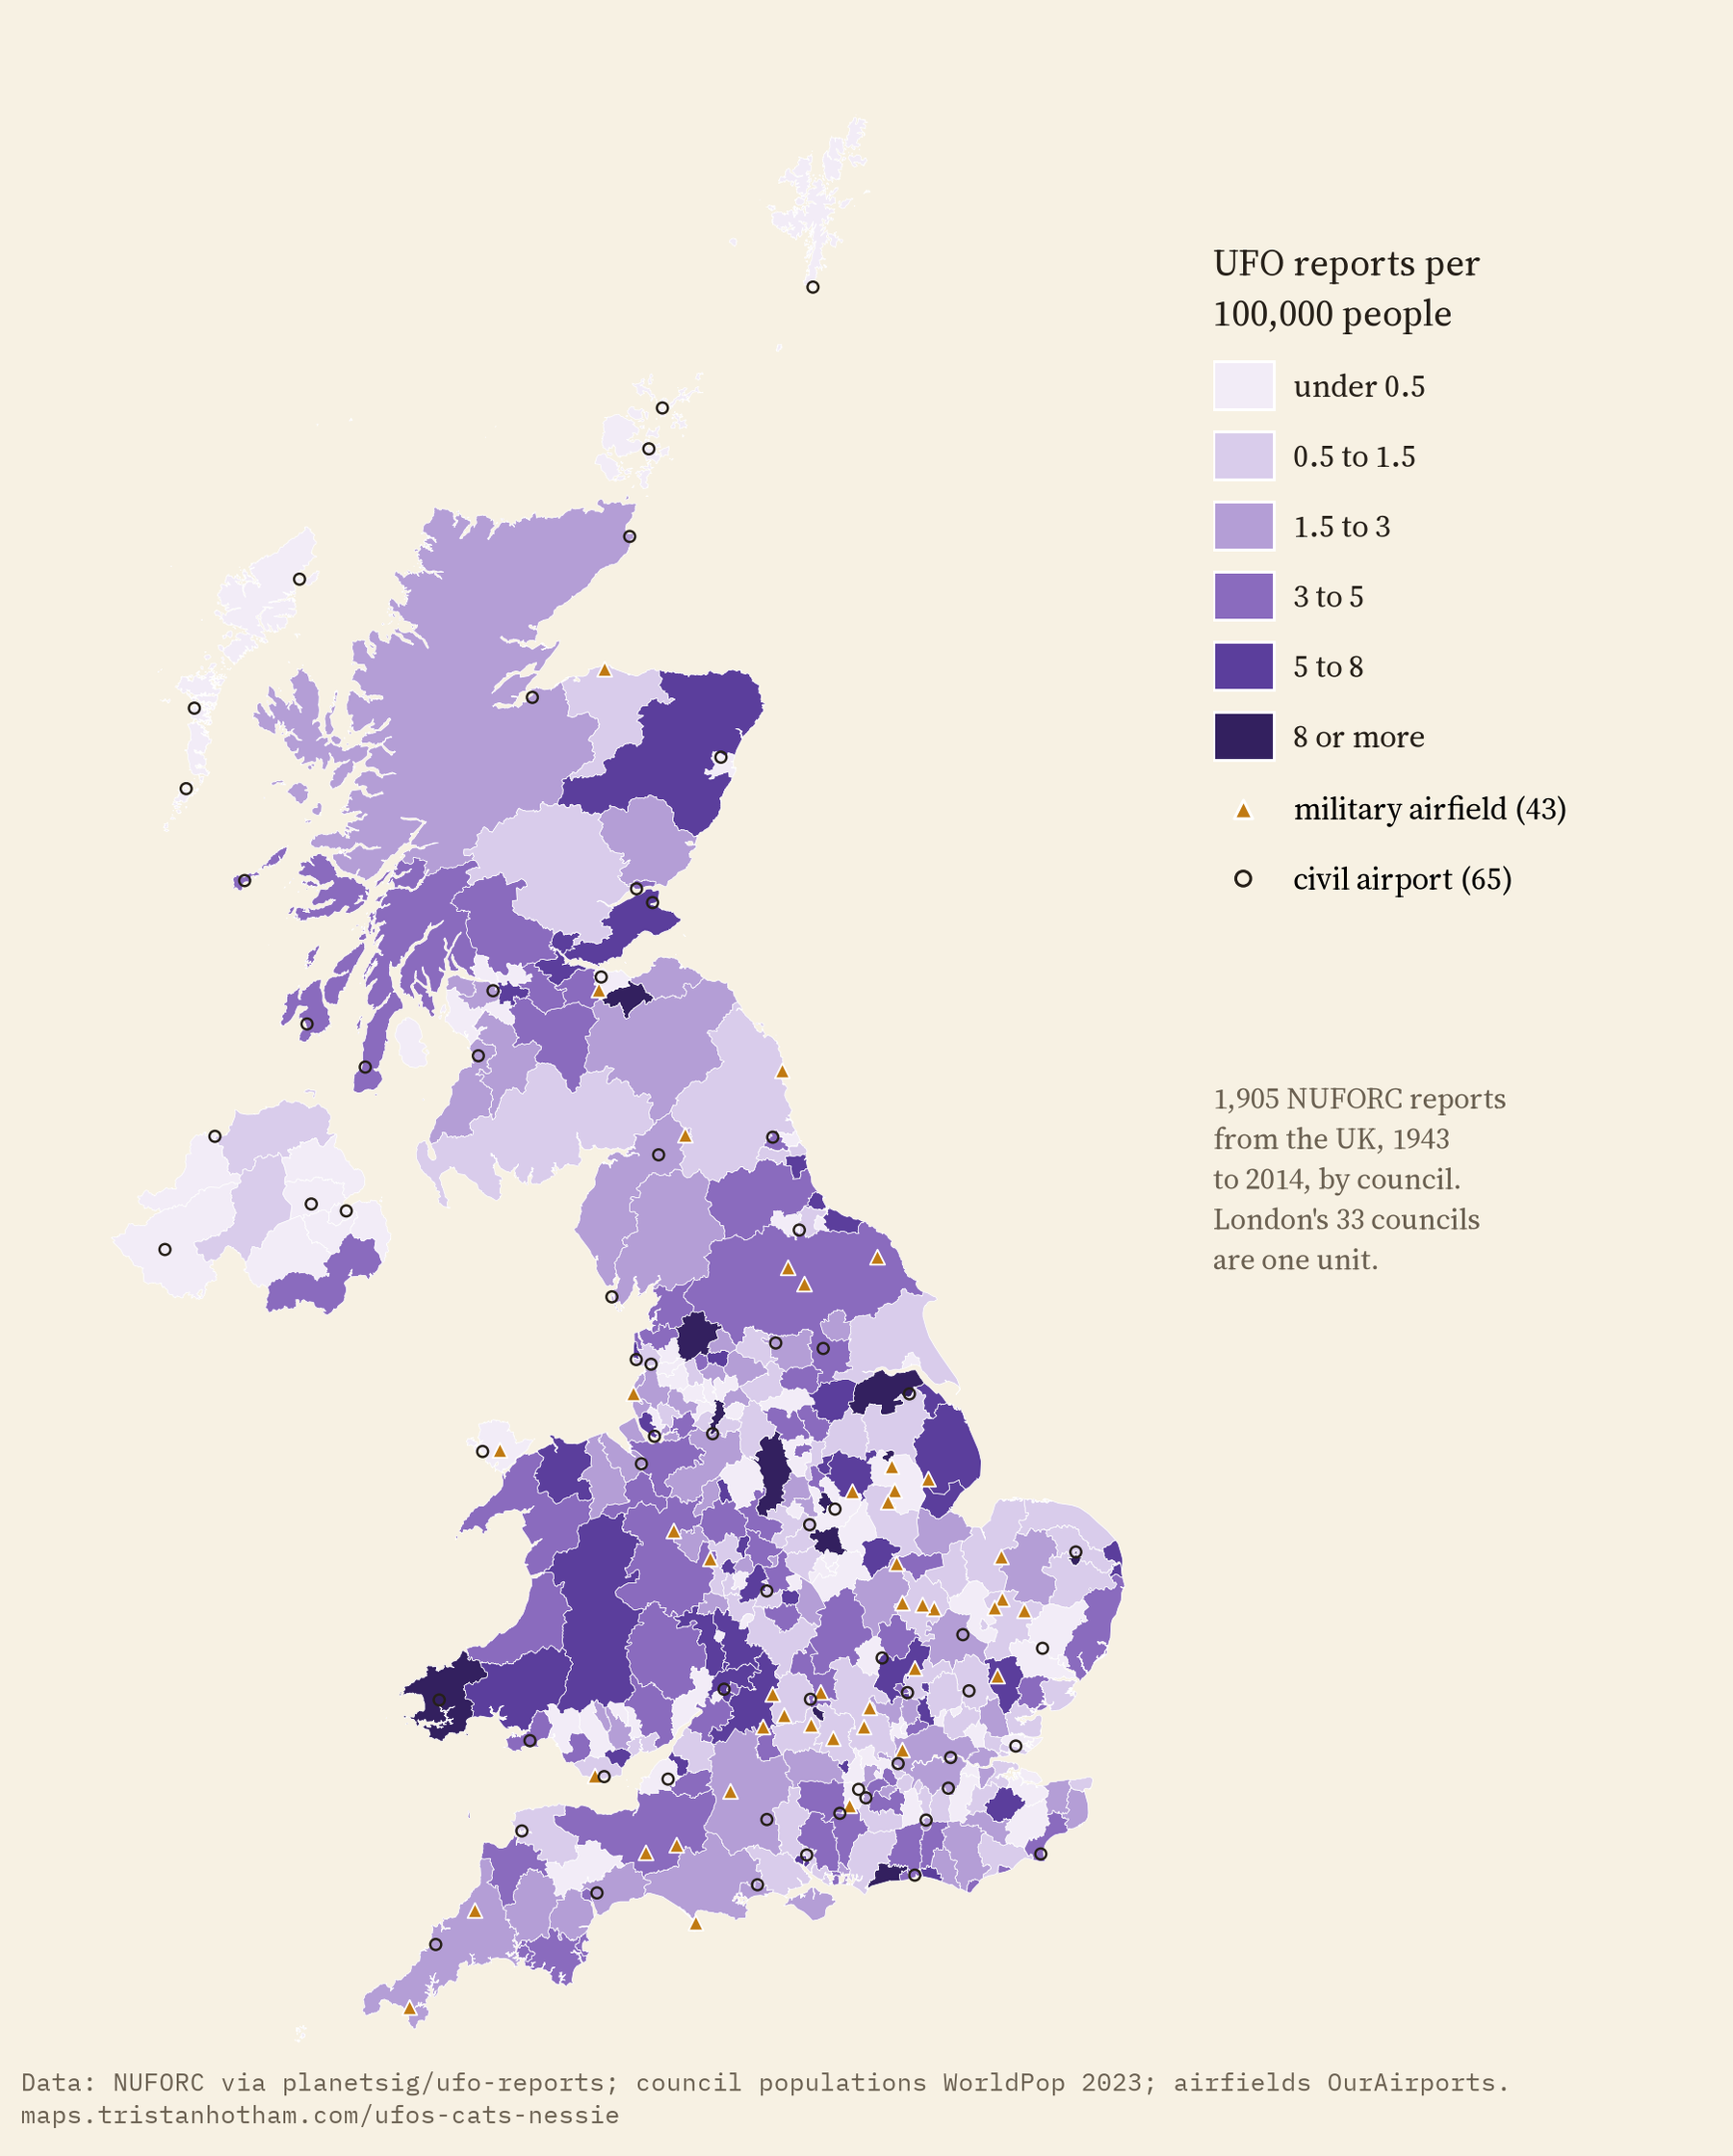
I checked it two more ways. Half the reports come from within 36 km of a military airfield. For random spots spread out like the population, the figure is 37 km. And when I scattered the same number of pretend air bases at random across the map, 500 times, the real ones did no better than the fakes.
UFO reports follow people, not skies or air bases.
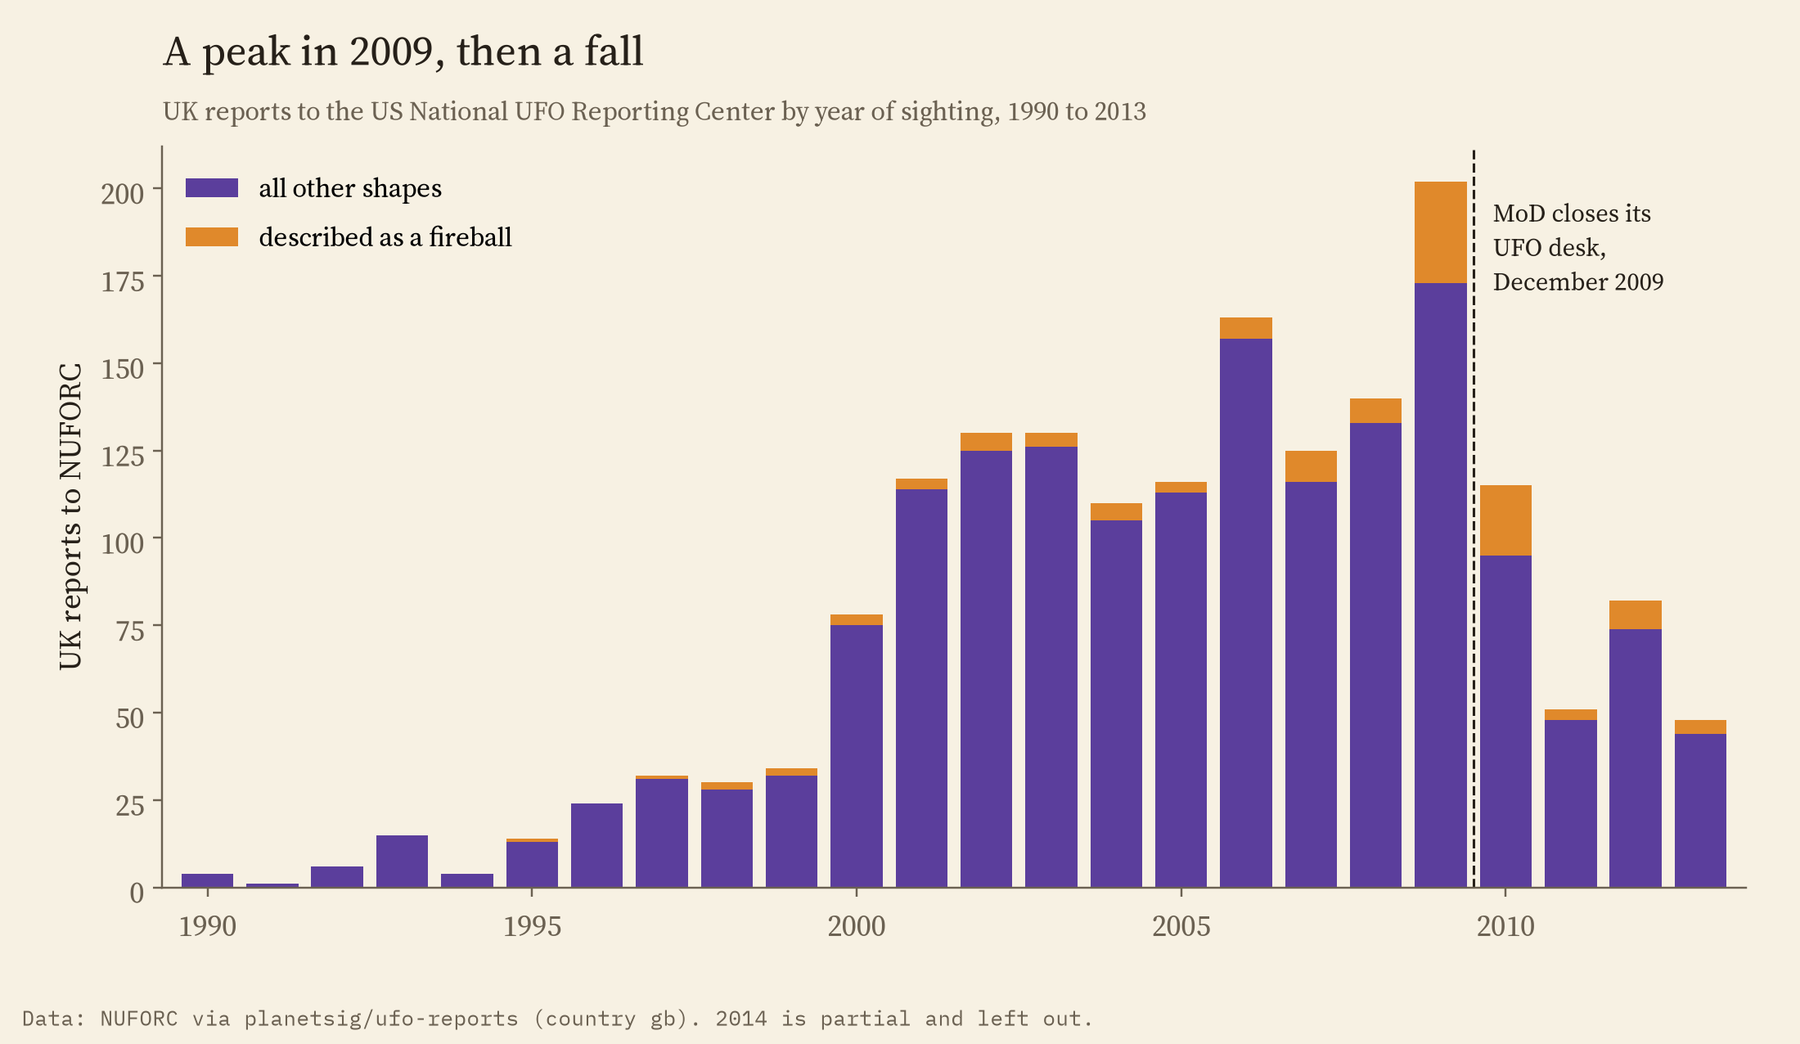
There is one striking thing in time. UK reports peaked in 2009 with 202, and 29 of them were fireballs. The National Archives’ guide to the Ministry of Defence UFO files says that many of the ministry’s own reports in 2008 and 2009 were Chinese lanterns. The ministry closed its UFO desk that December, and UK reports to the American center then fell to 48 by 2013. It is tempting to join those dots, but the same simple model also finds significant drops in years when nothing happened, so I leave it as a description.
Nessie: born in the newspapers
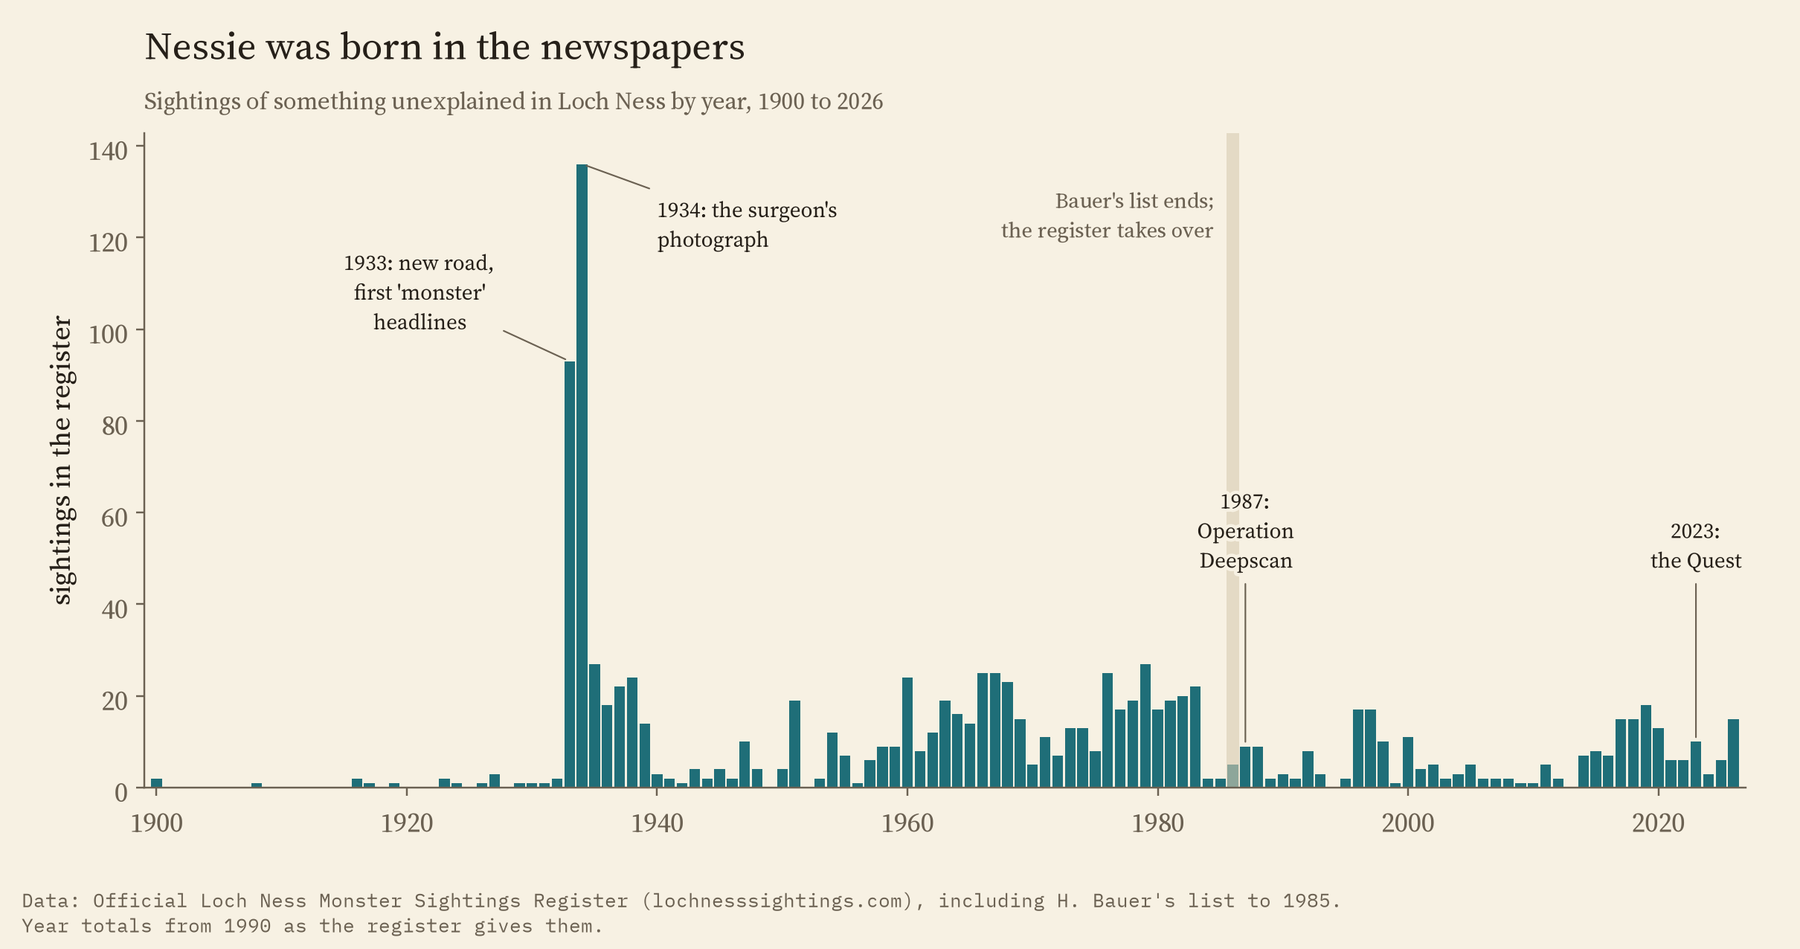
The Official Loch Ness Monster Sightings Register lists every sighting it knows of, from Saint Columba in 565 onwards: 1,180 by its own count. Up to 1985 it reproduces the list in Henry Bauer’s book The Enigma of Loch Ness, as scanned pages. I read the scans by machine and the later pages as text and got back 1,145 sightings, 97% of the register’s count.
Before 1933 there are only a few a decade. In 1933 a new road had just been built along the loch and the Inverness Courier ran a story about a “monster”. That year has 93 sightings. 1934, the year of the famous surgeon’s photograph (a hoax, confessed in the 1990s), has 136, more than any year before or since. Later publicity did nothing like it. The sonar sweep of Operation Deepscan in 1987 and the Quest weekend in 2023, billed as the biggest search in fifty years, came in years with no more sightings than the five before.
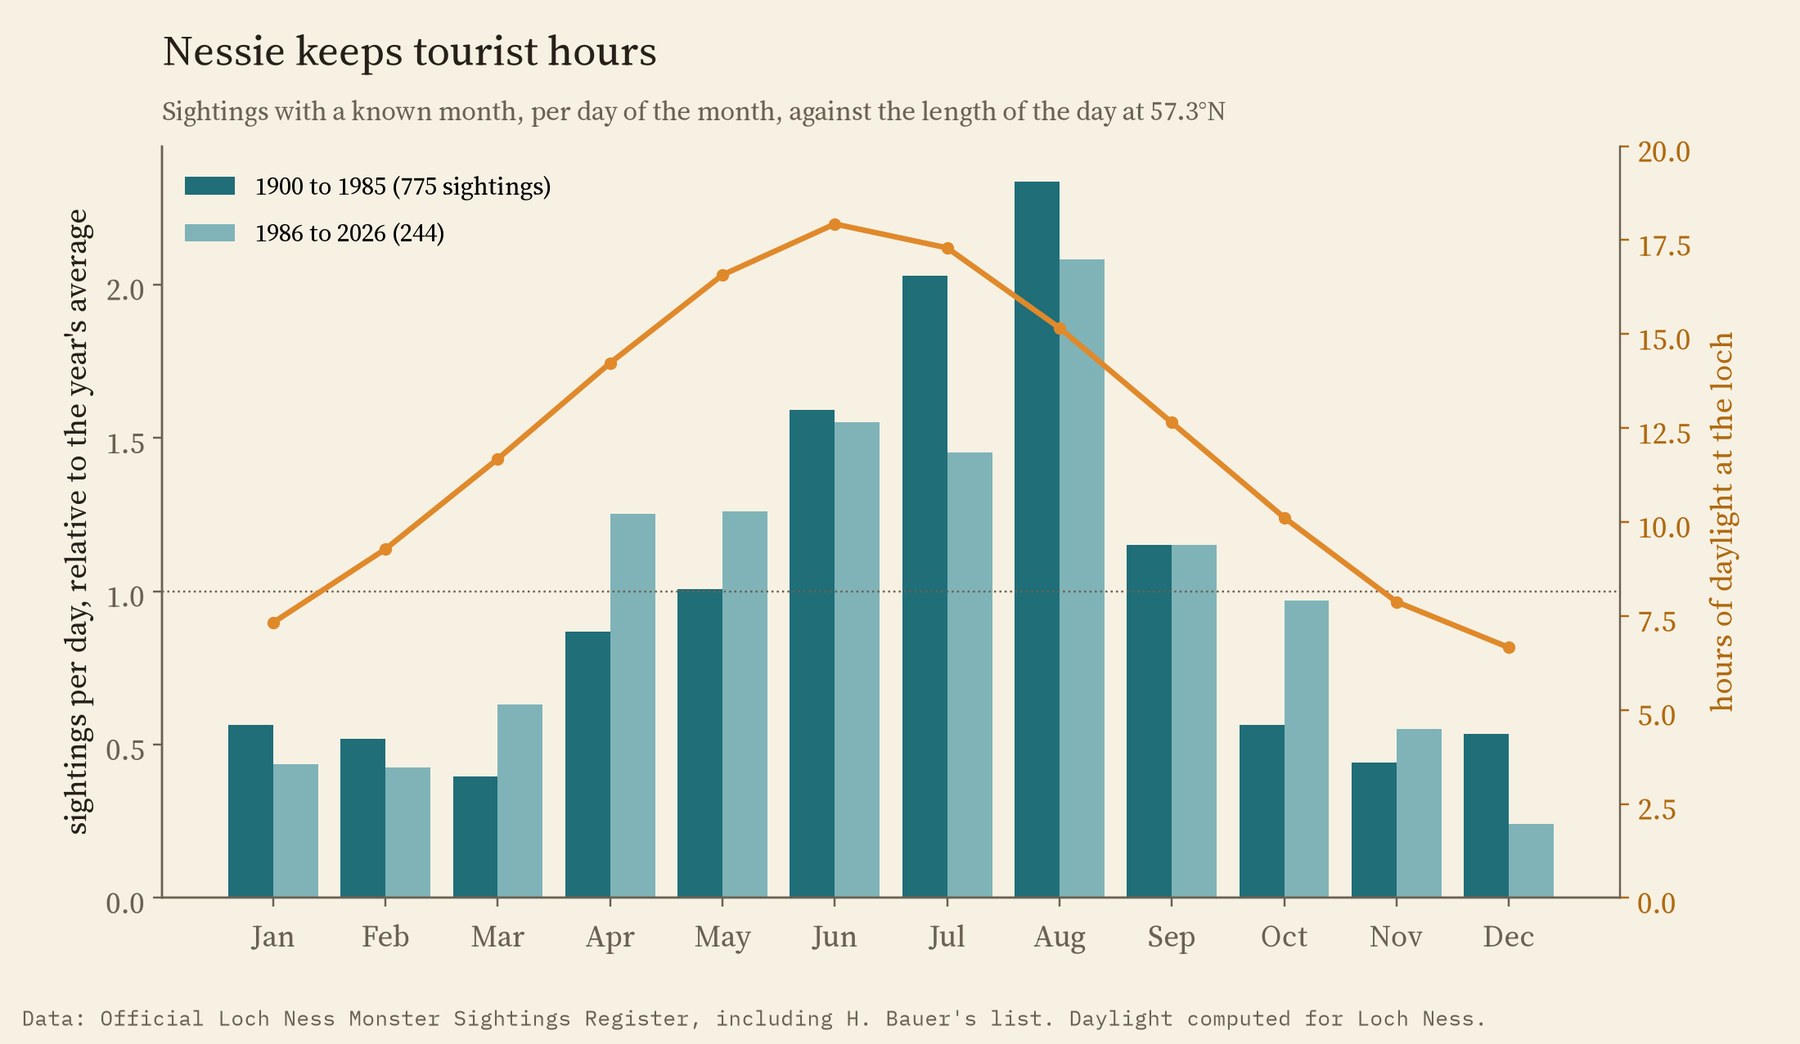
Nessie also keeps tourist hours. Per day, August has 4 times as many sightings as January, and June to August hold 48% of all sightings with a known month. Through the year, sightings track the length of the day closely (a rank correlation of 0.80), in Bauer’s old list and in the register since 1986 alike. And where the register names a place, 46% of recent sightings are at Urquhart Castle or in Urquhart Bay, which is where the visitors stand.
Big cats: lost in the filing
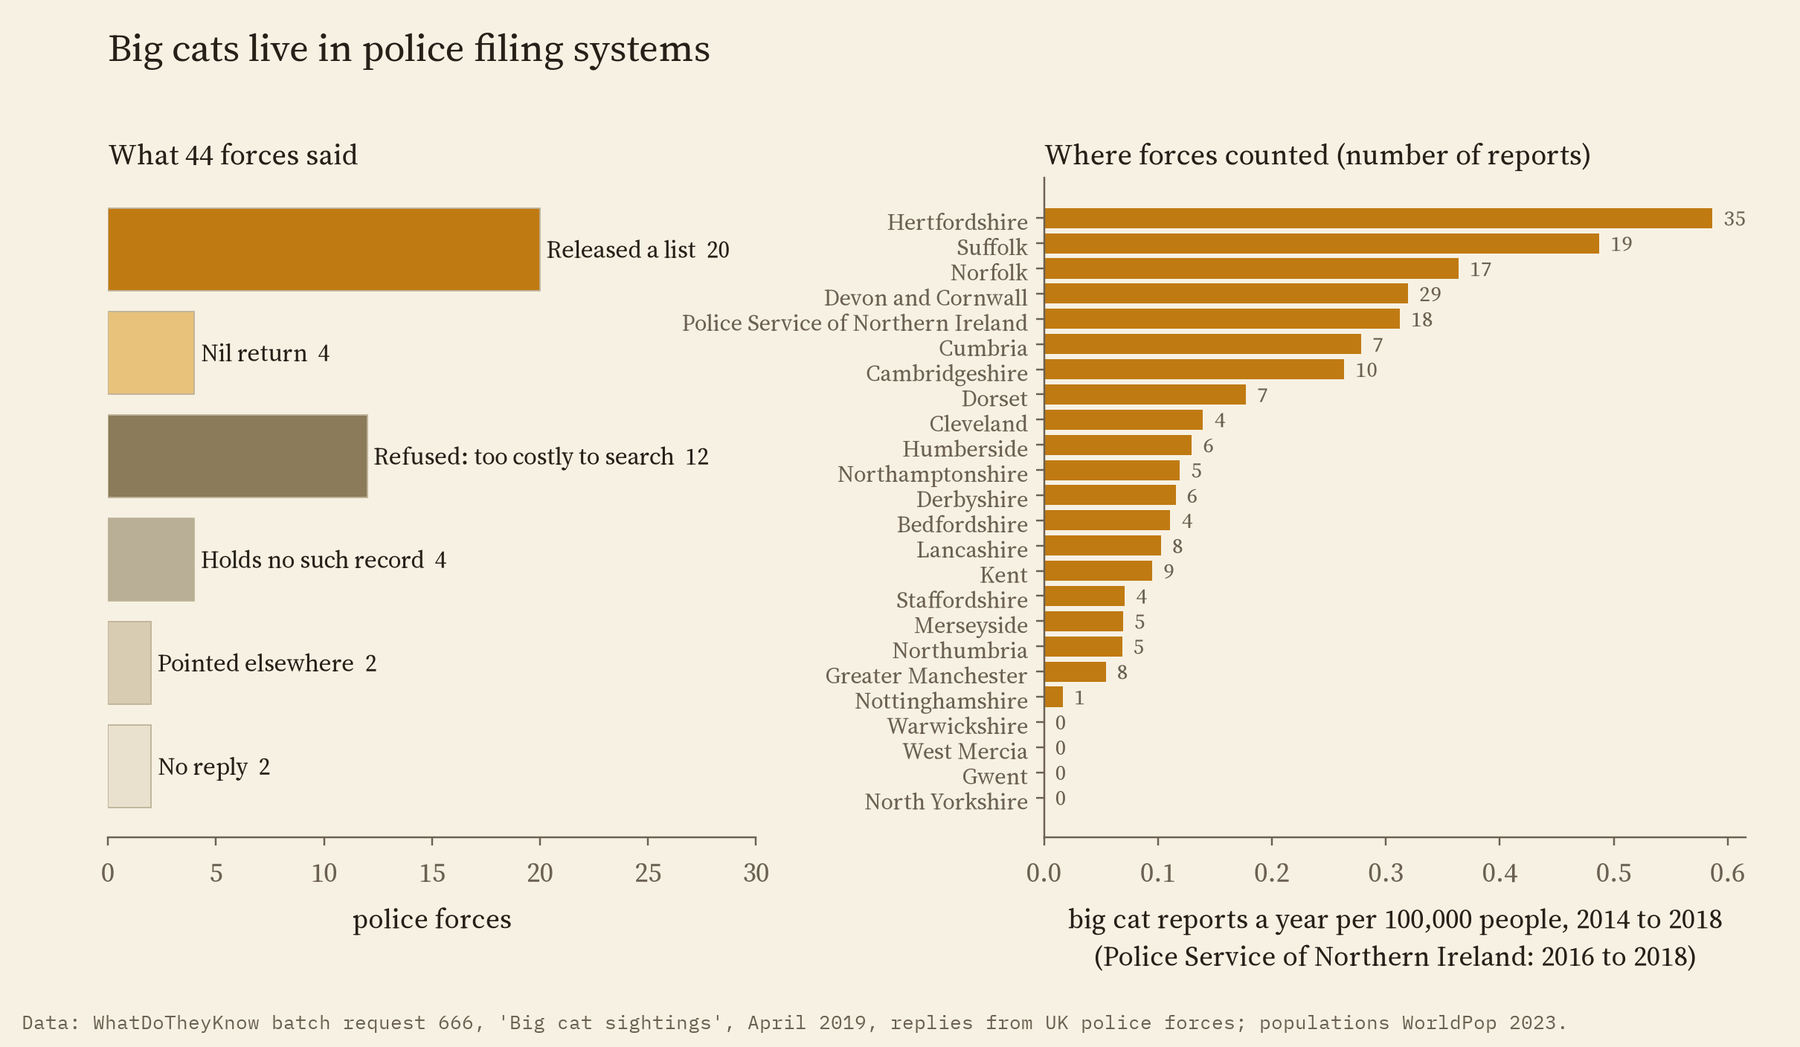
In 2019 someone used the Freedom of Information site WhatDoTheyKnow to ask every UK police force for a list of its “big cat” sightings since 2014. The replies are public, and they are a small study of their own. 20 of 44 forces sent a list and four sent a nil return. 12 refused because searching would cost too much, and 4 said they keep no such record. Surrey said a word search found more than 2,000 incidents, North Wales 1,160 and South Wales 596. Dyfed-Powys said it would have to read 65,295 calls about animals and suspicious behaviour. Forces explained that such searches also catch Puma trainers, Ford Pumas and leopard print.
The forces that did count found 215 reports between them, from none at all in four forces to 37 in Hertfordshire. I had planned to test whether rural forces get more reports per head. Counting every force that gave a number, there is no clear pattern. Leave out the four forces that found nothing, and the more crowded forces have fewer reports per head, but with only 20 forces that is a weak pattern at best. So it depends on whether “nothing found” means nothing reported or a search that missed them, and every force searched in its own way. The thing these records show best is how the police file them.
What it adds up to
Three very different mysteries, one shape. Reports turn up where people are, when they are looking, after they have been told what to look for, and where someone writes them down. That does not tell you what anyone saw on any given night. It does mean that “there are more sightings here” and “there were lots of sightings then” are exactly what you would expect if nothing unusual were there at all.
How I did this
UFO reports are the National UFO Reporting Center’s, as cleaned and geocoded by the planetsig/ufo-reports project, using only dates, shapes and places, never the witnesses’ words. Population and sky darkness come from my Darkest skies study, sunshine from the Met Office’s HadUK-Grid via Sun and rain, and airfields from OurAirports. The model is a negative binomial count model, run 12 other ways as checks. The Loch Ness sightings are from the register’s pages and the scanned Bauer list; the big cat counts are from the WhatDoTheyKnow replies and their attachments. No witness names or descriptions are reproduced anywhere. The paper has the full plan, every model and every check.
Notes and sources
- UFO reports: National UFO Reporting Center (nuforc.org), scrubbed and geocoded by planetsig/ufo-reports on GitHub. Dates, shapes and town-level places only.
- Loch Ness: the Official Loch Ness Monster Sightings Register (lochnesssightings.com), including the list from H. H. Bauer, The Enigma of Loch Ness (University of Illinois Press, 1986). Counts only.
- Big cats: WhatDoTheyKnow batch request 666, “Big cat sightings”, replies from UK police forces, 2019. Counts only.
- Population: WorldPop 2023; sunshine: Met Office HadUK-Grid (Open Government Licence v3); airfields: OurAirports (public domain); boundaries: Office for National Statistics (Open Government Licence v3). Base map: OpenFreeMap, OpenStreetMap contributors (ODbL).
- Further reading: D. Clarke, How UFOs Conquered the World (2015); R. Binns, The Loch Ness Mystery Solved (1983); D. Loxton and D. Prothero, Abominable Science! (2013); R. Medina and colleagues, “An environmental analysis of public UAP sightings and sky view potential”, Scientific Reports (2023).
- I wrote the text, with drafting and editing assistance from Claude (Anthropic), which also helped prepare the analysis code. I reviewed and checked all text and results.

