
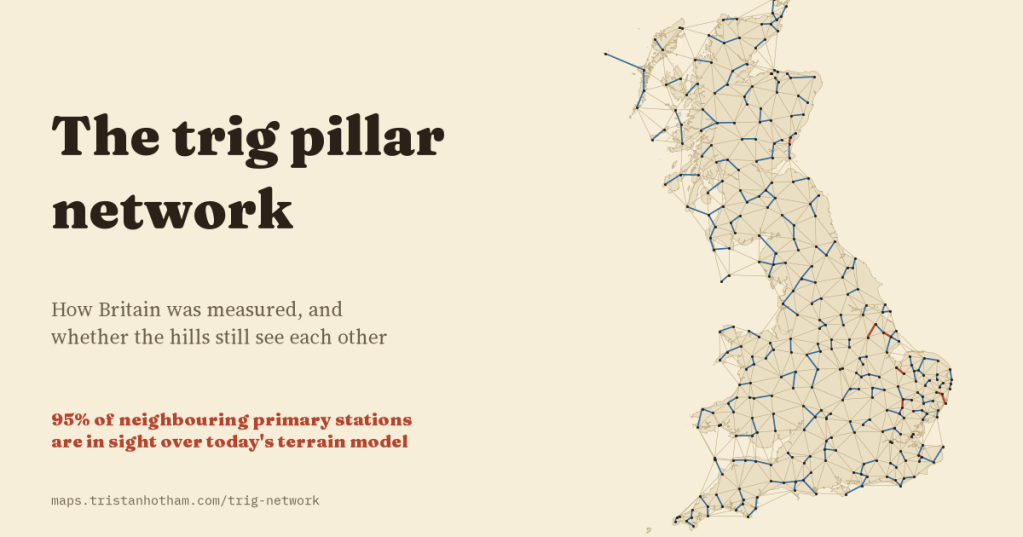
Britain’s hilltops are dotted with squat concrete pillars, each with a brass fitting on top. They were built to measure the country, and the rule was simple: every pillar must be able to see its neighbours. I mapped all 6,573 of them, and checked that rule against a modern terrain model. Using the stations’ surveyed heights, it still holds for 95% of the neighbouring primary stations.
If you have walked up a hill in Britain, you have probably touched one. A trig pillar is about four feet (1.2 m) tall, usually concrete, with a brass mounting on top where a surveyor once screwed a theodolite. Walkers lean on them, eat sandwiches by them and tick them off. They were built for the Retriangulation of Great Britain, the Ordnance Survey’s project to measure the country again from scratch, whose first pillar went up in 1936 and which gave us the National Grid.
The OS still publishes the list of its old triangulation stations. It has 31,521 rows. Some stations have several rows (a pillar, a bolt under it, a mark fixed again later), so I grouped them into 24,433 stations, of which 6,573 are pillars. The rest are bolts and blocks in the ground and “intersected” points: church spires, chimneys, flagstaffs and lighthouses that surveyors sighted on but never stood on.
A net inside a net
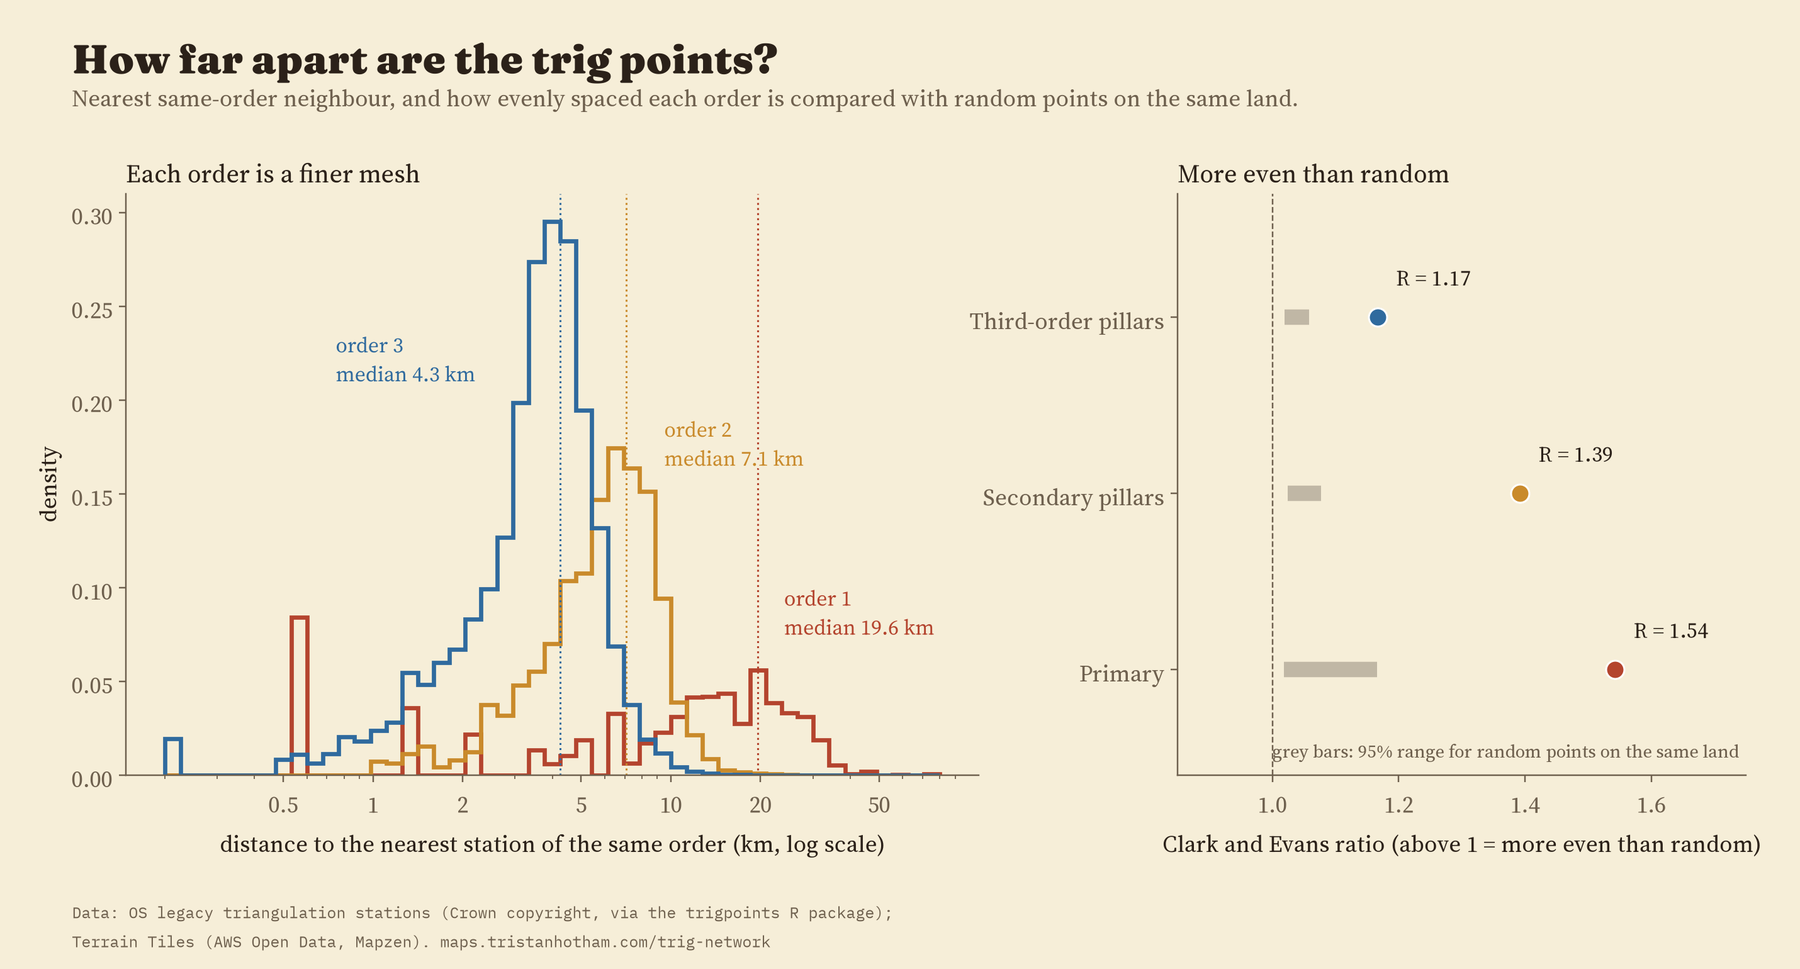
The network was built in orders, like a fishing net with a finer net tied inside it. 347 primary stations carry the big triangles. The middle distance from a primary station to its nearest primary neighbour is 19.6 km. Secondary pillars fill those triangles at 7.1 km, third-order pillars at 4.3 km, and fourth-order marks fill in the towns.
It is also strikingly even. A standard measure of spacing gives 1 for points scattered at random and more for evenly spaced ones: the primary stations score 1.54, while random points on the same land score between 1.02 and 1.17. Join neighbouring primaries into triangles and 71% have no angle smaller than 30 degrees, the sort of fat, well-behaved triangle a surveyor wants, against 48% for random points.
Built in a generation
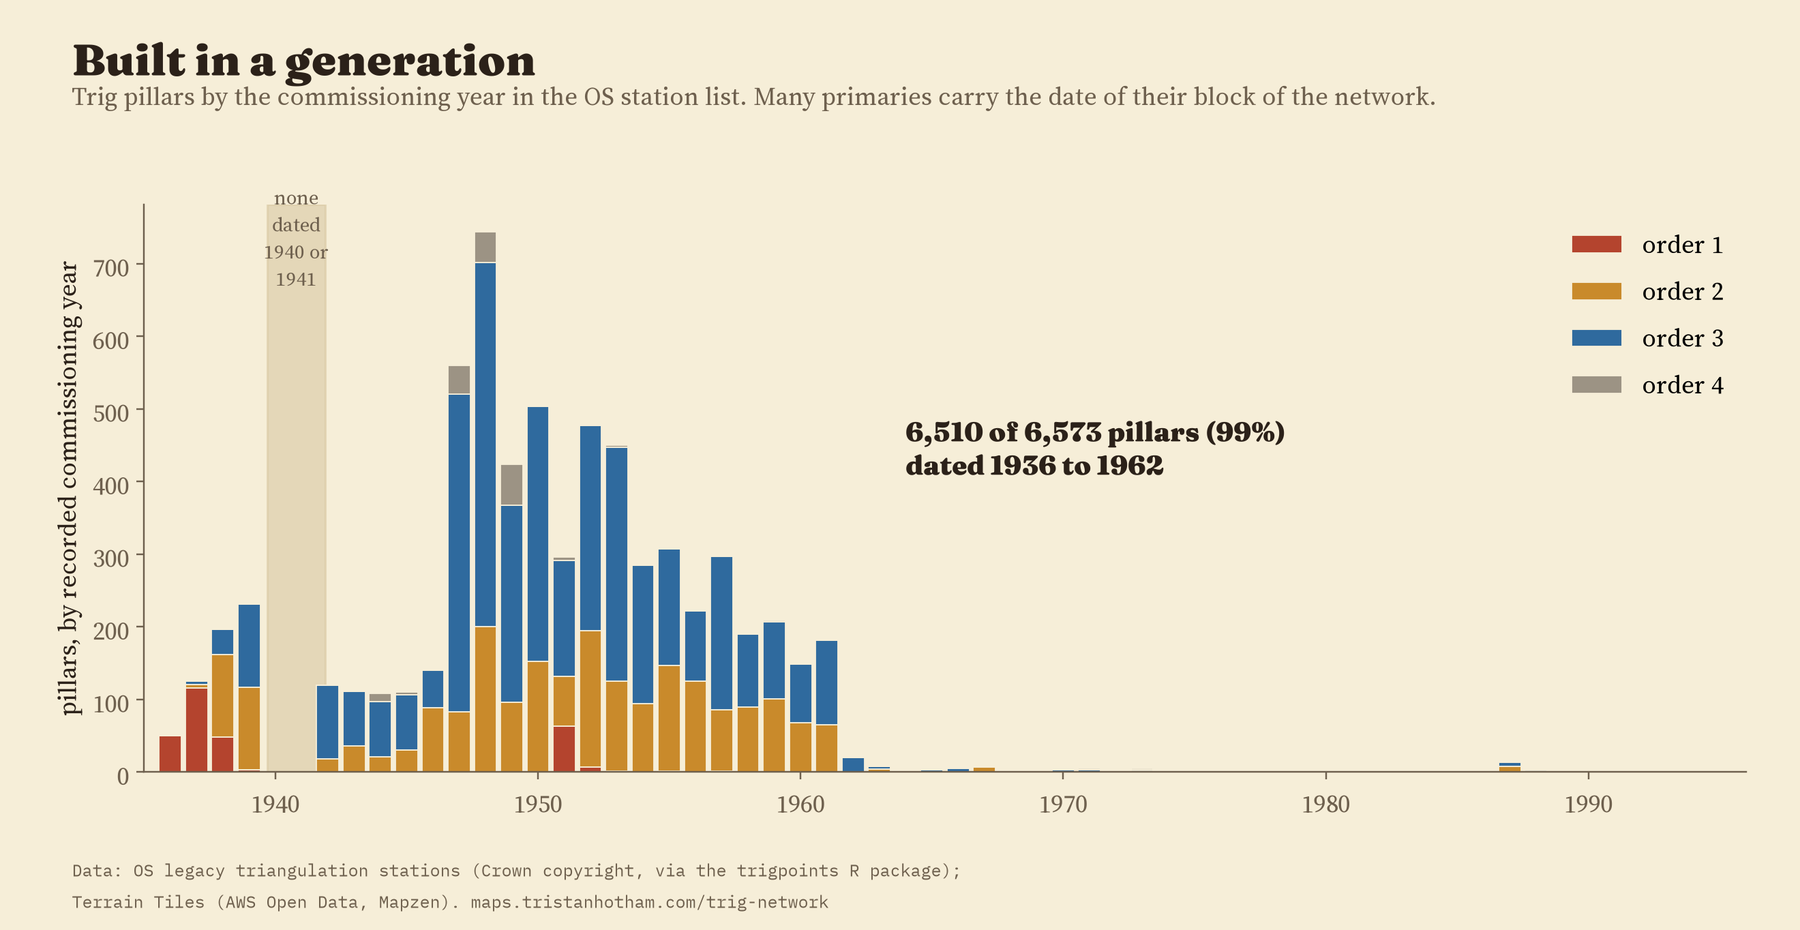
Nearly all of it went up in one burst. Of the 6,573 pillars, 6,510 (99%) have a commissioning date between 1936 and 1962. There is a little pre-war build, mostly primary stations, then a gap: nothing in the list is dated 1940 or 1941. After the war the work resumed, and the busiest year in the list is 1948, with 744 pillars. Many primary stations carry the date of their whole block of the network, so treat single years loosely.
Can the hills still see each other?
Here is the part I most wanted to test. Triangulation only works if each station can see its neighbours: the surveyor sights the theodolite on a lamp or signal on the next hill. So if the station list is right, and a modern terrain model is good enough, neighbouring stations should be in sight of each other over that model.
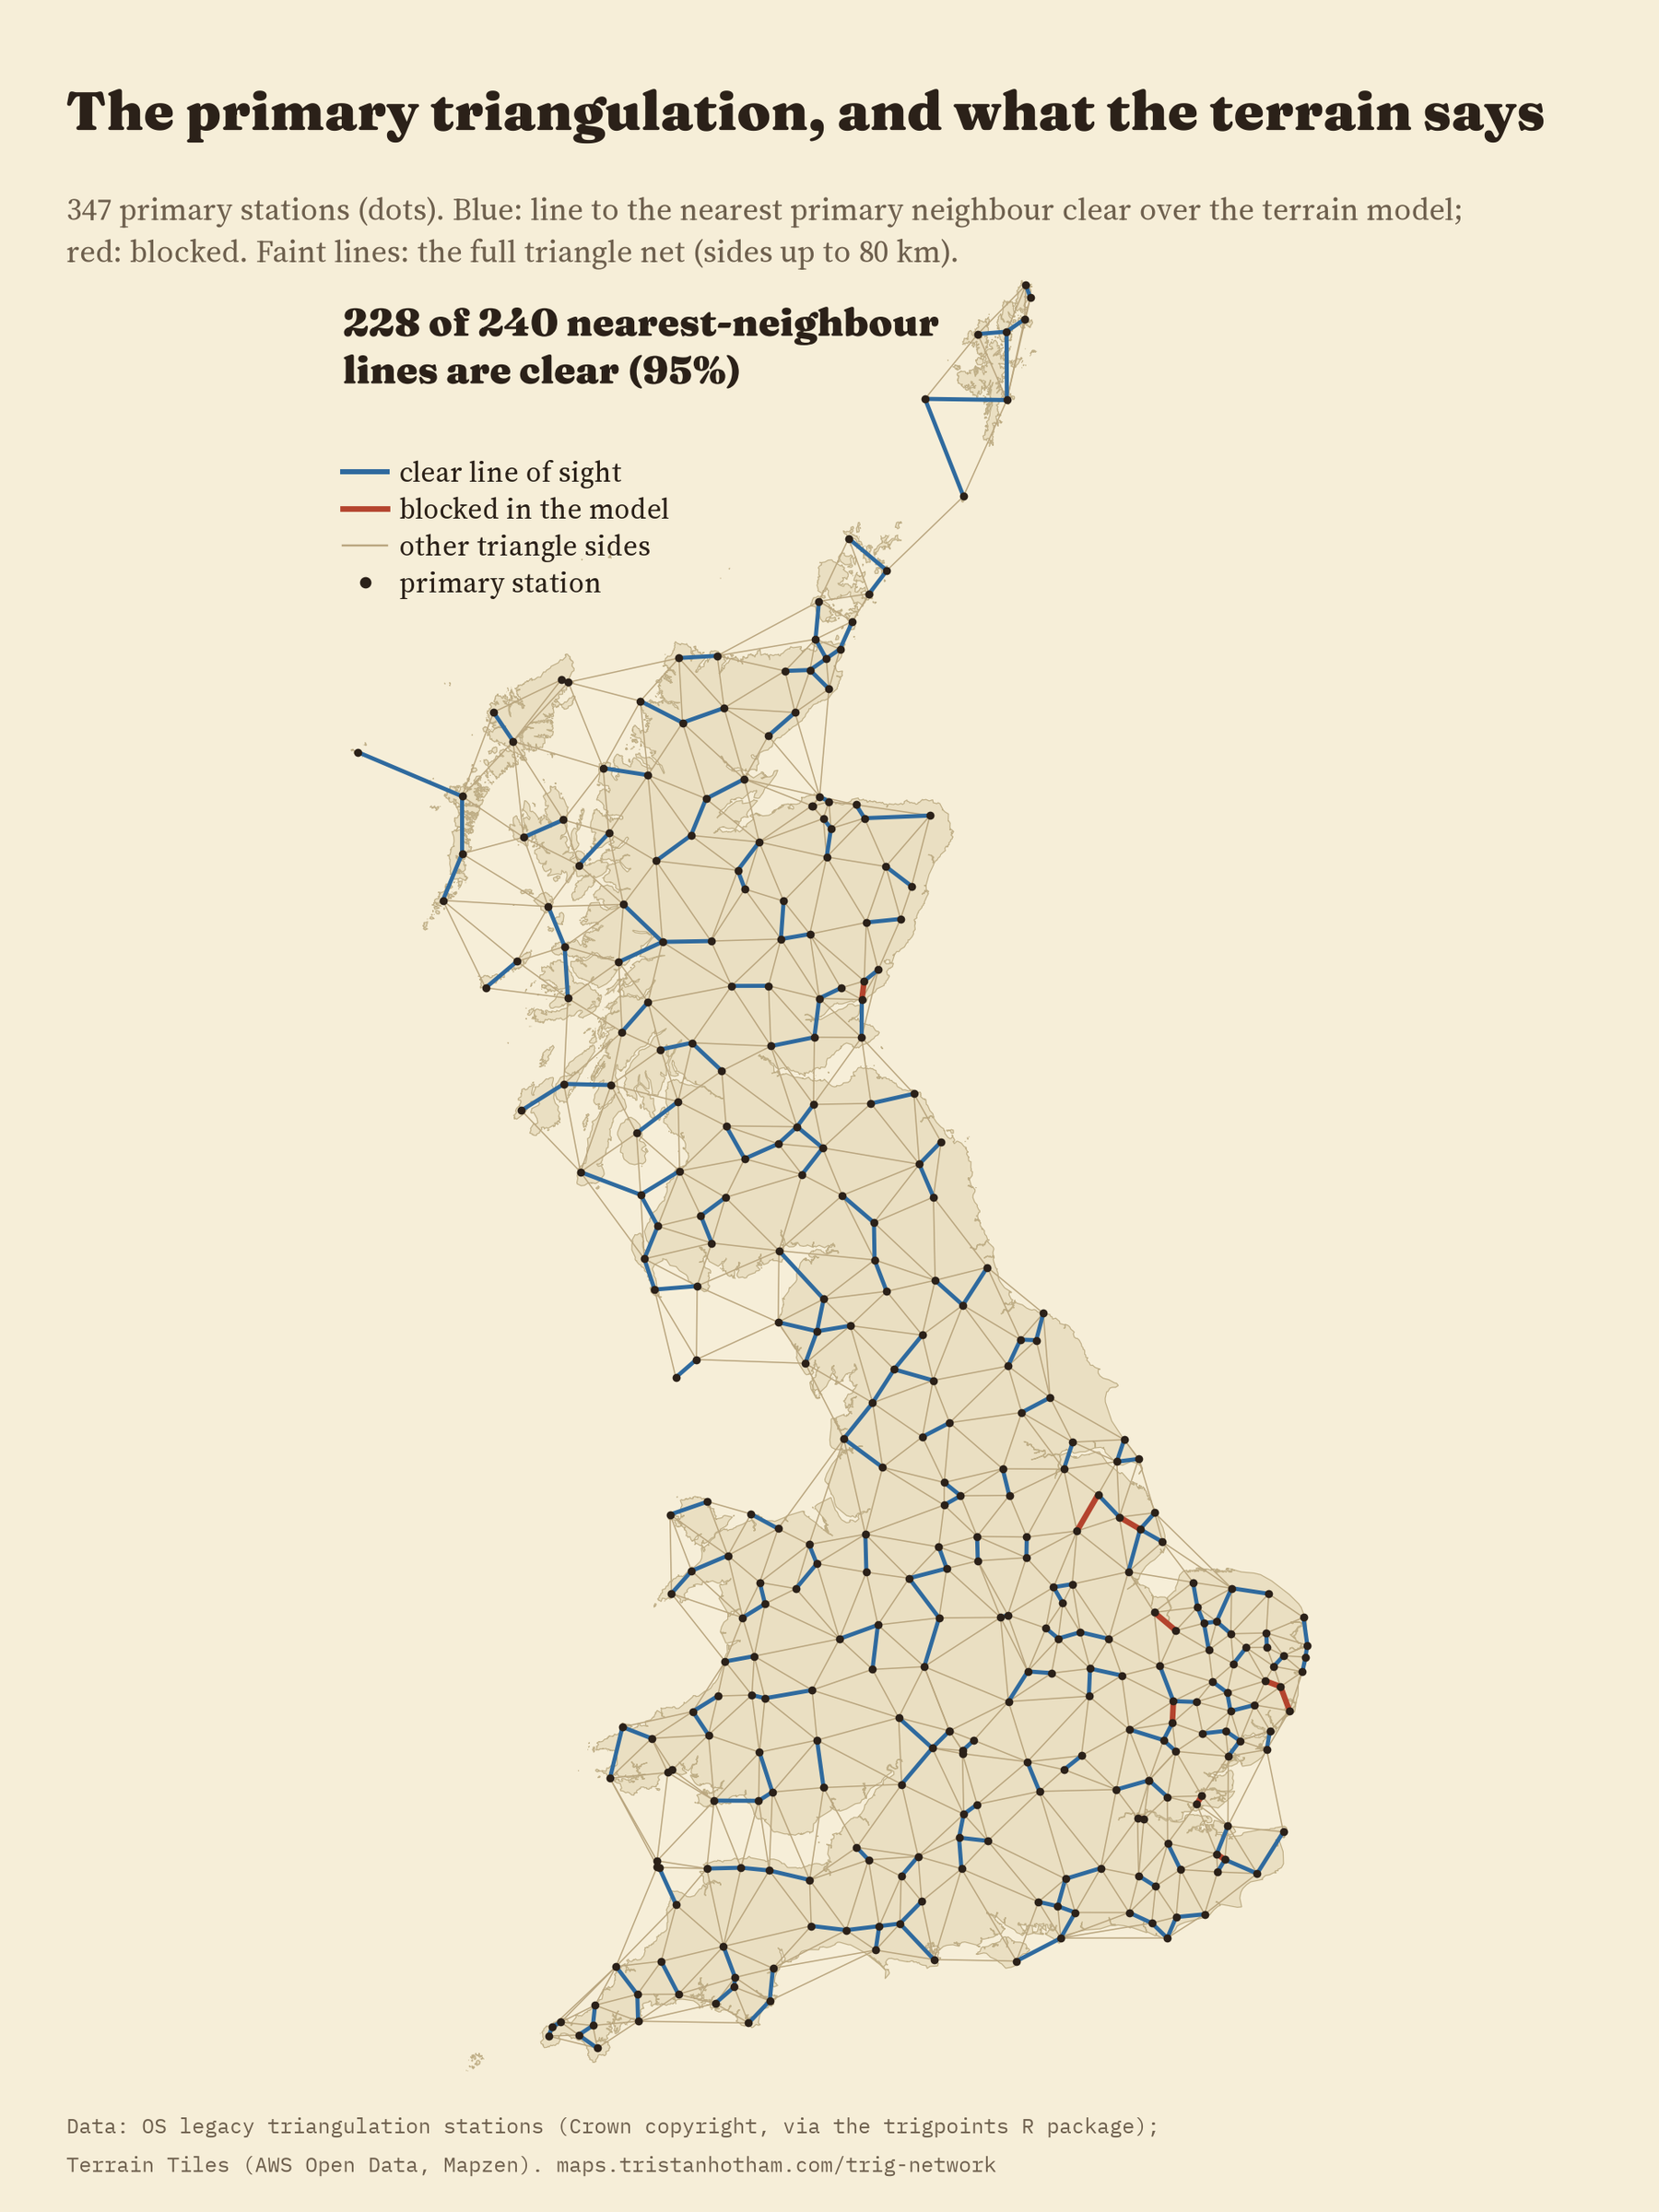
I drew a line from each primary station to its nearest primary neighbour and checked it over Terrain Tiles, an open elevation model, allowing for the curve of the Earth and for the slight bending of light in the air. I put each end 1.5 m above the surveyed height of the station, roughly where the instrument sat. I wrote down the test, and what result would count against it, before running it.
Of 240 lines, 228 are clear: 95%. Secondary pillars do just as well (97%), and third-order pillars nearly as well (92%). Is that just because Britain is open country? No. Move both ends of each line 1 km in a random direction and only 17% are clear. Pick random pairs of points on land at the same distances and only 11% are.
Lines placed at random mostly fail. The real ones mostly pass.
The 12 lines that fail are the best bit. 8 of them involve a lighthouse, a cathedral, an observatory, a castle or a water tower whose height the list does not record, so my test puts the observer on the ground instead of up the tower. 3 are pillar to pillar, in flat Norfolk, Suffolk and Lincolnshire, blocked by a few metres. Every one of them touches a station where, according to the record, the surveyors put up a steel observing tower, often about 30 m tall, to see further. Add a 30 m tower, and all 3 clear. That leaves one I cannot explain: West Hills to Buddon near Dundee, where Buddon is a ground mark with no recorded height and the model puts a ridge in the way.
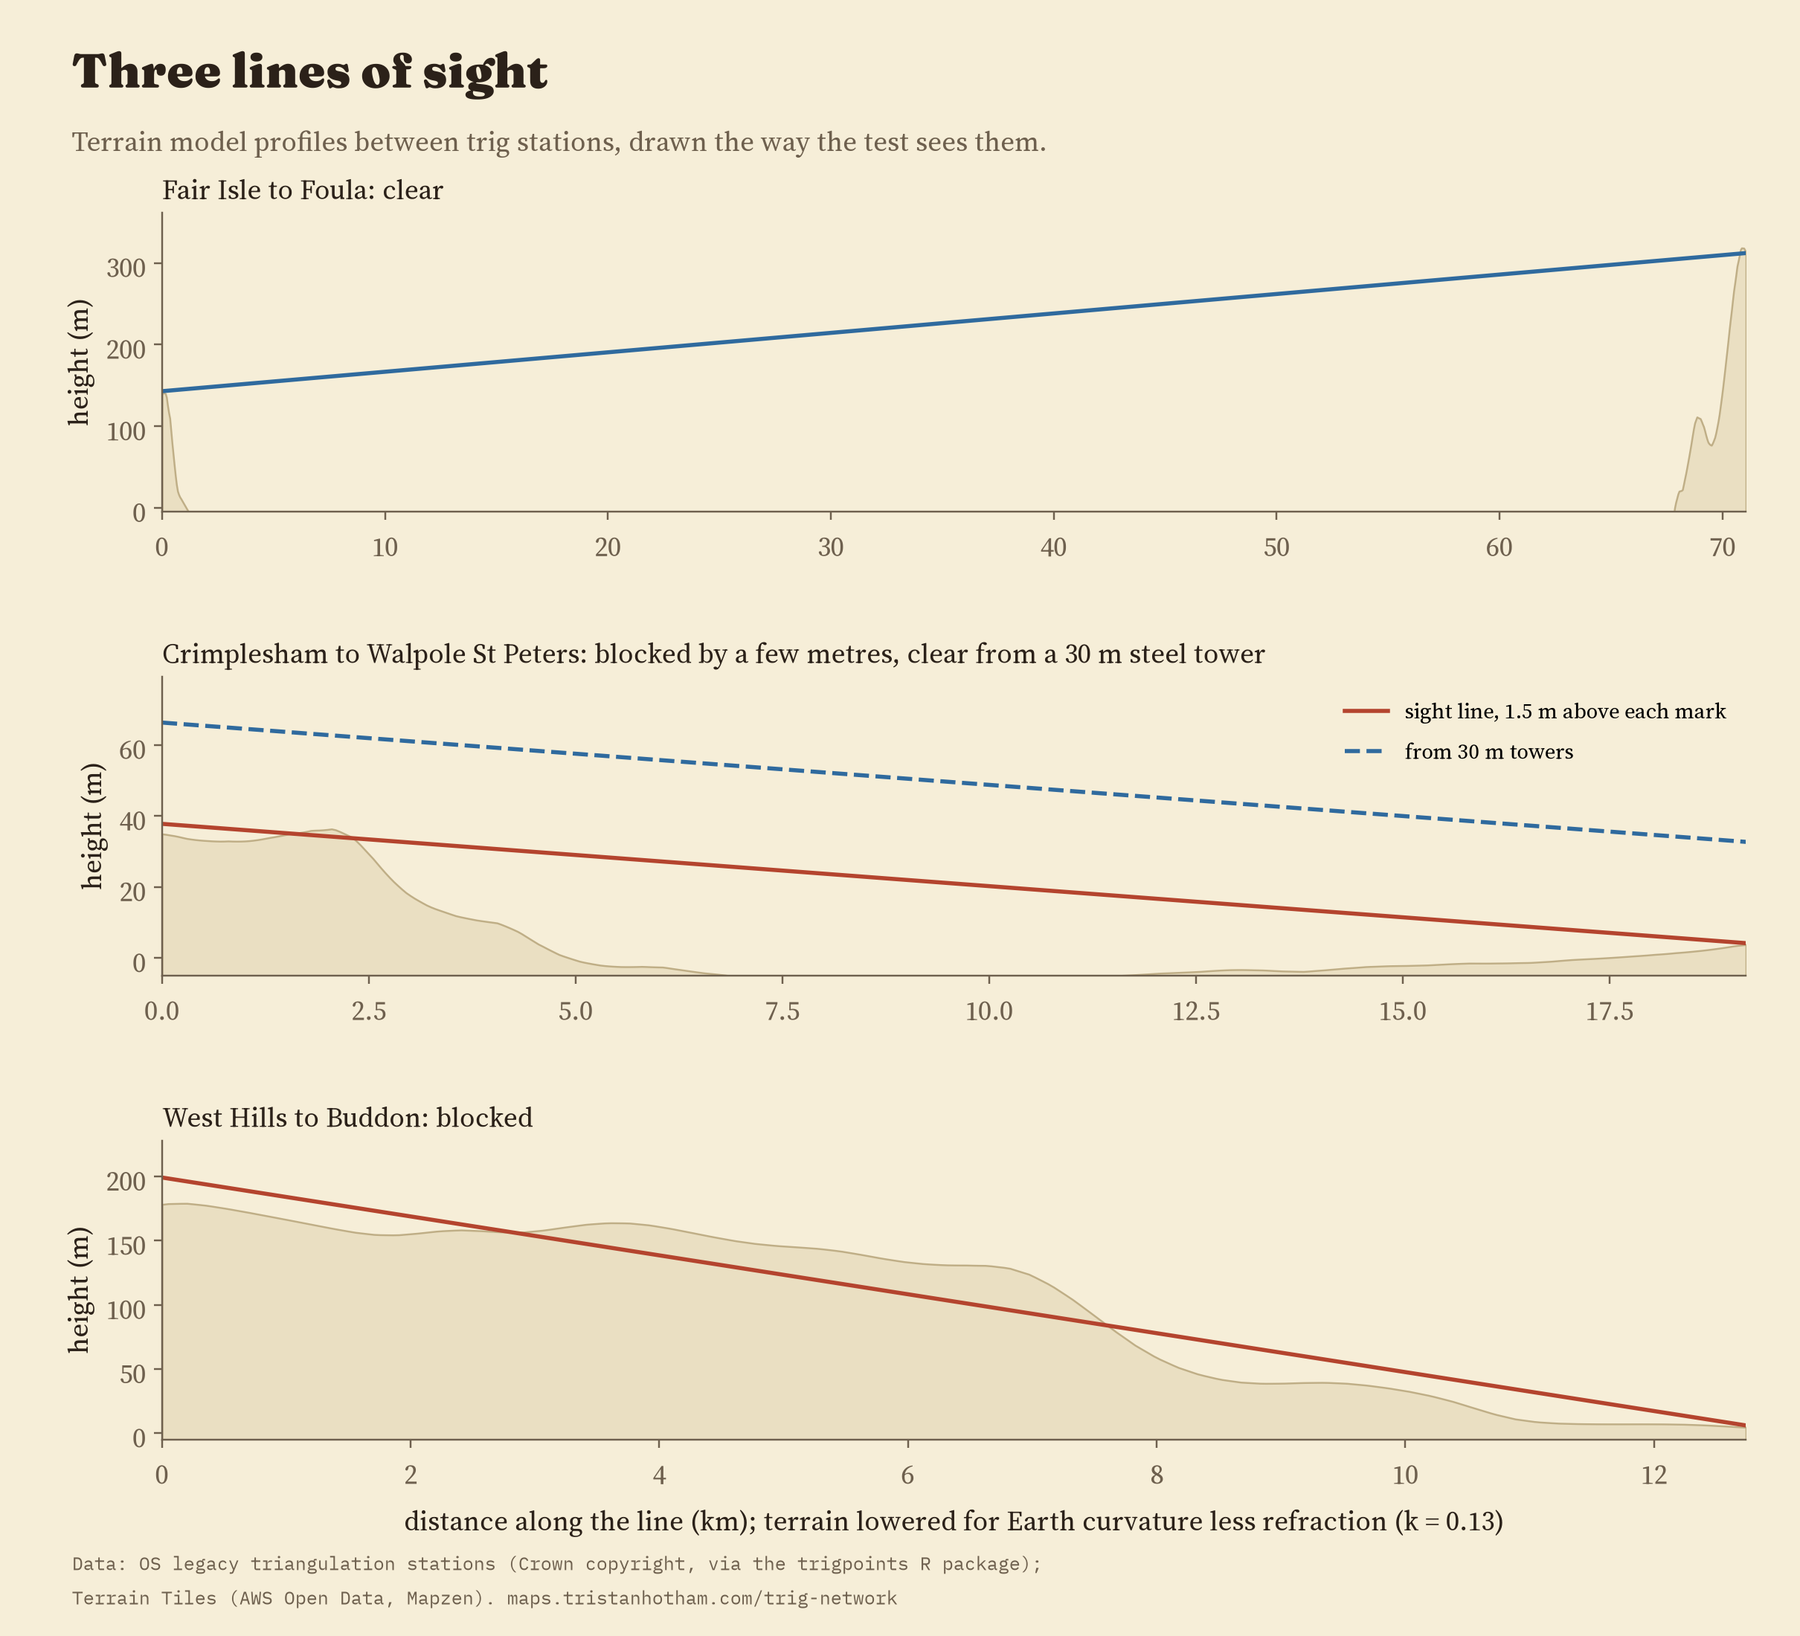
One honest warning. The terrain model at this scale rounds off hilltops: at the pillars it sits a median 22 m below the surveyed height, and on Ben Nevis 168 m below. If I use the model’s own heights at the ends instead of the surveyed ones, only 67% of the primary lines are clear. That is still far above the random lines, but it shows how much the old survey’s own heights matter: the 95% depends on them.
Pillars outlast spires and bolts
The list flags stations known to be destroyed. 415 of the 6,573 pillars are flagged (6.3%). Intersected stations fare much worse (26%) and ground marks worse still (36%): bolts in walls and blocks under fields disappear with new buildings, roads and ploughs. Even allowing for the kind of station, its order, region and age, stations below 100 m are more often lost than upland ones. Scotland’s pillars are the least often flagged, at 2.3%.
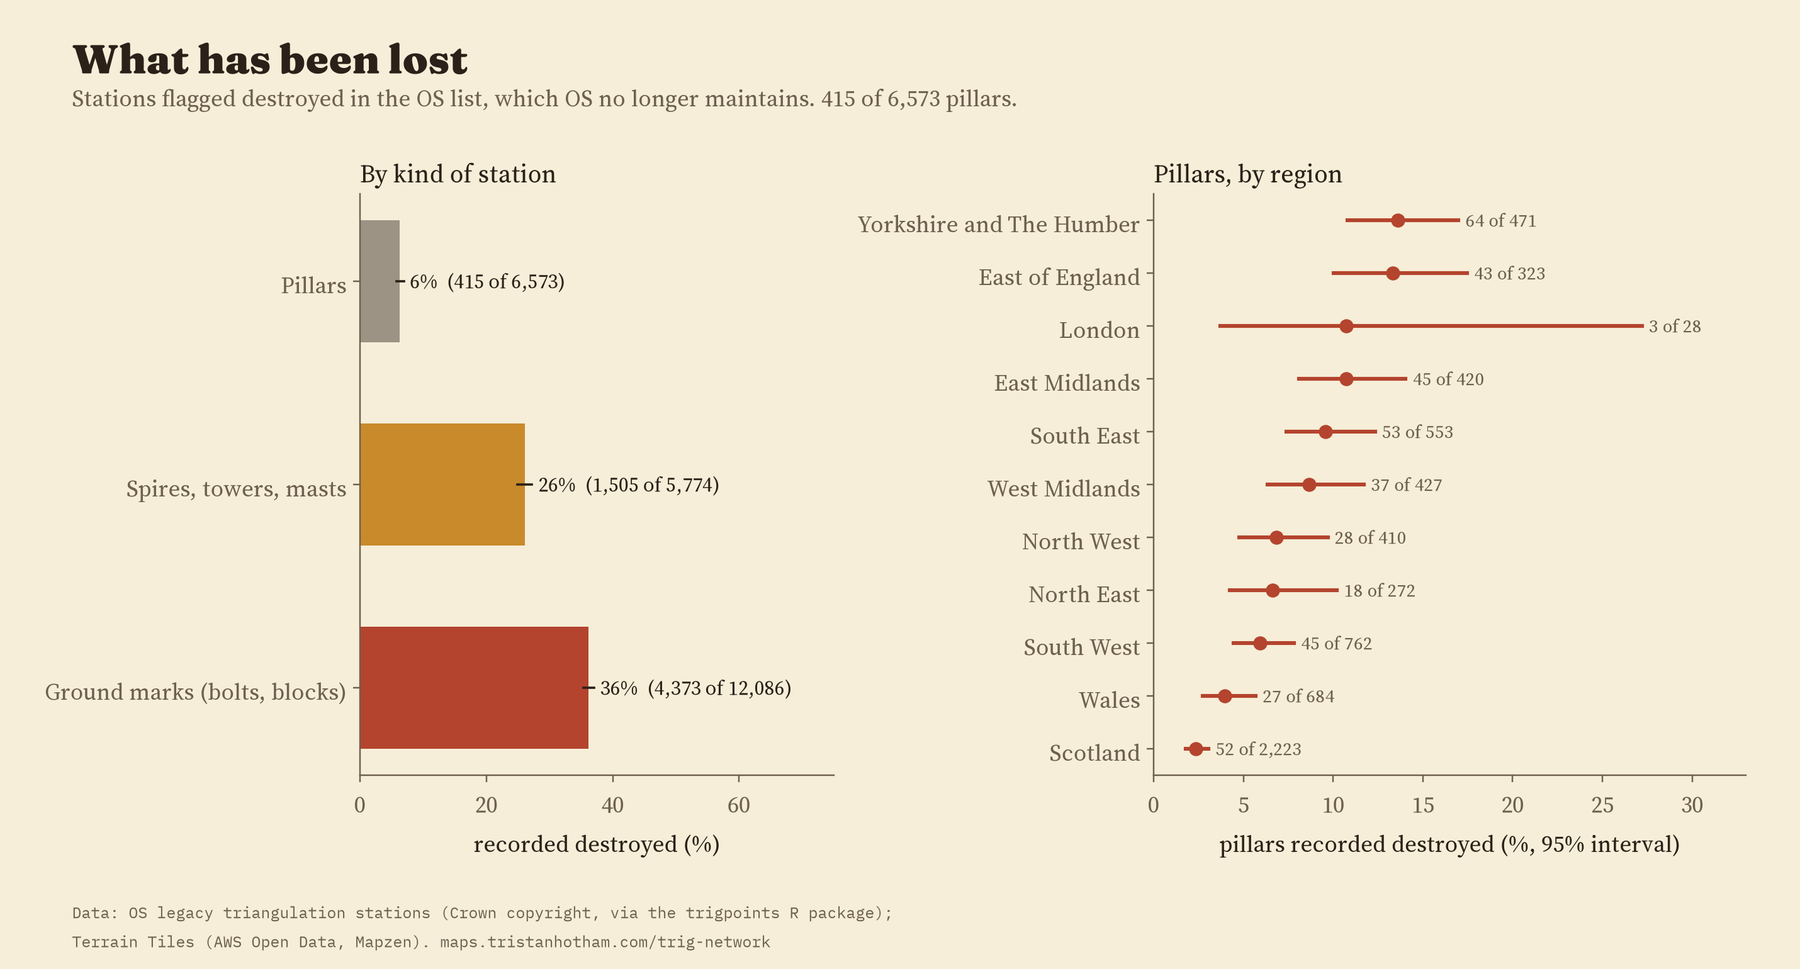
The OS no longer maintains this list, so “not destroyed” really means “not known to be destroyed”. The walkers of TrigpointingUK, who log visits, record more losses than the OS list does.
How I did this
The station list comes from the Ordnance Survey, packaged by Phil Mike Jones in the trigpoints R package. I grouped rows with the same station code within 100 m, and called a station a pillar if any of its rows is one. The terrain is Terrain Tiles at zoom 9, where each pixel is about 190 m across. For each line I sampled the terrain every 100 m, lowered it for the Earth’s curve less refraction, ignored the first and last 250 m, and called the line clear if nothing rose above it. I checked the result with no refraction and with more, with a finer profile, with two neighbours instead of one and leaving out each region in turn: it stays between 93% and 97%.
What this cannot say: the terrain model has no trees or buildings; the list does not record which lines were actually observed, so nearest neighbours stand in for them; and the destroyed flag is out of date. The St Kilda stations lie beyond the terrain tiles, so their one line is treated as open sea. The paper has the full method, every check and every failing line.
Notes and sources
- Ordnance Survey legacy triangulation station list. Contains OS data © Crown copyright and database right 2018, used under the Open Government Licence v3.0. Packaged in the trigpoints R package by Phil Mike Jones.
- Terrain Tiles on AWS Open Data (Mapzen): SRTM and GMTED2010 courtesy of the U.S. Geological Survey; EU-DEM produced using Copernicus data and information funded by the European Union; ETOPO1 from NOAA.
- Steel observing towers: TrigpointingUK wiki, “Bilby towers”, citing the Ordnance Survey’s History of the Retriangulation of Great Britain (1967) and T. Owen and E. Pilbeam, Ordnance Survey: Map Makers to Britain since 1791 (1992). OpenStreetMap survey points © OpenStreetMap contributors (ODbL). Region boundaries: ONS (OGL v3.0). Base map: OpenFreeMap.
- Further reading: W. A. Seymour (ed.), A History of the Ordnance Survey (1980); R. Hewitt, Map of a Nation (2010); M. Greaves, “OSTN02”, Survey Review (2004).
- I wrote the text, with drafting and editing assistance from Claude (Anthropic), which also helped prepare the analysis code. I reviewed and checked all text and results.

