
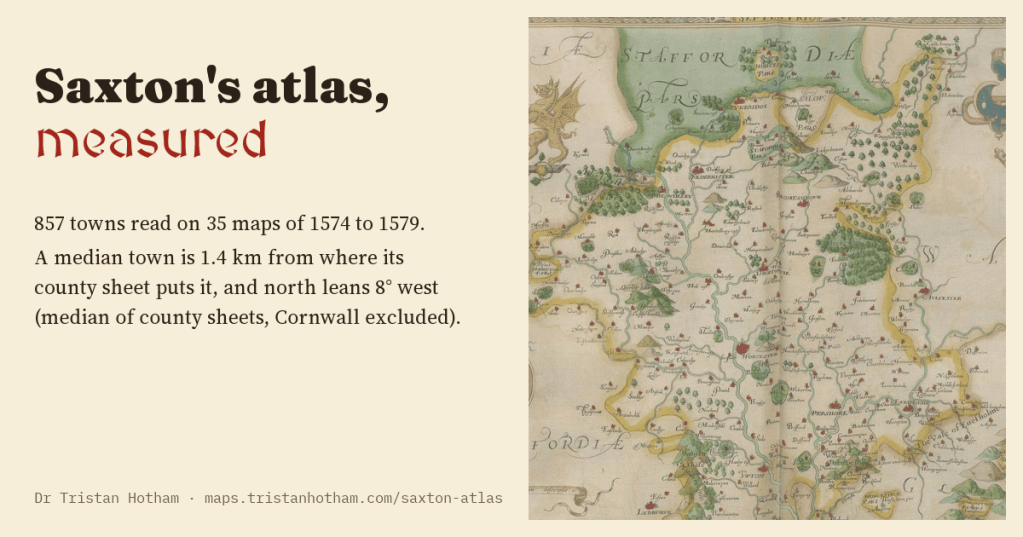
In the 1570s Christopher Saxton mapped every county of England and Wales. I read 857 towns on his maps and checked each against where it really is. A typical town is about 1.4 km out, and on almost every sheet north leans the same way, by about as much as a compass did in Elizabethan London.
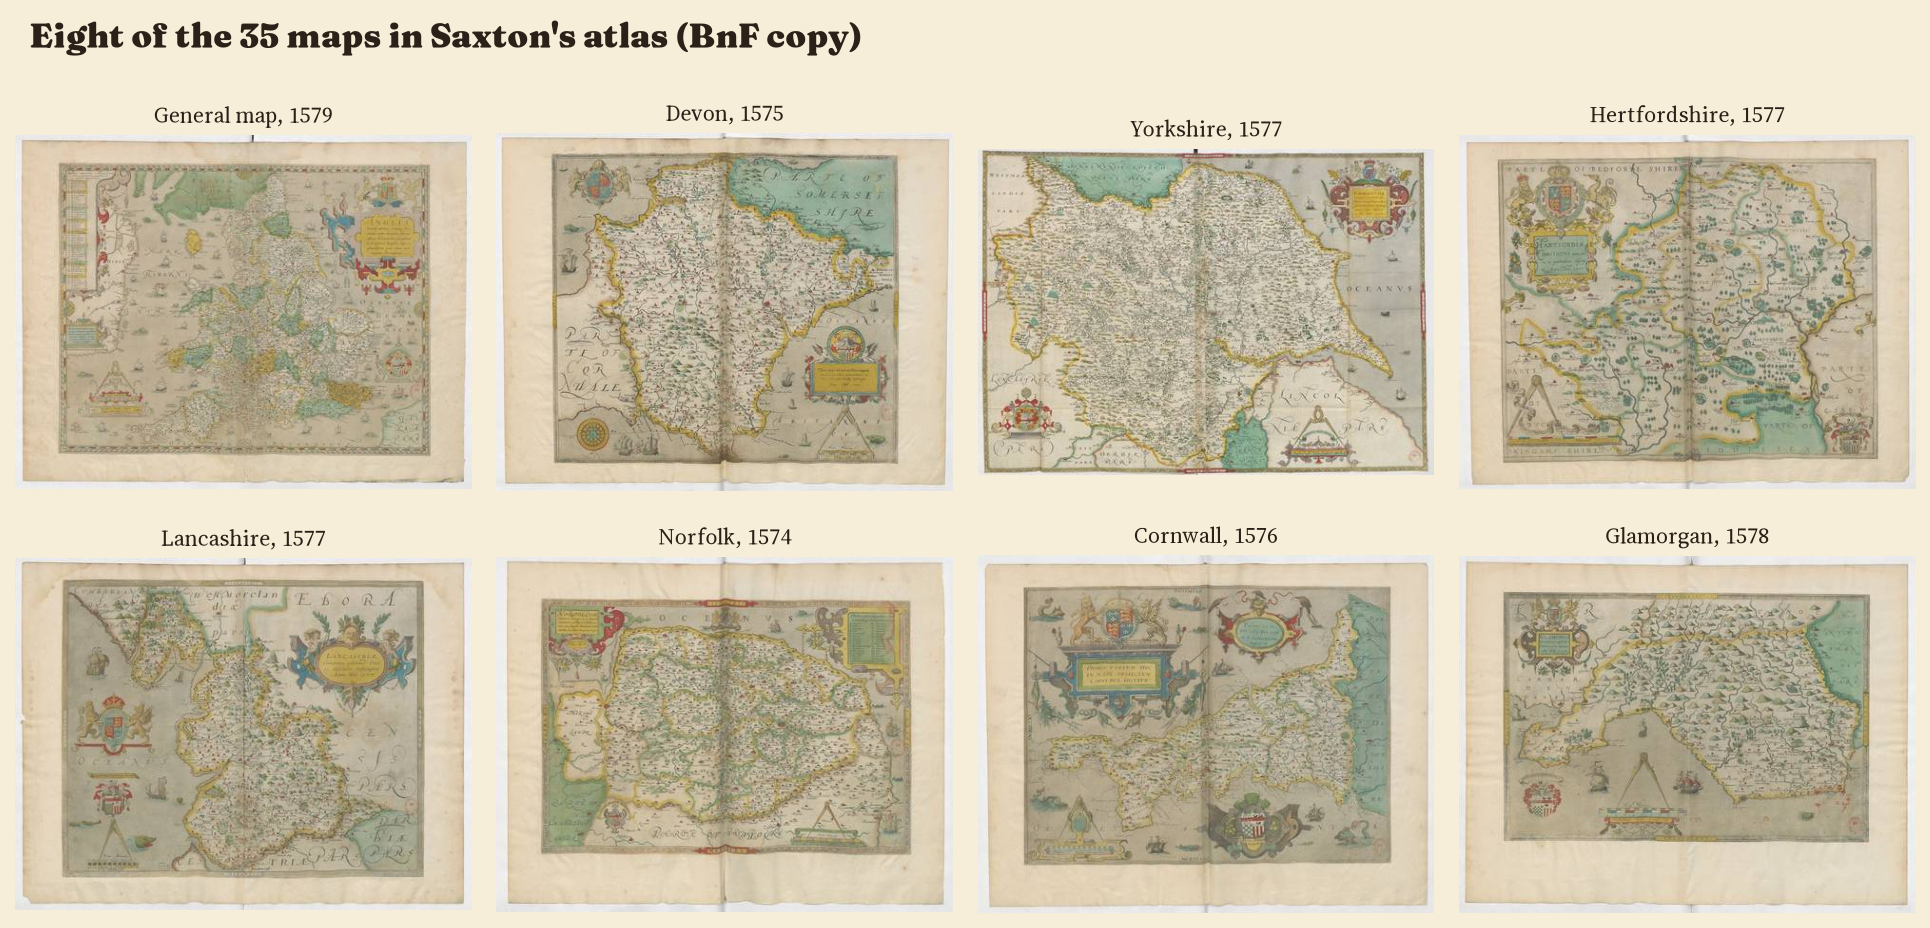
Saxton’s atlas is one of the great objects of English mapping. Between 1574 and 1579 he surveyed the counties, and his plates were engraved in London and bound in 1579 with a general map of England and Wales. Thirty five maps in all, each crowded with church towers, parks ringed by fences, hills like molehills and rivers like veins. For two hundred years most county maps in England were copies of his.
I wanted to know how good they are, in numbers. I have already measured the Gough Map, drawn about two centuries before Saxton, and the medieval portolan charts. Saxton is the obvious next step: the first maps of England made from a real survey.
Reading the maps
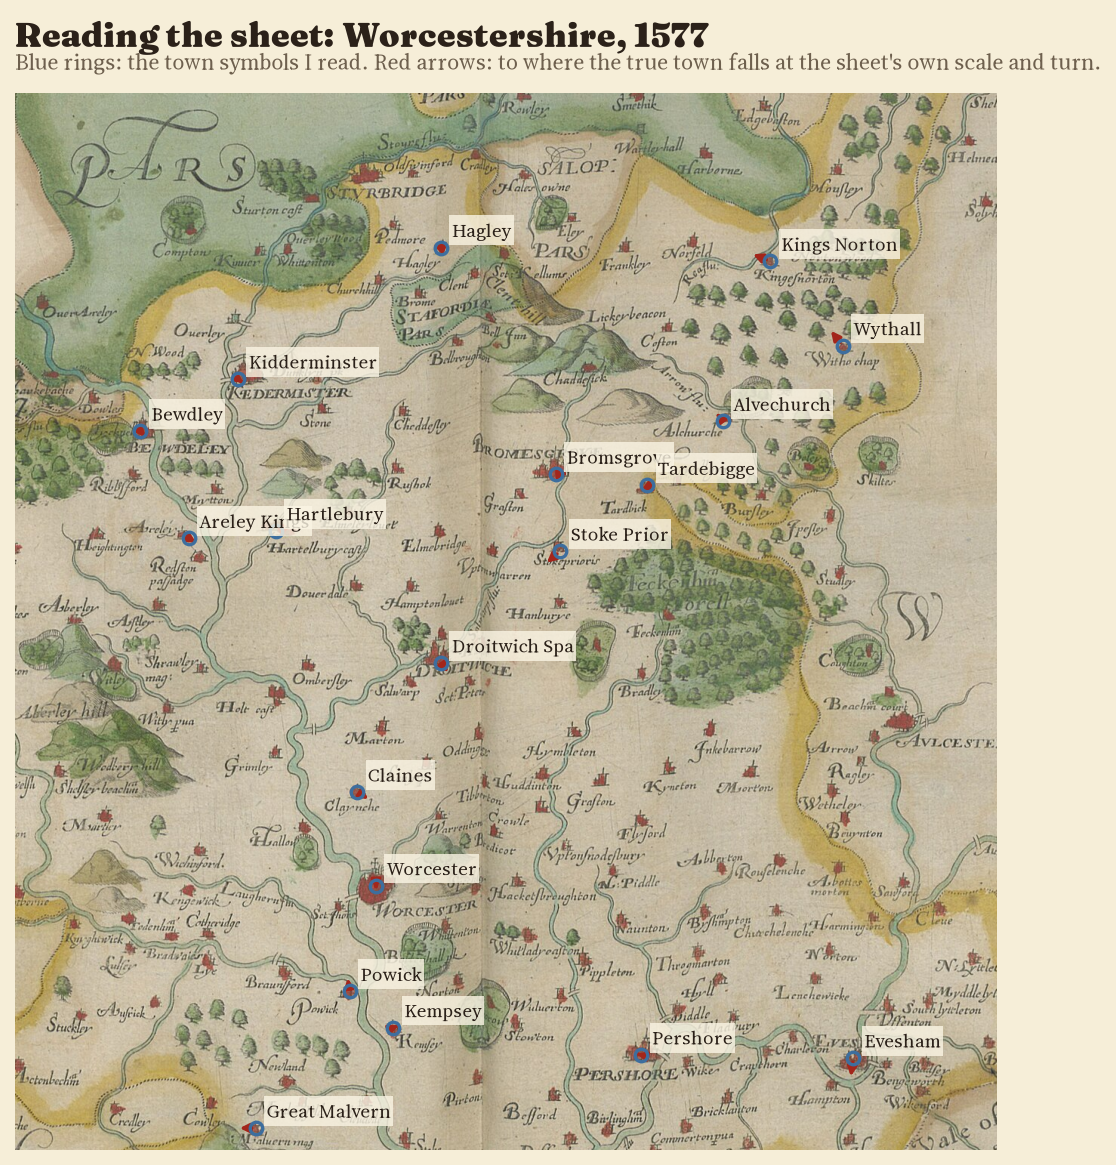
The Bibliothèque nationale de France copy of the atlas is on Wikimedia Commons as high resolution scans. I went through all 34 county maps and the general map, zooming into each town symbol, reading the engraved name (Hytchin, Hartforde, Kedermister) and matching it to the town’s position today. That gave 857 readings, from 7 on Pembrokeshire to 62 on Yorkshire. 77% of them are certain; the rest are probable, usually because the name is worn or tucked behind a hill.
A town within a mile or so
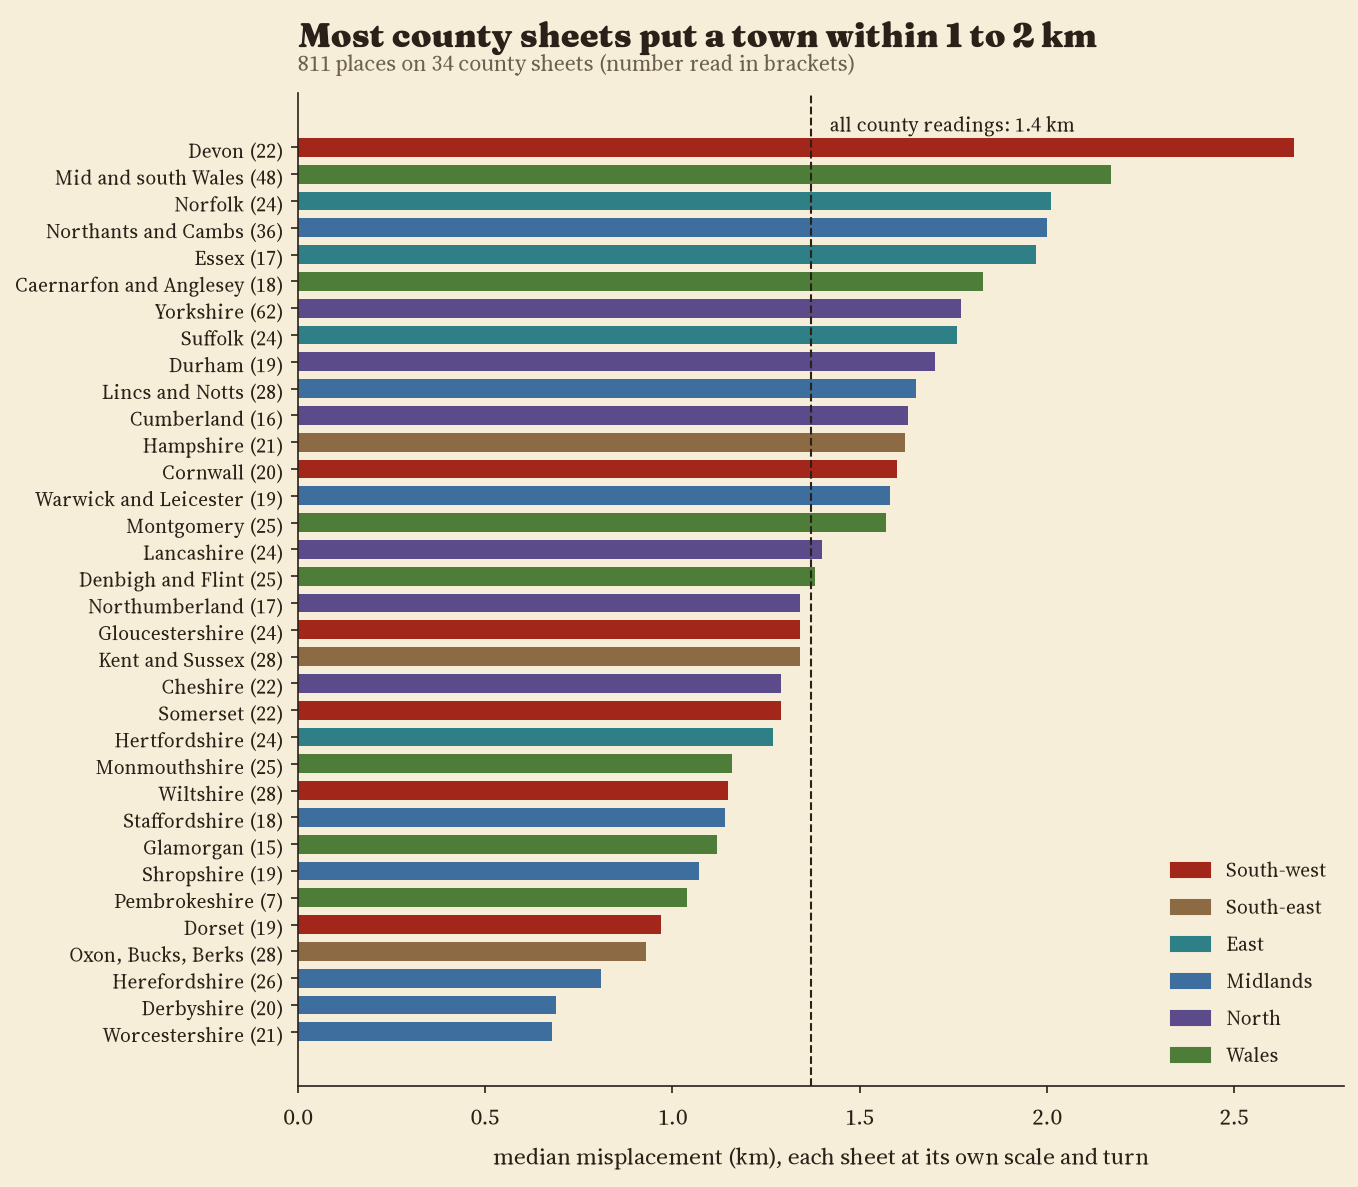
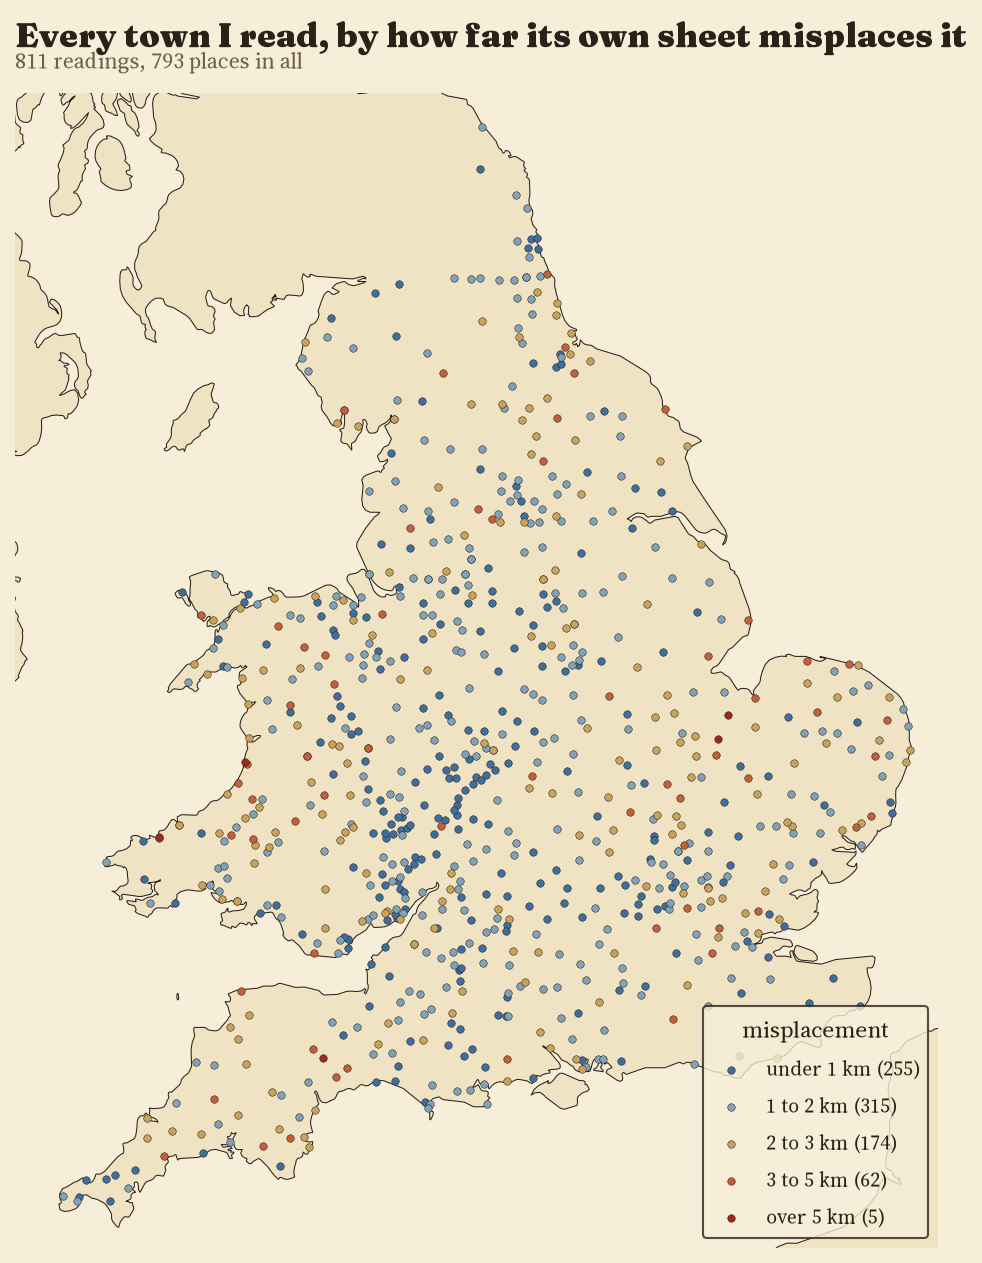
Each county is drawn at its own scale (Hertfordshire is 2.6 times larger than Yorkshire), so I fitted each sheet to the ground separately, with one scale, one turn and one shift. Then I asked how far each town is from where it should be. The median answer across 811 towns is 1.37 km. 32% of towns are within 1 km and all but 5 within 5 km.
The best sheet is Worcestershire, with a median of 0.68 km; the weakest is Devon at 2.66 km. Letting each sheet stretch and shear barely helps (the median drops to 1.28 km), because the shapes are true. And where the same town appears on two neighbouring sheets, the two sheets agree on where it is to within 2.3 km, as a rule.
North leans west
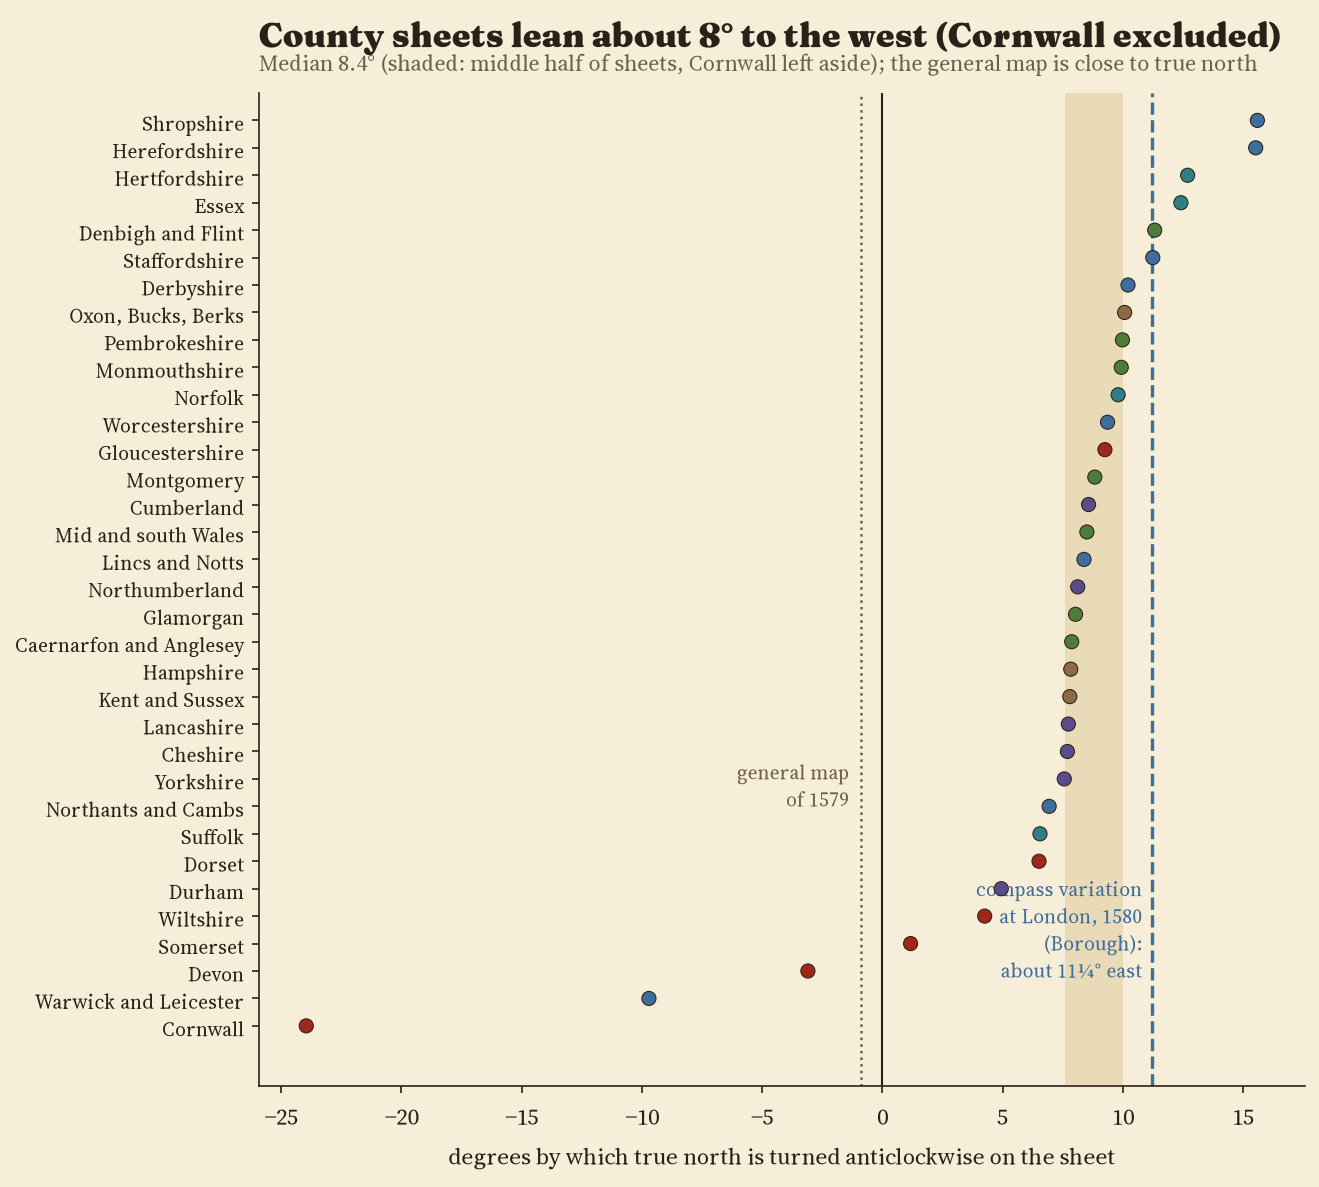
The fits also say which way each sheet is turned. I expected a jumble. Instead, on 31 of 34 county sheets true north is turned anticlockwise: the top of the paper points a little east of true north. Leaving Cornwall aside, the median lean is 8.4°, and the middle half of sheets sit between 7.6° and 10.0°.
On 31 of 34 county sheets, north leans west by a median of 8.4° (Cornwall excluded): about what a compass needle did in London in 1580.
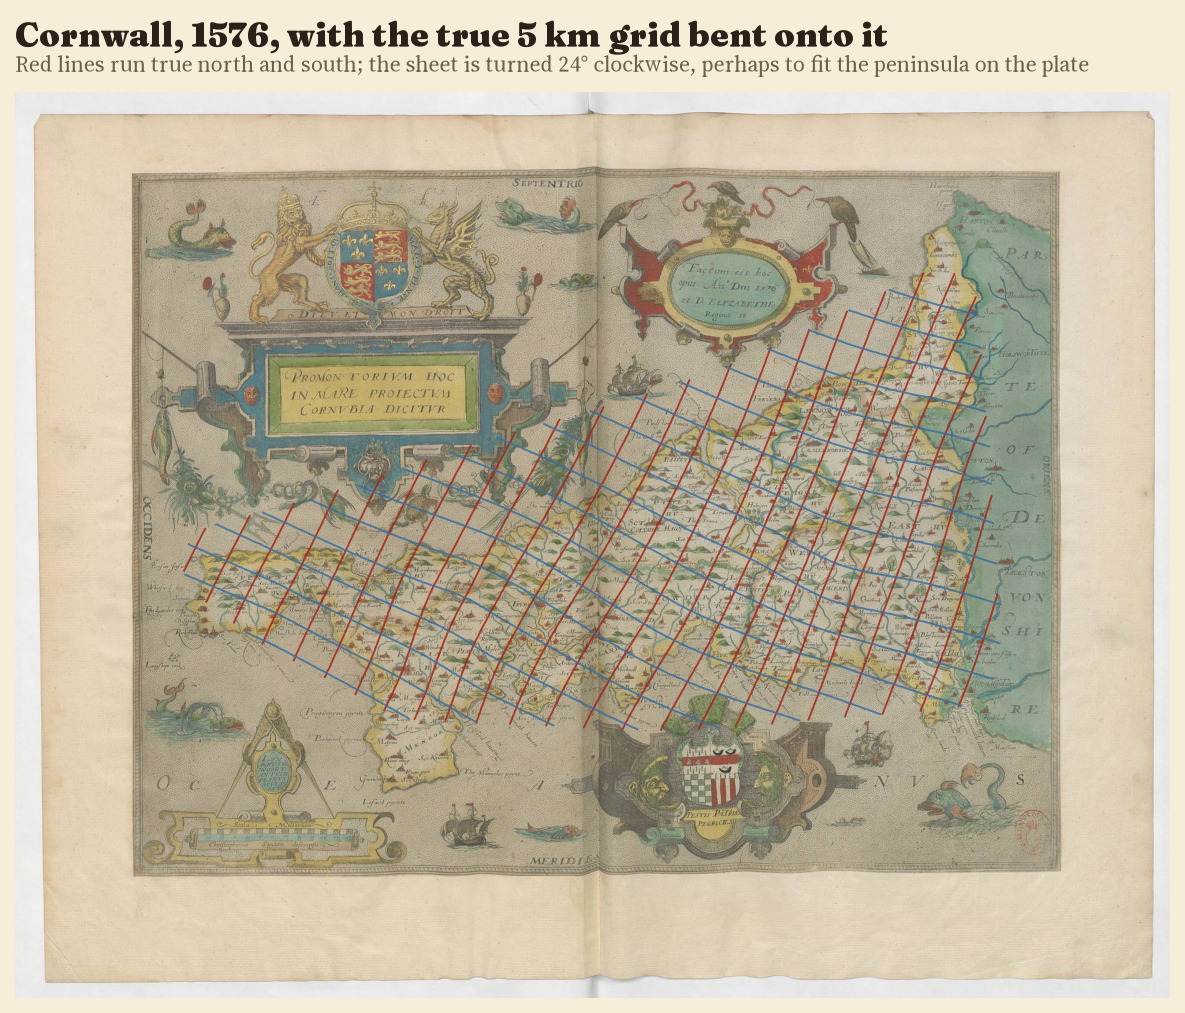
That number has a likely explanation. A compass needle does not point to true north, and in 1580 the navigator William Borough measured the difference at Limehouse as about 11¼° east. If Saxton took his bearings by compass and drew magnetic north at the top of the plate, the sheets would lean exactly this way, by roughly this much. The same tilt turns up on the portolan charts, made with compasses two centuries earlier. The general map of 1579 is different: it is turned only 0.9°, and the other way, as if whoever assembled it set it to true north. Cornwall is the odd one out, turned 24° the other way; one possibility is that the long peninsula was turned to fit the plate.
Two centuries after the Gough Map
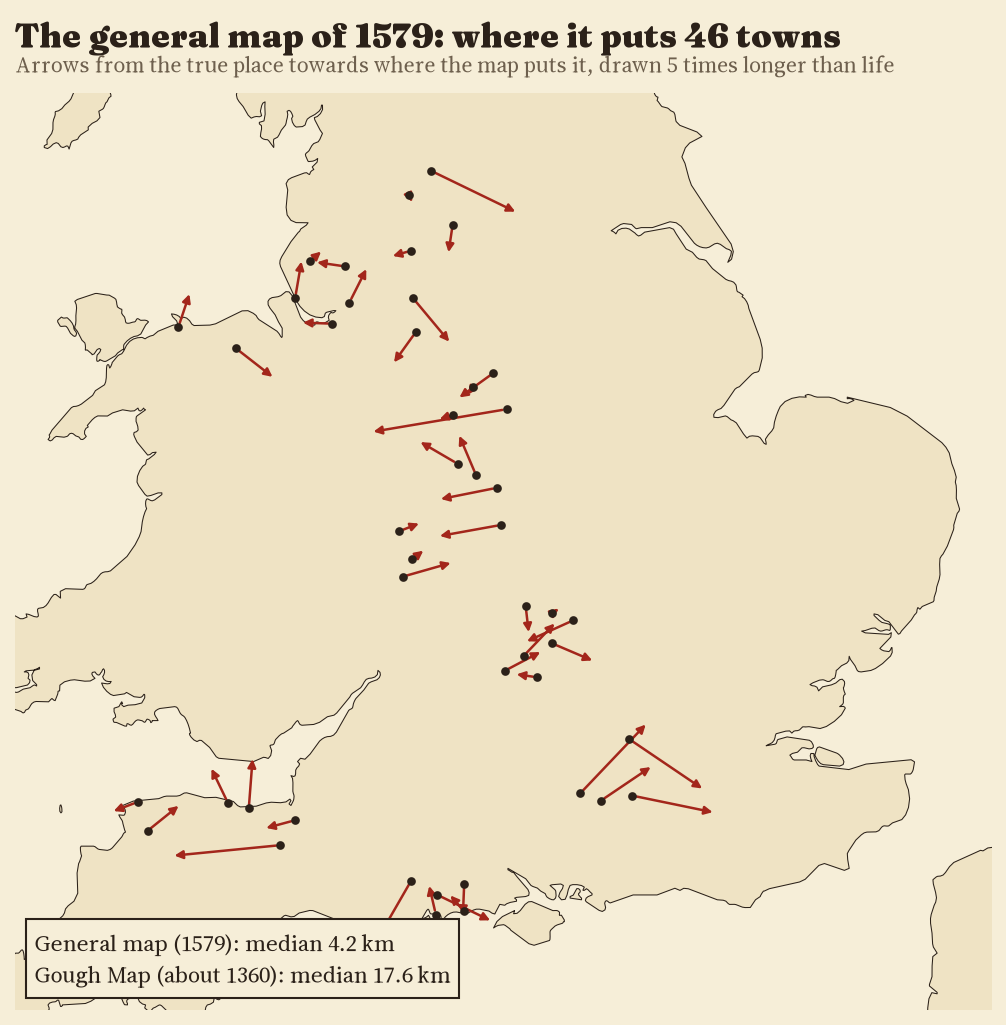
The general map squeezes the whole country onto one sheet, at about a seventh of the scale of a typical county map. Its median town is 4.2 km out. The Gough Map of about 1360, measured the same way, misplaces its median town by 17.6 km: Saxton’s general map is about 4 times as accurate, and his county maps, at their larger scale, far better still.
How I did this
I read every position by eye on zoomed crops of the scans, guided by a prediction from the towns already read, and matched each name to a Wikidata settlement point. True positions were put on a flat grid in kilometres centred on each sheet. For each sheet I fitted a similarity (scale, turn, shift) and an affine transformation by least squares, and a thin plate spline to bend the true grid onto the sheet. I then checked every reading a second time on a zoomed crop, moved symbols I had placed off target and dropped identifications I could not confirm; after that no reading sat far enough off its sheet’s fit (more than 5 km and four times the sheet’s median) to be dropped as a misreading. Wikidata points mark modern town centres, so a few hundred metres of each error are mine, not Saxton’s. The code, the readings and the fits are all on GitHub.
Notes and sources
- Christopher Saxton, atlas of England and Wales, 1574 to 1579, Bibliothèque nationale de France (ark:/12148/btv1b55007148q), public domain scans on Wikimedia Commons.
- Town positions: Wikidata (CC0). Coastlines: Natural Earth (public domain). Base map on the interactive page: OpenFreeMap, © OpenStreetMap contributors.
- William Borough, A Discours of the Variation of the Cumpas (1581); the 1580 Limehouse value as given in the Encyclopaedia Britannica (1911), article Magnetism, Terrestrial.
- Background: Ifor M. Evans and Heather Lawrence, Christopher Saxton, Elizabethan Map-maker (1979).
- Comparison: my study of the Gough Map.
- I wrote the text, with drafting and editing assistance from Claude (Anthropic), which also helped prepare the analysis code. I reviewed and checked all text and results.

