
The Romans carved words into stone across a whole empire: names of the dead, thanks to the gods, praise for emperors, distances on milestones. I put 203,466 Latin inscriptions on one map and one timeline to ask three old questions. When did they write most? How old were the dead? And how far from home were the soldiers?
The data is LIRE, a dataset built by Vojtěch Kaše, Petra Heřmánková and Adéla Sobotková that merges the two big online collections of Latin inscriptions, the Epigraphik-Datenbank Clauss/Slaby and the Epigraphic Database Heidelberg. Every inscription in it has a findspot and a date range, such as “AD 101 to 200”, set by the editors. That range is the catch: very few inscriptions carry an exact year. So when I count inscriptions in a period, I share each one evenly across the years of its range, and I check the answers by drawing a random year for every inscription a thousand times over.
Italy, the frontiers and the cities
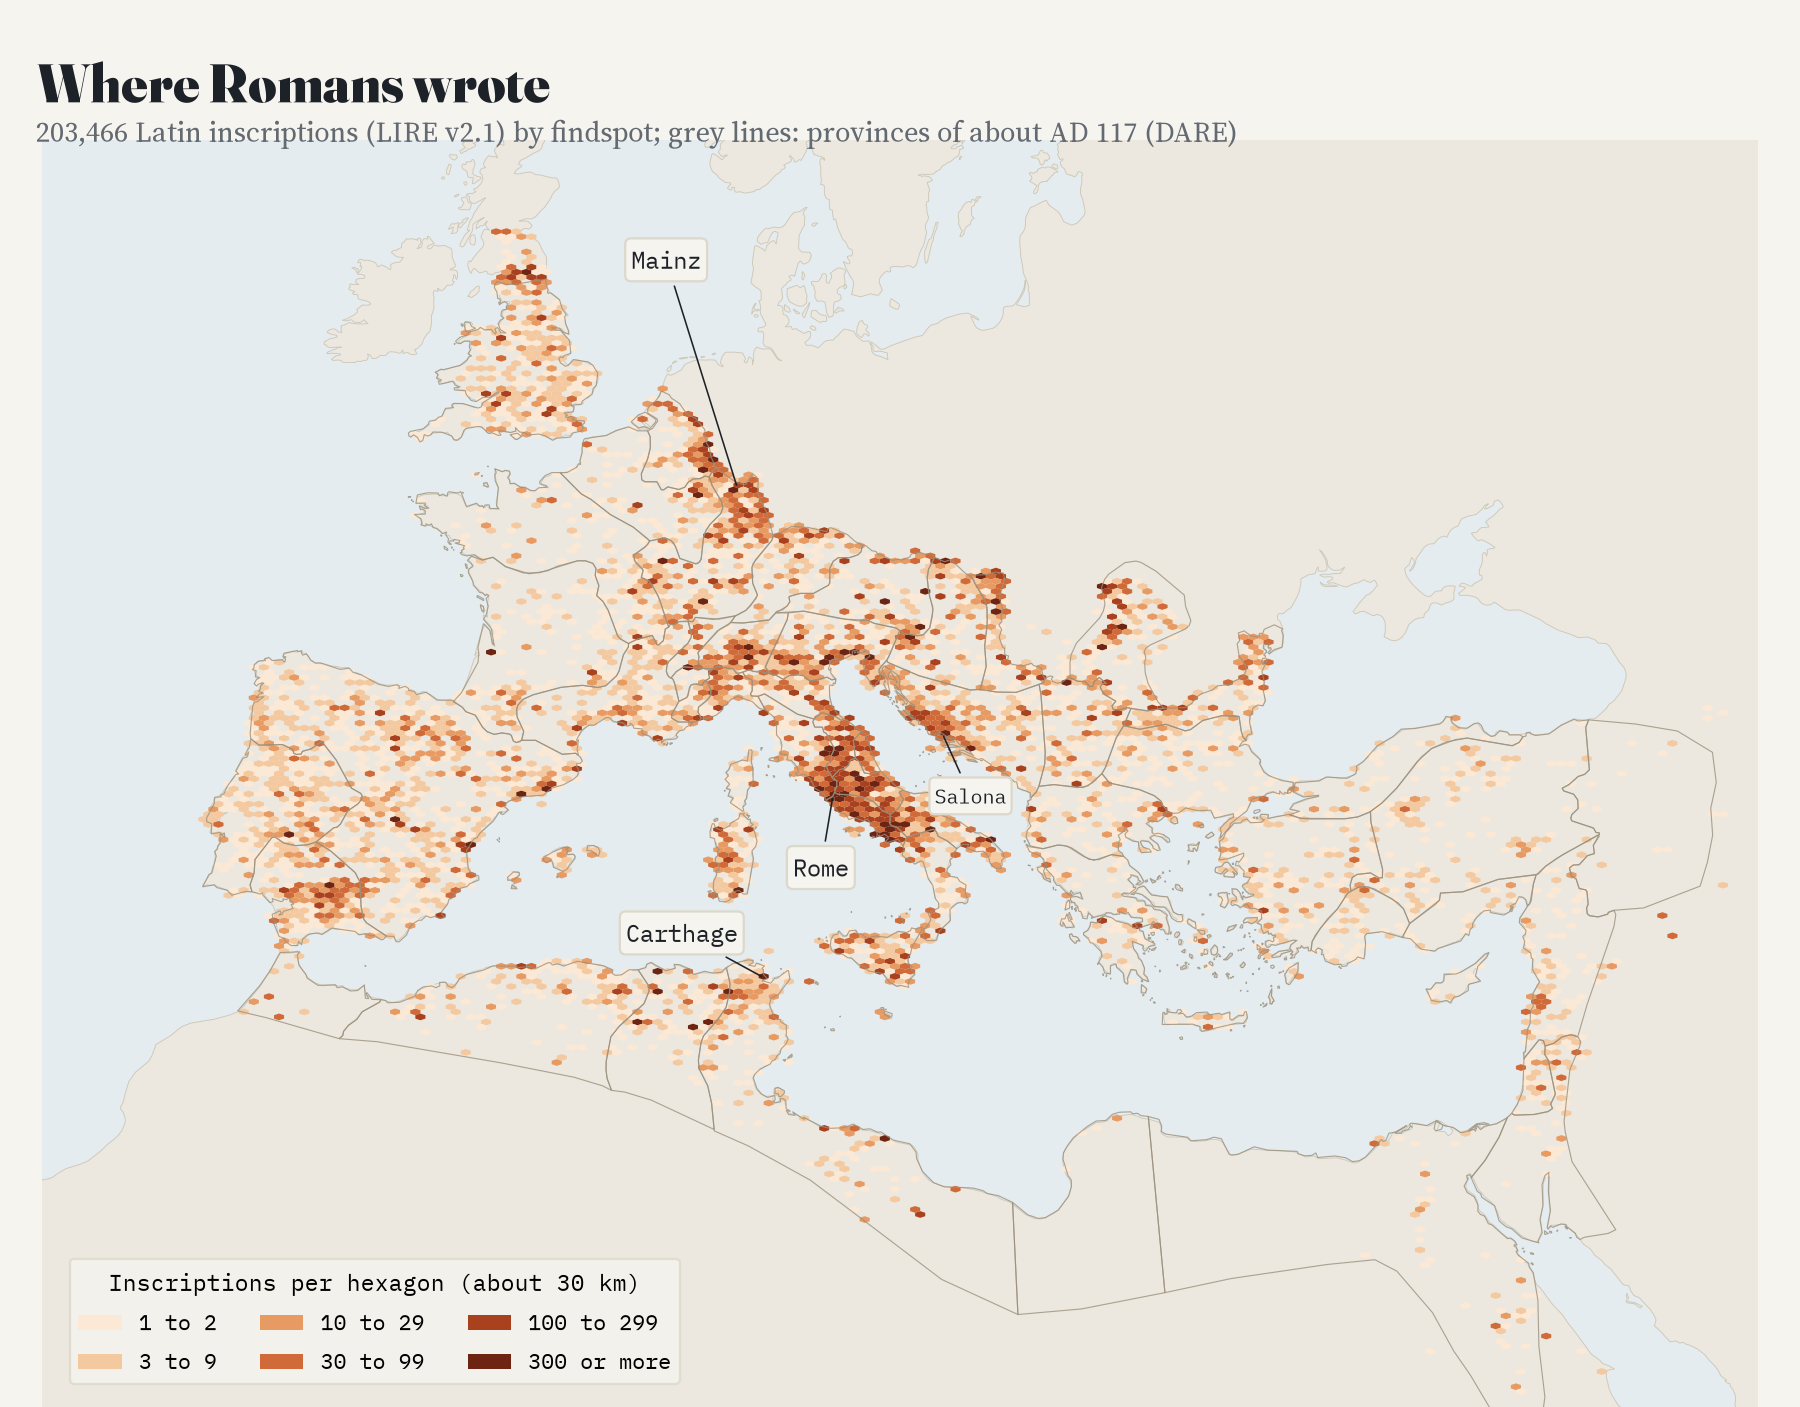
The first thing the map shows is how lopsided the record is. The city of Rome alone has 75,301 inscriptions, 37% of the whole collection, and with the rest of Italy it has 61%. Beyond Italy the writing follows the army and the towns: the Rhine around Mainz, the Danube, the Dalmatian coast around Salona, the cities of what is now Tunisia and Algeria, and southern Spain. Britain has about 28 inscriptions per 1,000 km², the area around Rome and Naples about 1,379. Greek inscriptions are not in this dataset, so the eastern half of the empire looks far emptier than it was.
The habit, and its end
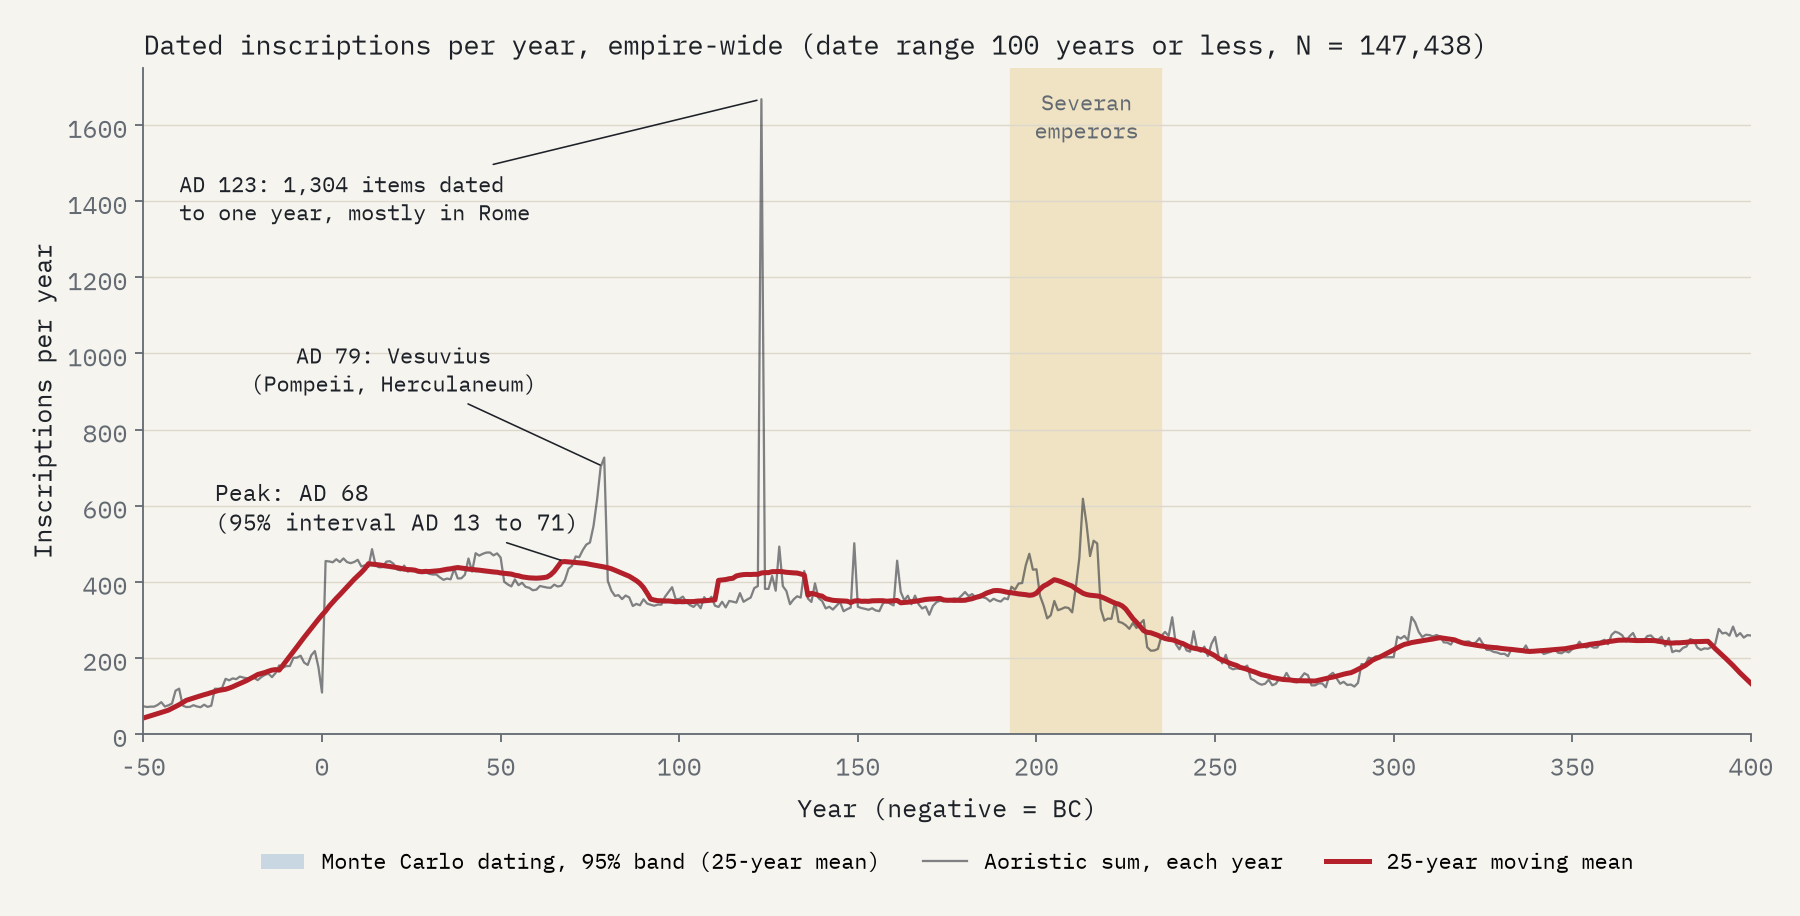
In 1982 the historian Ramsay MacMullen named the “epigraphic habit”: Romans inscribed more and more through the first and second centuries, peaked under the Severan emperors (AD 193 to 235), and then fell away quite suddenly. The collapse is real and big. Taking the 147,438 inscriptions with a date range of a century or less, the empire produced 2.2 times as many inscriptions a year under the Severans as in AD 250 to 300.
But the peak is not where I expected it. Across the whole collection it comes in AD 68, in the first century, because Rome and Italy, with most of the inscriptions, wrote most then. I had written down in advance that a peak outside AD 175 to 250 would count against MacMullen’s timing, so by my own test it fails. Two spikes in the chart are quirks of exact dates: the eruption of Vesuvius in AD 79, after which 3,353 texts from Pompeii carry an end date of AD 79, and 1,304 items dated to AD 123, mostly stamped bricks and objects from Rome.
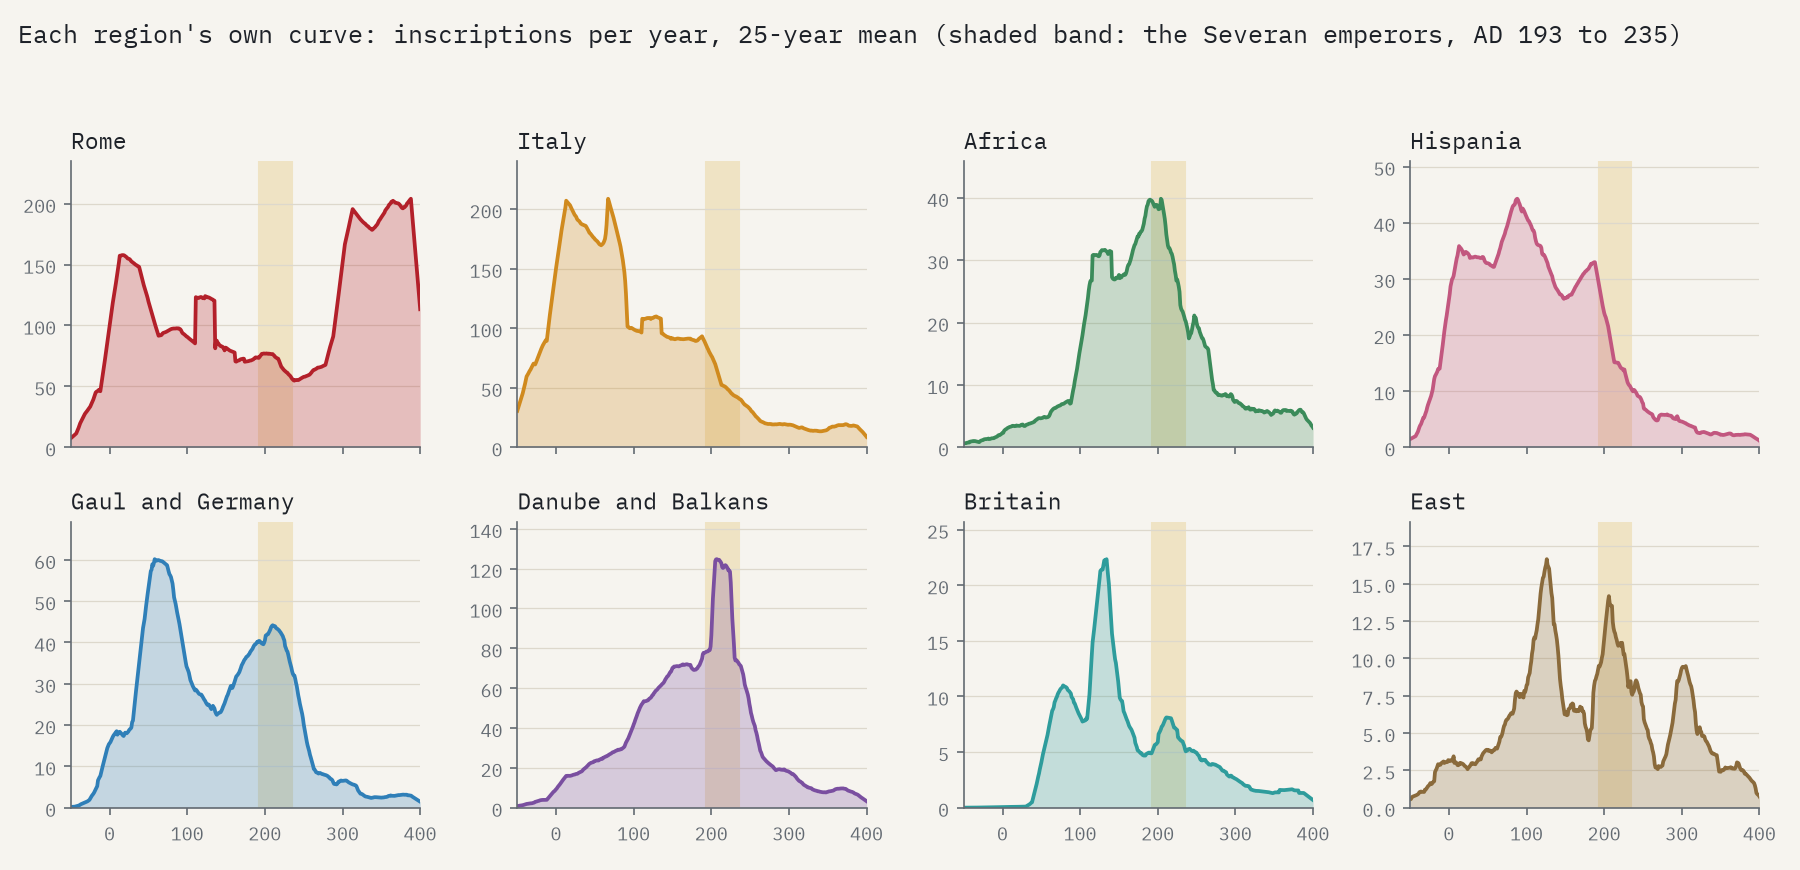
Split the empire into regions and MacMullen’s peak comes back. Africa, the Danube provinces and Dacia rise through the second century to a sharp Severan high point and then fall away. Of the 27 provinces with at least 1,000 dated inscriptions, 10 peak between AD 175 and 250. Italy peaked two centuries earlier. The kinds of inscription differ too: altars and dedications to the gods peak in AD 209, honours for emperors and patrons in 205, milestones in 247. The Severan peak, in other words, belongs to the provinces and to public writing, while the epitaphs of Italy set the shape of the whole.
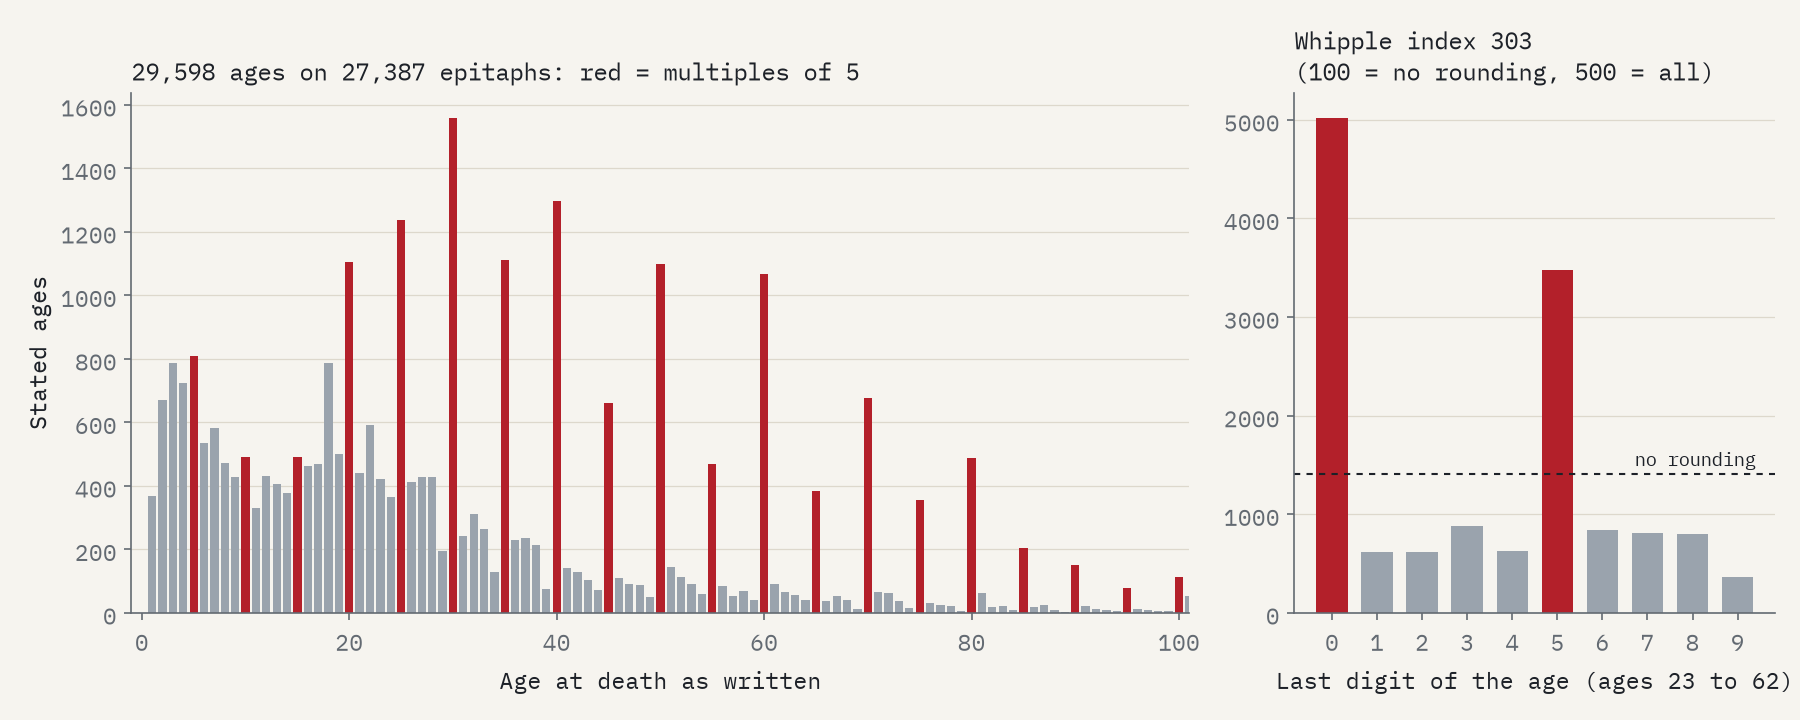
Thirty, forty and fifty: the dead were rounded to fives.
How old were the dead?
Many tombstones say how long the dead person lived: vixit annis XXX, “lived 30 years”. I read 29,598 ages from 27,387 epitaphs, with a rule that skips years of army service and years of marriage, and checked 200 of them by hand (199 were right). The ages are heavily rounded. Between 23 and 62, 5,020 end in 0 and 3,474 in 5, where about 1,404 each would be expected if people knew their exact age. Demographers measure this with the Whipple index, which runs from 100 (no rounding) to 500 (every age a multiple of five). On Roman tombstones it is 303.
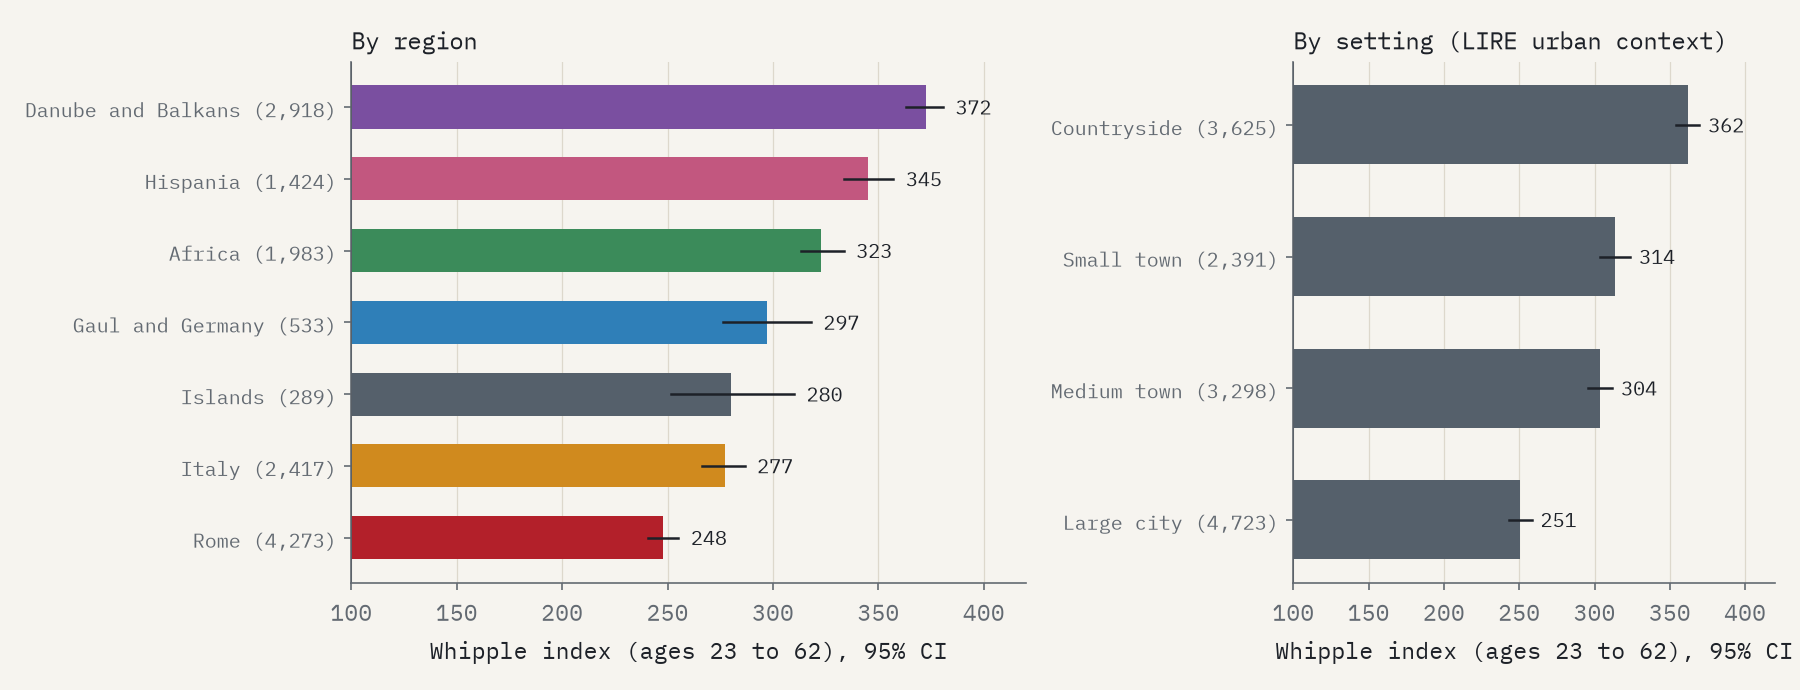
Rounding is lightest in Rome (248) and heaviest in the Danube and Balkan provinces (372). It is heavier in the countryside than in big cities, and heavier for older people. The historian Richard Duncan-Jones read rounding as a sign of how few people knew their exact age, and expected it to be worst in Africa. Africa’s index is higher than Rome’s (323), but African stones are mostly rural and give older ages. Compare like with like and the African difference is no longer clear (odds ratio 1.22, 95% interval 0.88 to 1.68). The countryside effect holds in my main model but not in every check, so I treat it as likely rather than certain.
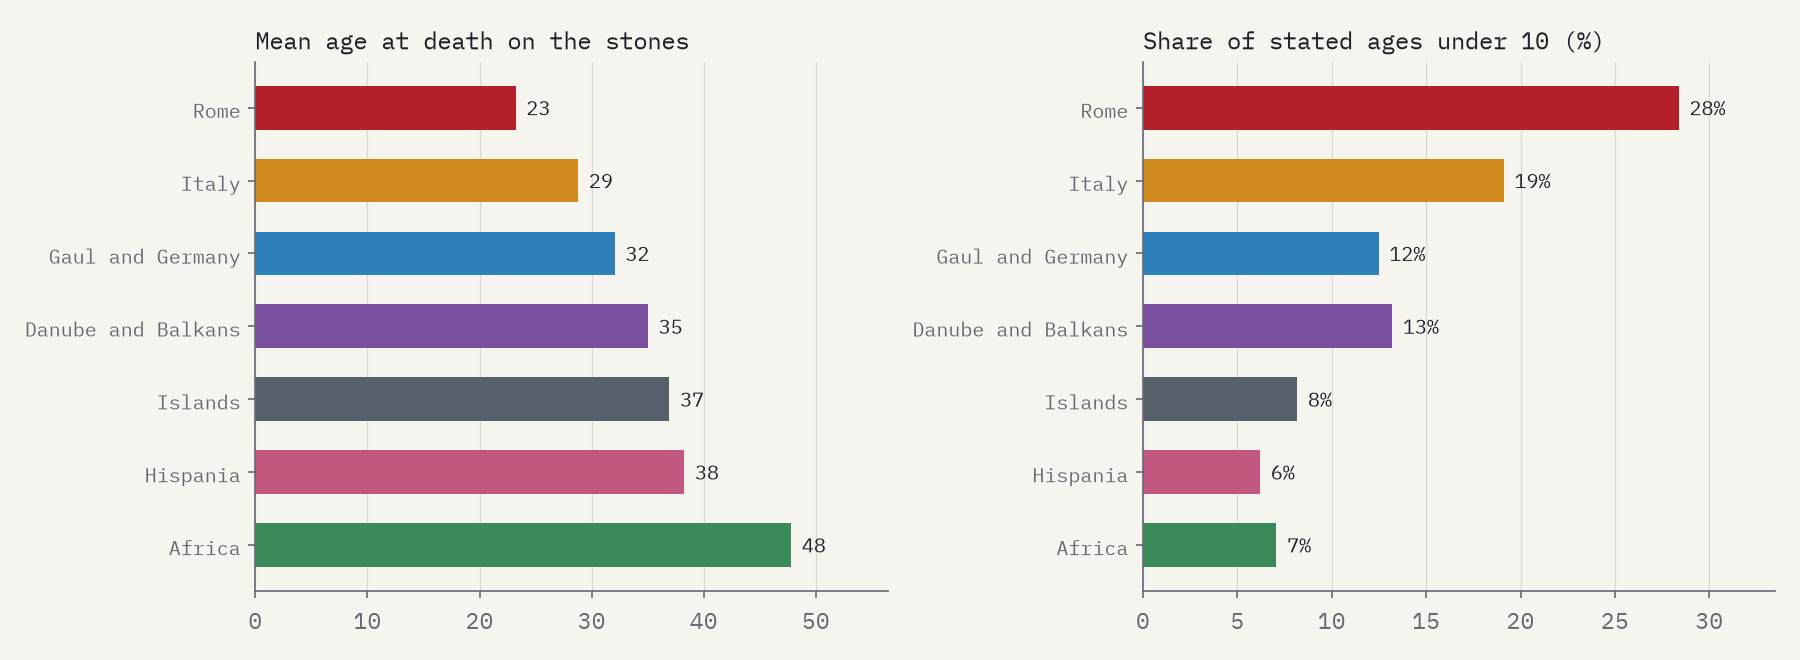
Can tombstones tell us how long Romans lived? No, as Keith Hopkins showed in 1966, and the full collection makes the point well. The average age on the stones is 23 in Rome and 48 in Africa. Only 7% of African ages are under 10, against 28% in Rome, at a time when young children made up a large share of all deaths. And 154 ages on African stones are 100 or more. The stones tell us who was remembered, and how, not who died.
Soldiers far from home
Soldiers often said where they came from: domo Verona, “home: Verona”; a voting tribe and a town; or a people, like natione Bessus, a Thracian. Of 19,484 military inscriptions, 865 name an origin I could place on the map. The median journey from home to stone is 674 km, and 68% are more than 500 km. Many lines run to Rome and the Bay of Naples, where the emperor’s guard and the fleet at Misenum drew men from Egypt, Thrace, Syria and Pannonia.
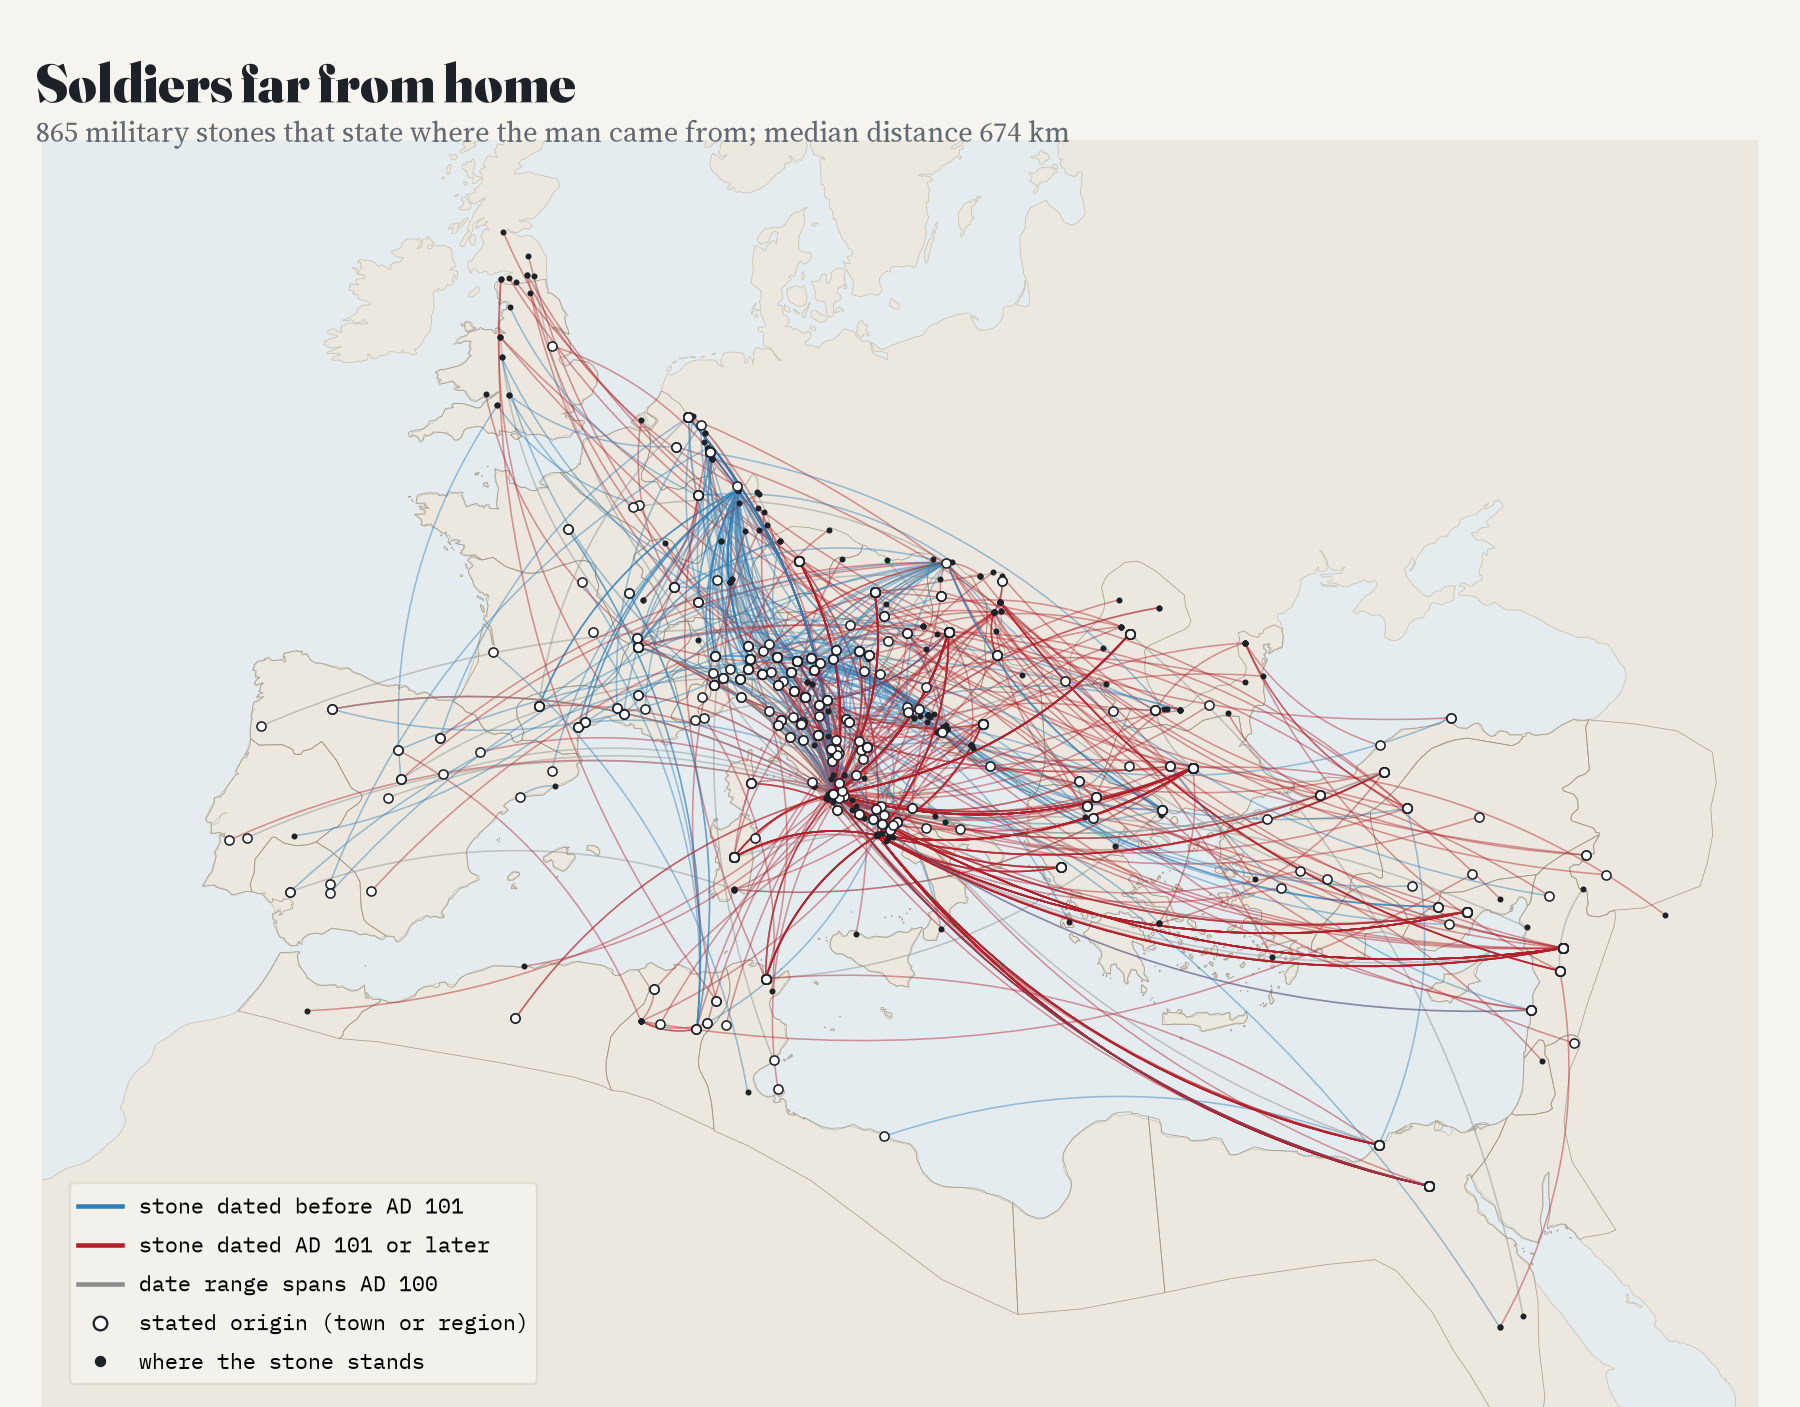
Historians have long shown that the army recruited more locally as time went on. I expected the stones to show homes getting closer. They do not: later stones name homes further away (750 km against 545 km), and among homes given as towns there is no change at all. My reading is that this is about who bothered to say. A soldier buried near where he was born had little reason to carve his home town; a Thracian sailor in Italy did. So the stones that name a home are a sample of the far-travelled, and they cannot answer the question on their own.
How I did this
I wrote down the questions, the tests and what would count against each idea before computing any result, and I report the planned tests even where they failed (three of the six did). Counts through time share each inscription across its date range, with a thousand random redraws of the dates for the intervals. Ages come from a fixed reading rule checked against 200 hand-read examples and 100 tombstones where it found nothing. Soldiers’ homes are matched to the Digital Atlas of the Roman Empire, and every home named twice or more was checked by eye. The rounding comparisons use a model that holds region, setting, age and Christian epitaphs fixed and allows for many stones from one place.
The limits matter. These are the inscriptions that survived, were found, were published and were typed into a database, so Rome and Italy dominate and the Greek East is almost missing. Dates are editors’ ranges, some of them conventions. Ages are what families and stonecutters wrote. And only a small minority of soldiers’ stones name a home.
Notes and sources
- Inscriptions: LIRE v2.1, Latin Inscriptions of the Roman Empire, by V. Kaše, P. Heřmánková and A. Sobotková (Aarhus University), Zenodo, CC BY 4.0; built from the Epigraphik-Datenbank Clauss/Slaby and the Epigraphic Database Heidelberg.
- Provinces and ancient places: Digital Atlas of the Roman Empire, Johan Åhlfeldt, Lund University (CC BY 4.0). Base map of the interactive page: OpenFreeMap Positron (OpenStreetMap).
- Further reading: R. MacMullen, “The epigraphic habit in the Roman Empire”, American Journal of Philology (1982); E. A. Meyer, “Explaining the epigraphic habit in the Roman Empire”, Journal of Roman Studies (1990); R. P. Duncan-Jones, “Age-rounding, illiteracy and social differentiation in the Roman Empire”, Chiron (1977); K. Hopkins, “On the probable age structure of the Roman population”, Population Studies (1966); J. C. Mann, Legionary Recruitment and Veteran Settlement during the Principate (1983).
- I wrote the text, with drafting and editing assistance from Claude (Anthropic), which also helped prepare the analysis code. I reviewed and checked all text and results.

