
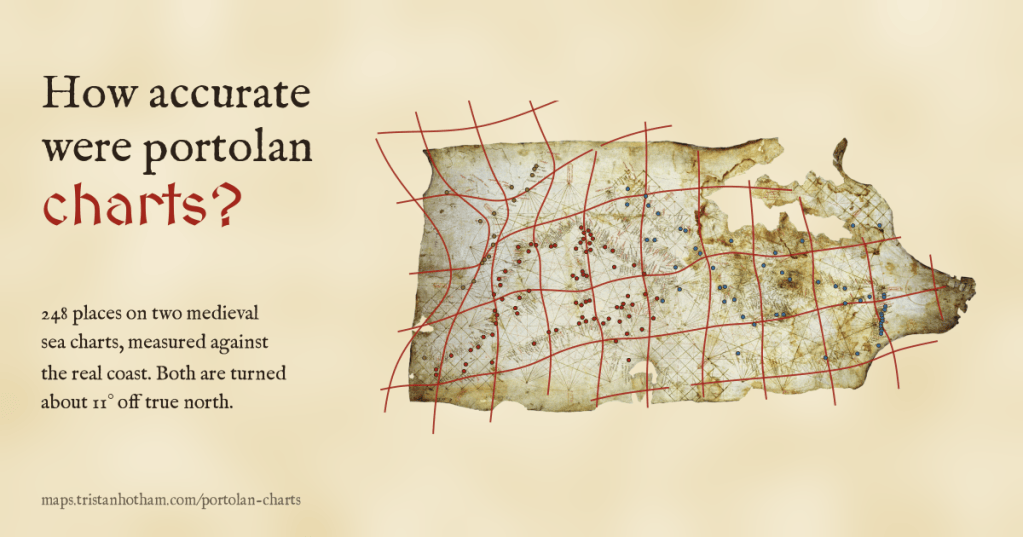
The oldest sea charts of the Mediterranean look almost modern. I read 349 places on two of the most famous, the Carta Pisana and the Catalan Atlas, and measured them against the real coast. At home in the Mediterranean they are astonishingly good. Beyond Gibraltar they fall apart. And both are turned about 11 degrees off north.
I have spent a good part of this year measuring old maps against modern ones: Ptolemy’s coordinates, al-Idrisi’s map for Roger II of Sicily, the Hereford Mappa Mundi. They are wonderful things, but as pictures of the world they are rough. Then, around the end of the thirteenth century, something else appears. Sea charts drawn on a single animal skin, covered in a web of straight compass lines, with the names of harbours written inland at right angles to the coast, and a Mediterranean that you would recognise at a glance. Nobody knows quite how they were made. They are called portolan charts, and I wanted to know how good they really are.
I picked the two best known early examples. The Carta Pisana, named after Pisa, where it turned up in the nineteenth century, is usually dated to around 1275 and is the oldest portolan chart to survive. It is badly faded, and its eastern end is damaged. The Catalan Atlas of 1375, made in Majorca and usually attributed to the workshop of Cresques Abraham, is a much grander thing: a chart spread across four painted panels, crowded with kings, tents, camels and ships. Both are in the Bibliothèque nationale de France, and both have public domain scans.
Reading the charts
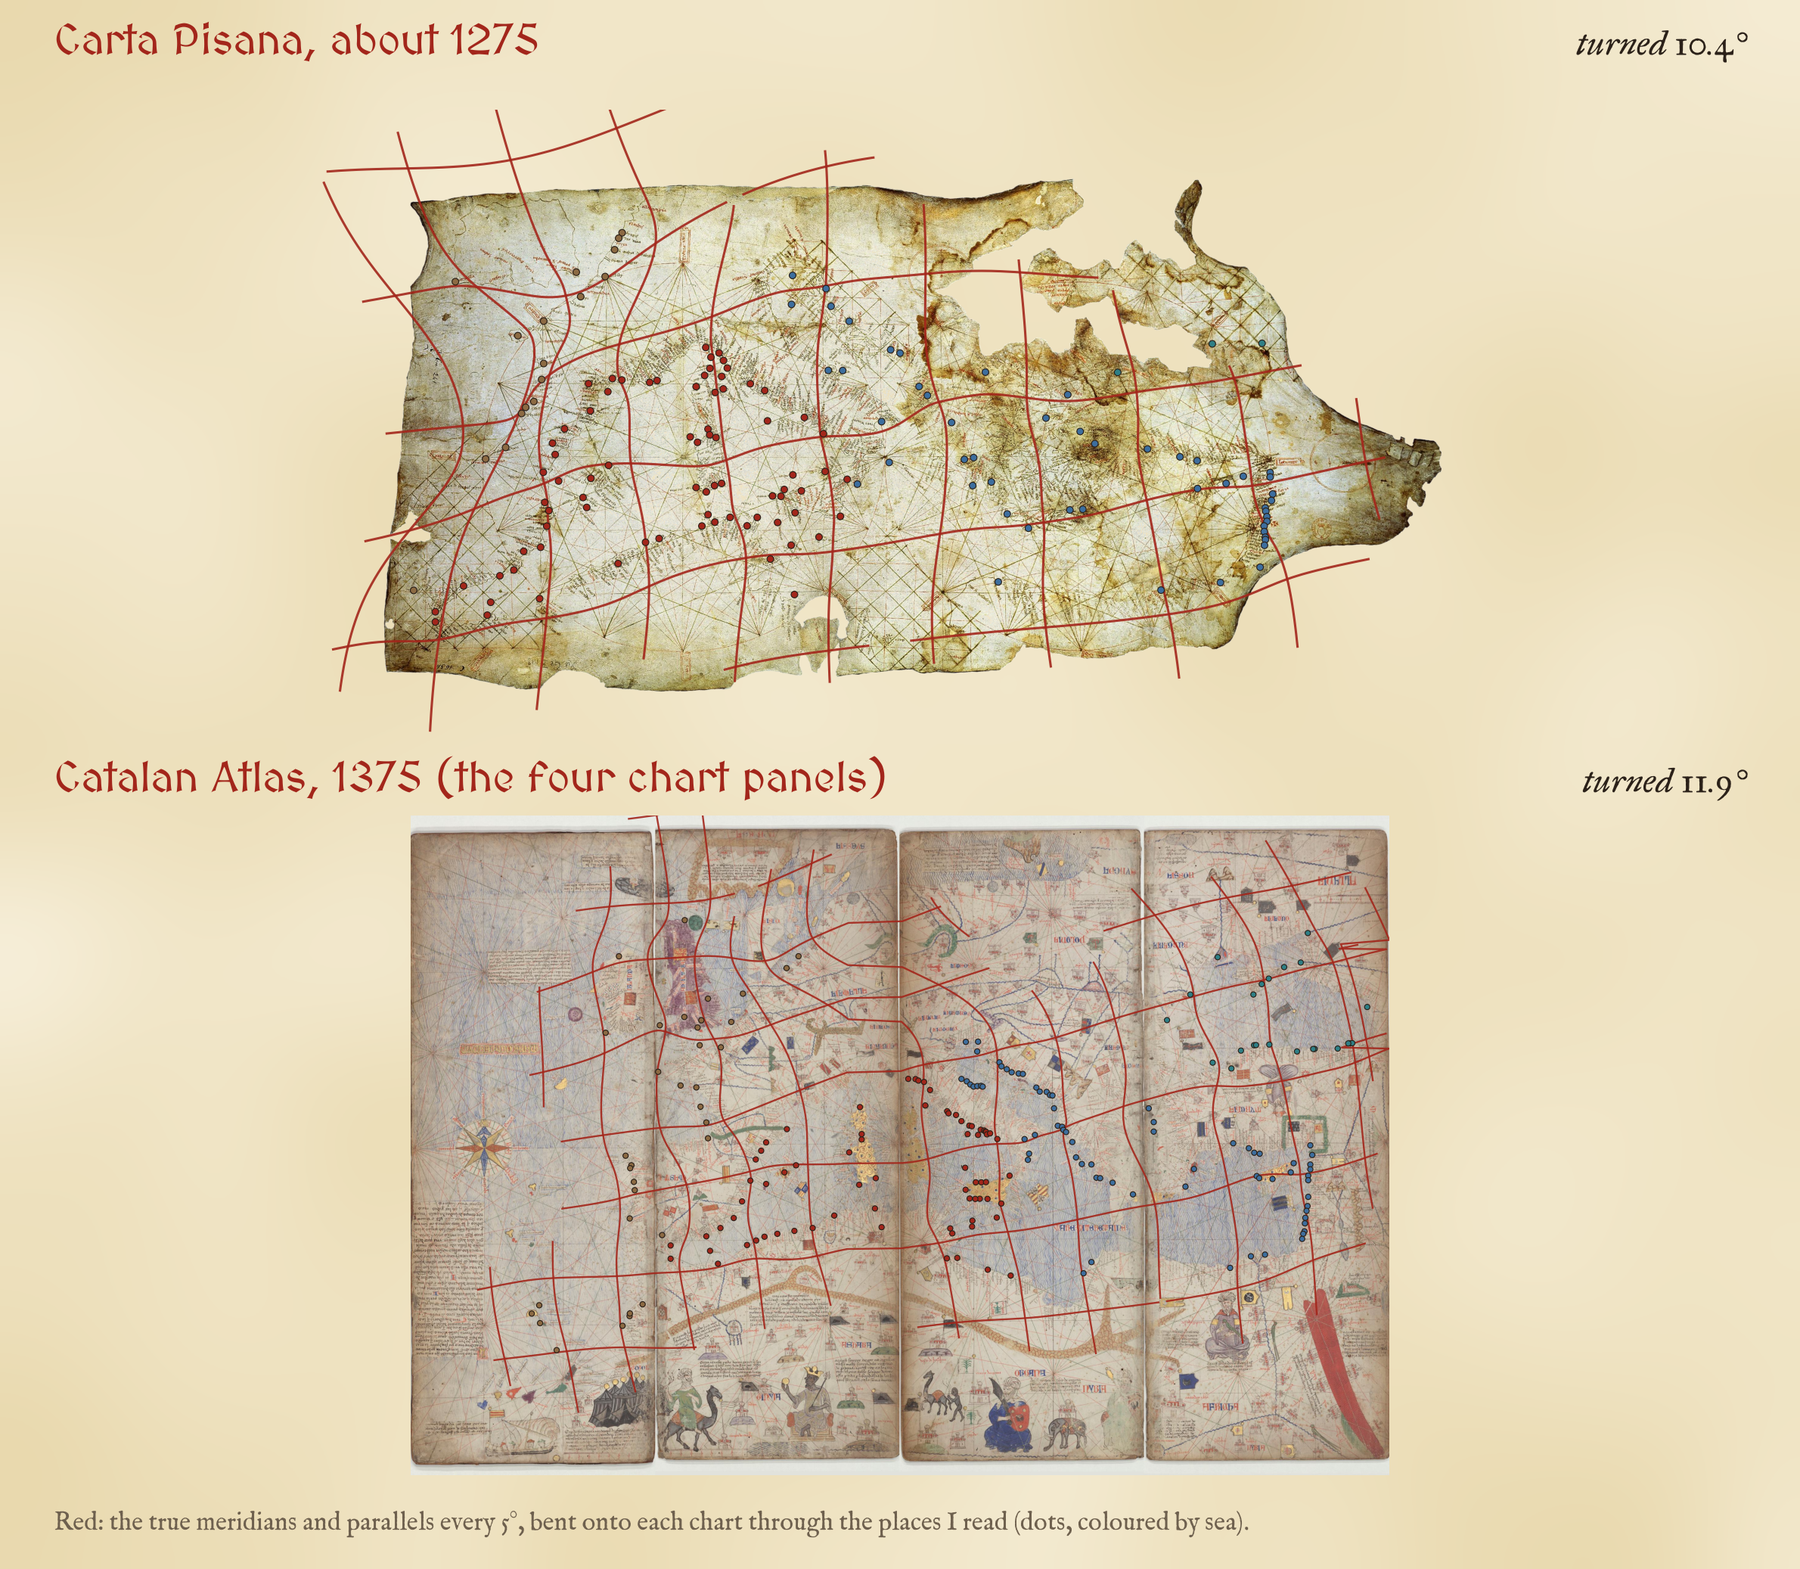
There is no ready made table of points for either chart, so I read them myself, on zoomed crops with a pixel grid: harbours where a name or a town sign pins the place down, headlands and river mouths read from the drawn coast, and islands. That gave 148 places on the Pisana and 201 on the Catalan Atlas, each with my identification, its true position and a flag for how sure I am.
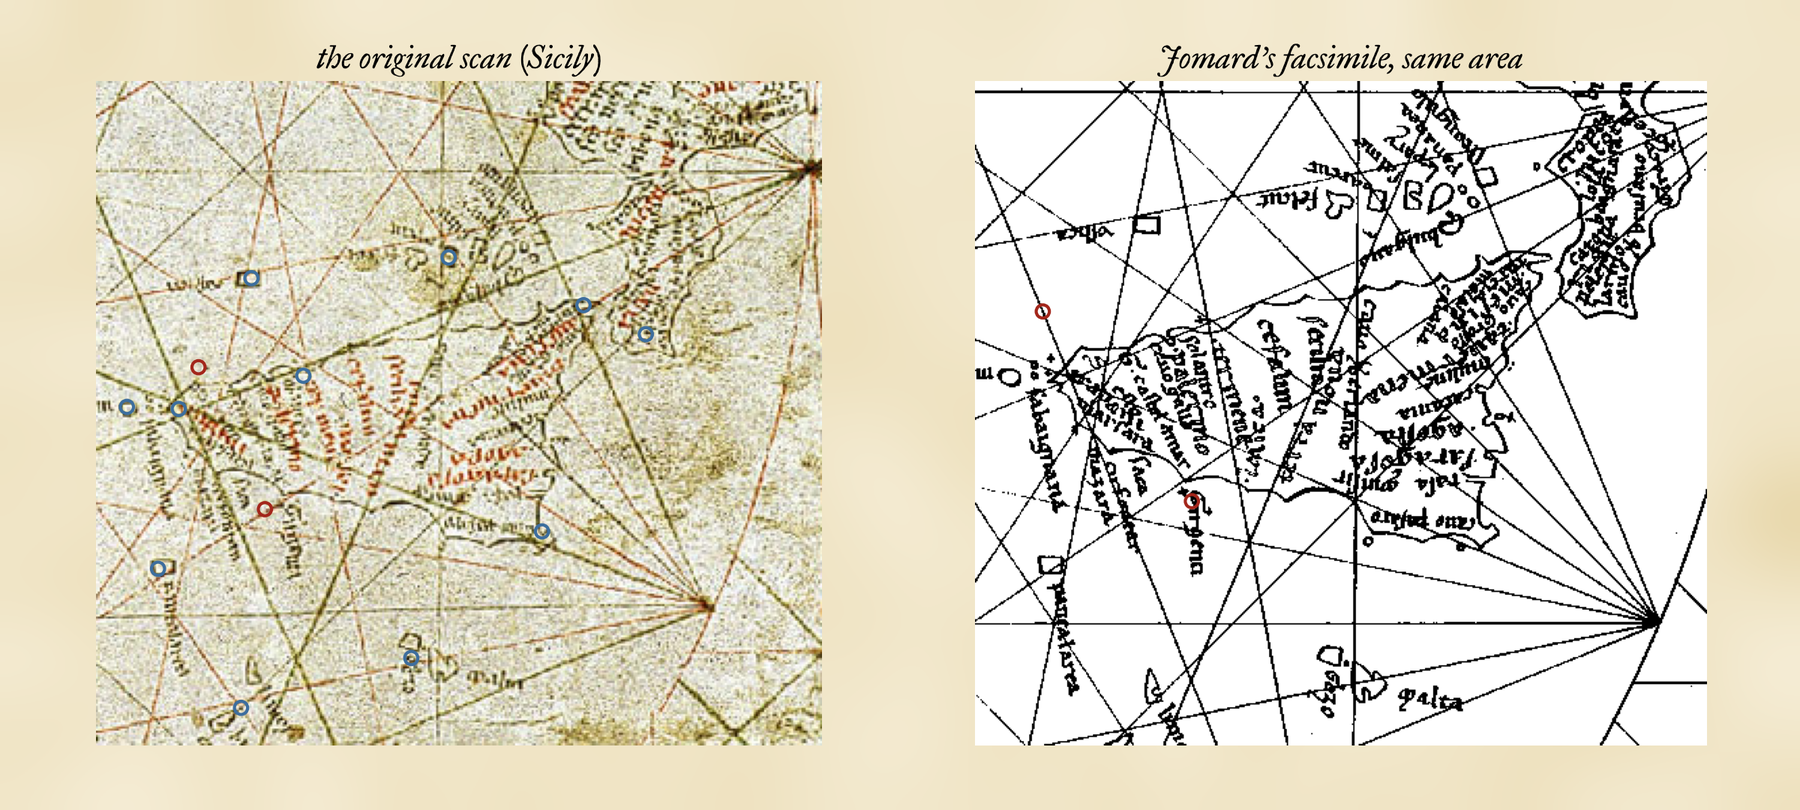
The Pisana is hard to read. For most of its names I used the lithographed facsimile that Edme François Jomard published in the nineteenth century, and then carried each position back to the original scan, bending the facsimile onto the original through the centres and points of the chart’s two great compass circles. Tested place by place, that transfer is good to a median 37 km on the ground, which is worth remembering: some of the error below is mine, not the chart maker’s.
Ten degrees off north
The first thing the measurement shows is a tilt. To lay the Pisana over the real Mediterranean you have to turn it 10.4 degrees anticlockwise; the Catalan Atlas needs 11.9 degrees. You can see the same thing without any fitting at all. Take every pair of places at least 100 km apart and compare the direction between them on the chart with the true compass direction: on the Pisana, 94% of the 10,738 pairs are turned anticlockwise, by a median of 10.2 degrees.
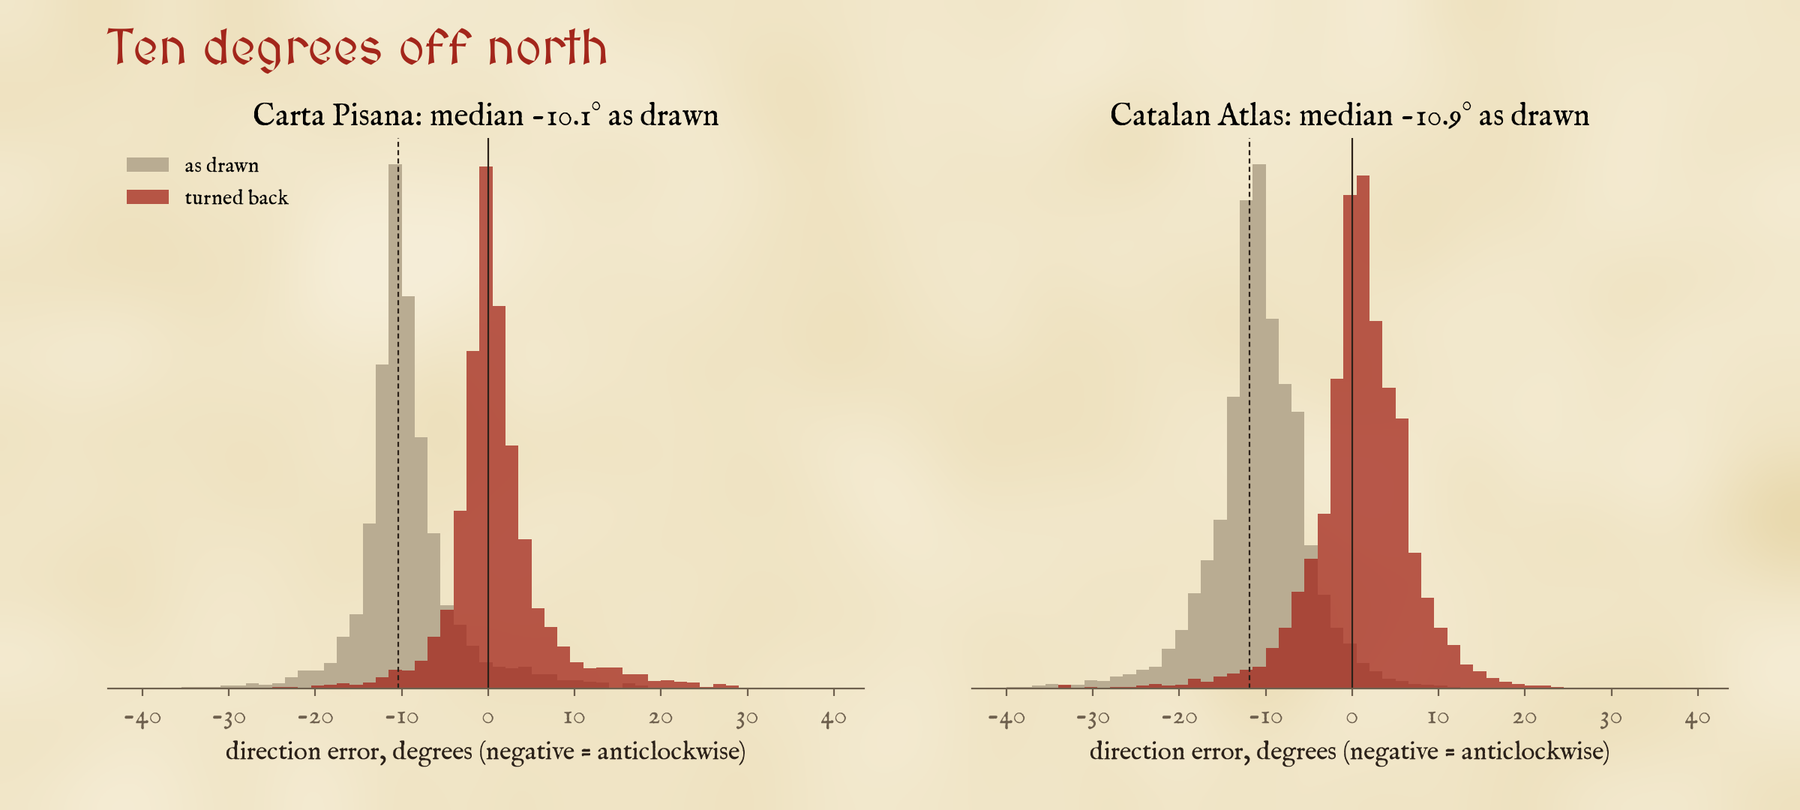
The usual explanation is the compass. If the charts were built up from courses steered by a magnetic compass, and the compass needle then pointed some degrees east of true north, the whole picture would come out turned, just like this. My numbers cannot prove that, but they fit it well. The tilt is almost the same on two charts made a century apart, and on the Pisana it is almost the same in the western and eastern halves of the sea fitted on their own, 9.7 and 10.0 degrees. Turn the Pisana back and its directions are right to a median 2.1 degrees, with 78% of pairs within five degrees.
Superb at home, lost in the Atlantic
With one scale, one turn and one shift for the whole chart, the median Pisana place is 93 km from where it should be, and the median Catalan place 88 km. That sounds a lot until you look at where the errors are.
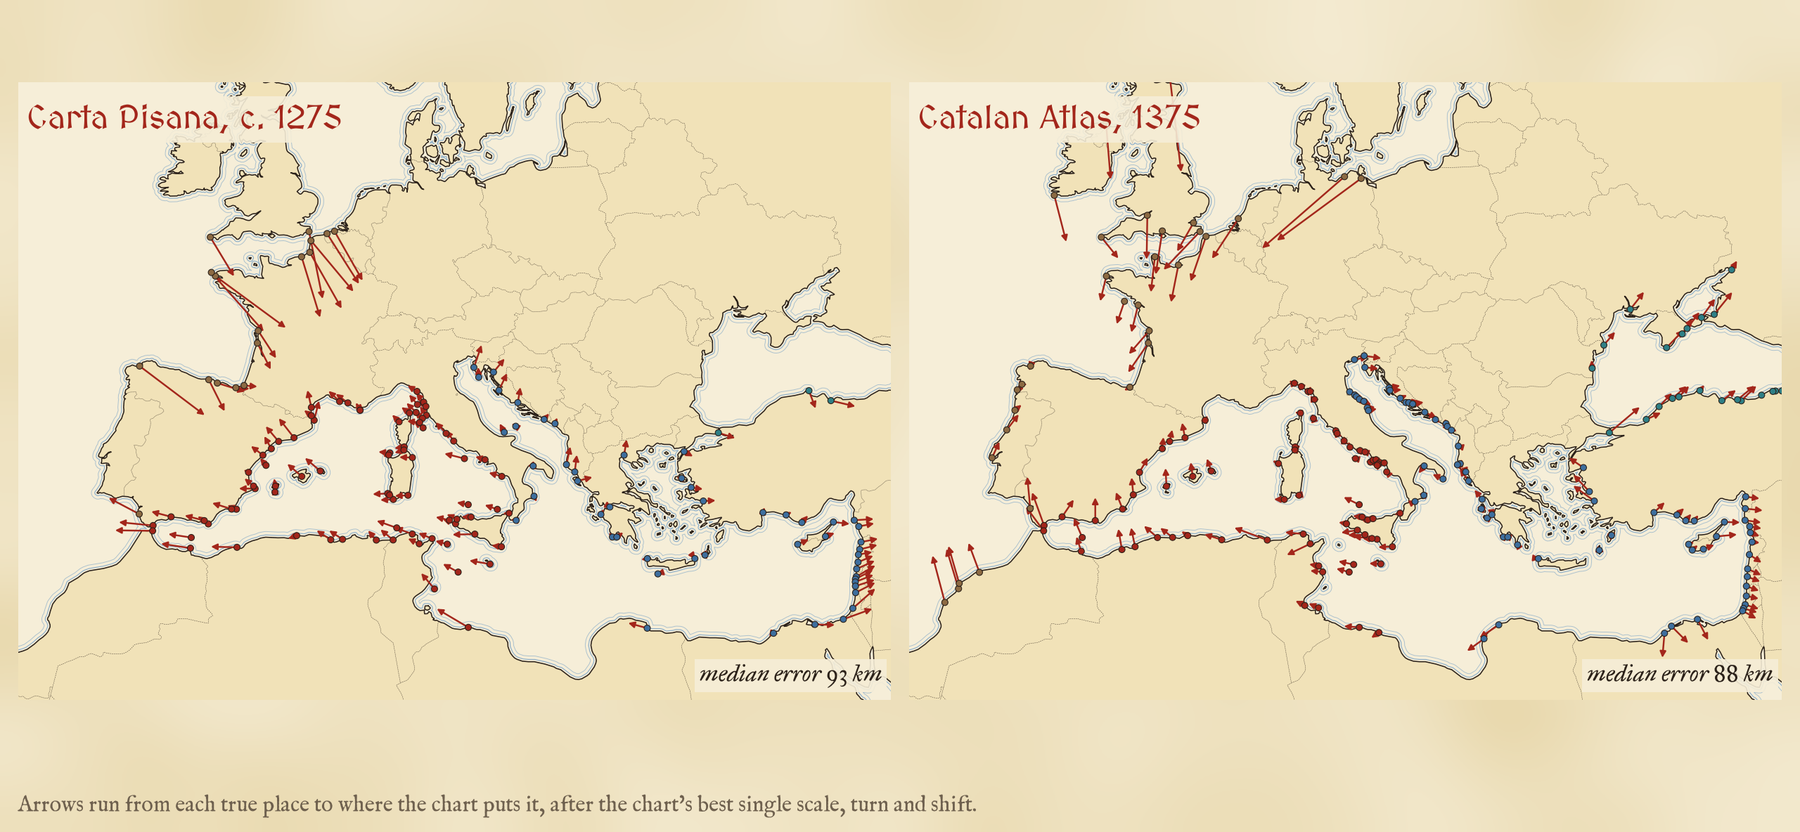
Around the Mediterranean the arrows are short. On the Atlantic coasts they are long and they all point the same way. The Pisana’s Atlantic places are a median 312 km out, 3.7 times as far as its Mediterranean ones, and the Atlantic is drawn 18% too small for the rest of the chart. The Catalan Atlas, a century later, draws the Atlantic coasts better (fitted on their own they are 87 km out, against 99 km on the Pisana), but they are still shrunk, by 22%, and still out of place: its worst place is Dunnet Head, the top of Scotland, 587 km out.
Fit each sea on its own and the Pisana’s Mediterranean harbours are a median 36 to 43 km out, less than a day’s sail.
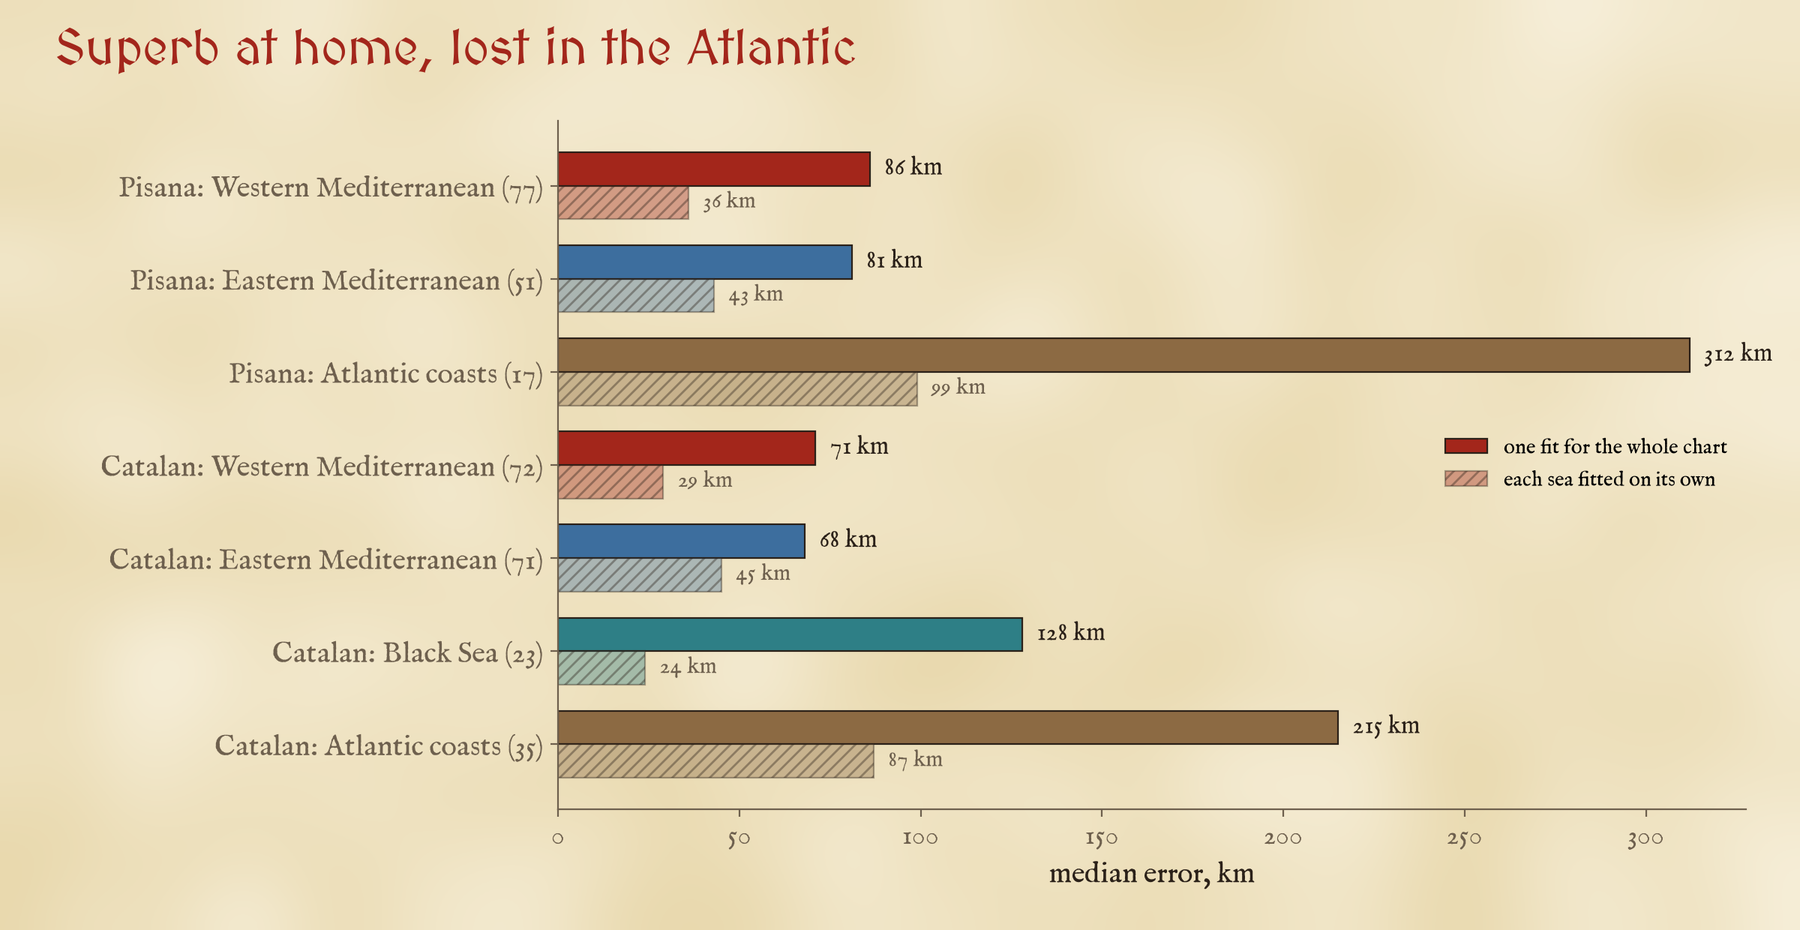
Fitted sea by sea, the Mediterranean gets better still: 36 km in the west and 43 km in the east on the Pisana. Judge each place only against its eight nearest neighbours and the median Pisana place is 38 km out, the median Catalan place 27 km. A few are almost perfect: Capo Peloro at Messina, Almería and Sidon all sit within 5 km of where their neighbours say they should be. This is exactly what you would expect from a chart pieced together from many sailing courses, each with a compass bearing and a distance: very good locally, a little inconsistent from one sea to the next, and weakest on the coasts the compilers sailed least.
I also asked whether the charts fit better on one projection than another, since some writers have argued that their accuracy points to a hidden map projection. Both fit a plain rectangular grid of latitude and longitude at least as well as Mercator: 86 against 93 km on the Pisana. Over a sea that spans so little latitude the difference is small and well within my reading error, so I would not lean on it either way.
The first maps that look right
Measured the same way, nothing earlier that I have studied comes close. Ptolemy’s coordinates miss by a median 144 km, about 1.5 times the Pisana, and even his regional maps of Italy and Greece, fitted on their own, miss by 74 and 52 km. Al-Idrisi’s map of 1154 misses by 239 km. The Hereford Mappa Mundi, drawn at about the same time as the Pisana, misses by 516 km, 5.5 times as far. The measures are not identical, with different numbers and spreads of places, but the ranking is not in doubt.
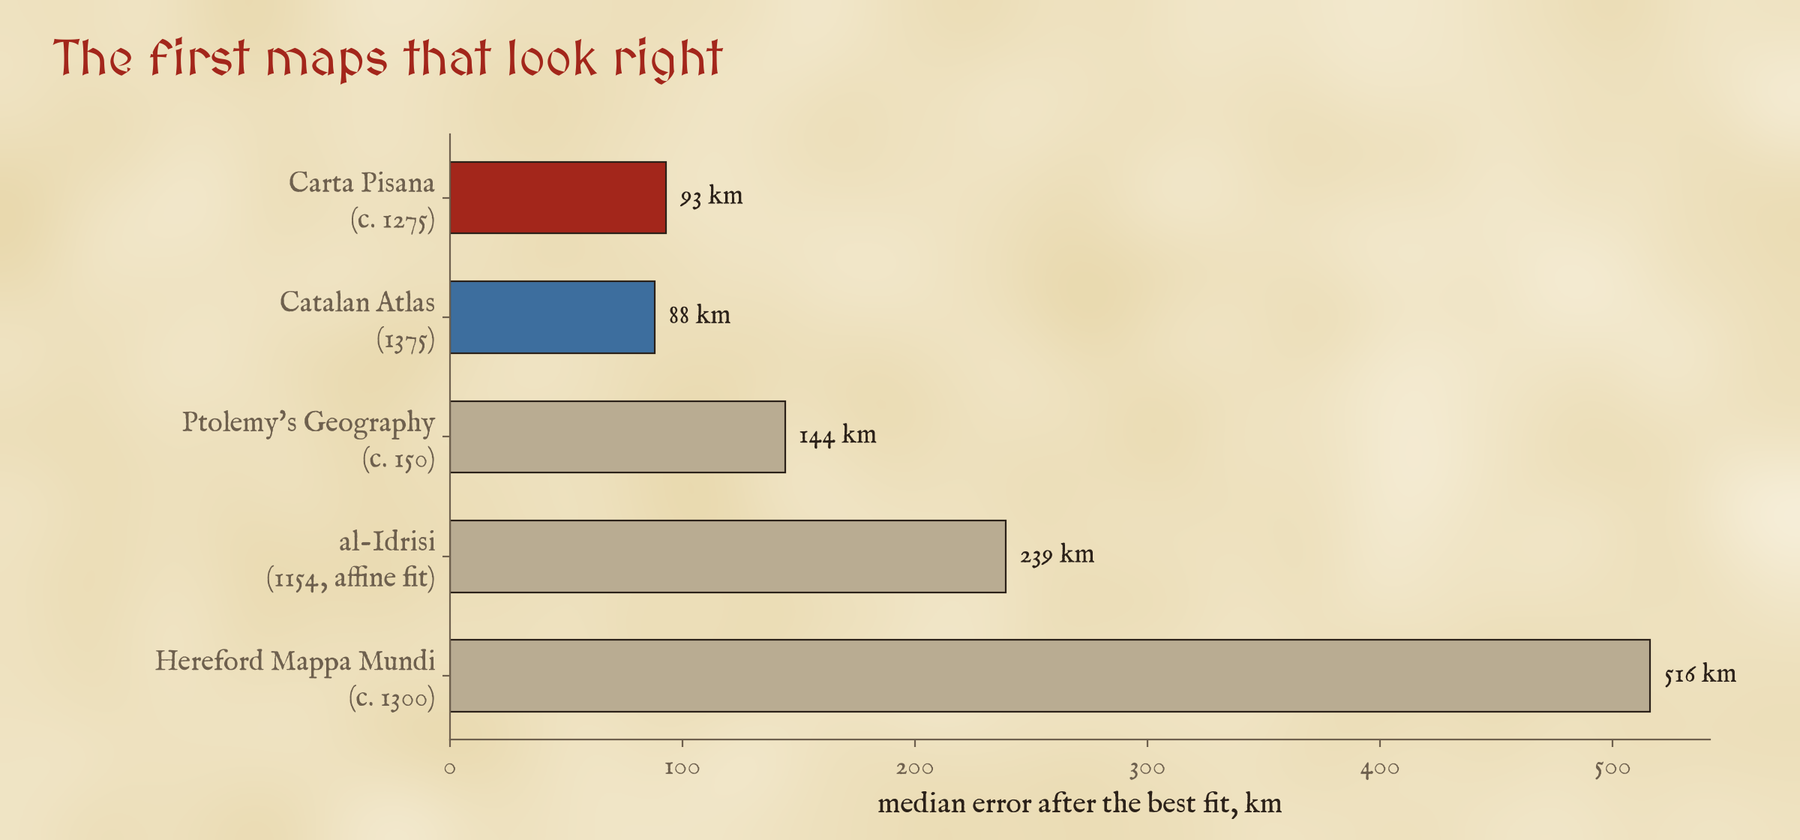
The world map at Hereford was made to show history, scripture and wonder, not to sail by, so this is not quite a fair fight. But it is a striking thing that in the same decades, in the same Christian Europe, one kind of map put Jerusalem at the centre of a round world and another put Messina within a few kilometres of its neighbours. The difference is who made them and what for: the portolan charts were sailors’ tools, and the sea they knew best is the sea they drew best.
How I did this
I read every place by eye on the public domain scans: 55 directly on the Pisana scan, 93 on Jomard’s facsimile carried back to the scan by a thin plate spline, and 201 on the four chart panels of the Catalan Atlas, joined where the scans of two panels draw the same stretch of coast twice. I typed each true position and checked it against the Natural Earth coastline. For each chart I fitted a similarity (one scale, one turn, one shift) and an affine transformation on three projections, measured every error on the globe, refitted each sea with at least eight places on its own, predicted each place from its eight nearest neighbours, and compared the direction between every pair of places. The distortion grids are smoothed thin plate splines through the same points. On the interactive page you can click any name to see the true place, slide the true coast onto each chart and back, and switch the grids, arrows and a modern map on and off.
The caveats matter. The places are the ones I could read and identify, which favours big harbours and clear headlands; the Pisana’s Black Sea is thin, with only 3 places; my readings have not been checked by anyone else, and 86 Pisana and 76 Catalan readings are flagged as uncertain in position or name. The scans are photographs of shrunken, folded parchment, and the Catalan scans I used are at half size. None of this changes the broad picture, but the exact numbers would move with another reader.
Notes and sources
- Carta Pisana, about 1275, Bibliothèque nationale de France, Cartes et plans GE B-1118: public domain scan on Wikimedia Commons; E. F. Jomard’s facsimile from Les monuments de la géographie (1842 to 1862), public domain, used only to help read the names.
- Catalan Atlas, 1375, Bibliothèque nationale de France, Espagnol 30: public domain scans of the panels on Wikimedia Commons.
- Coastlines and countries: Natural Earth (public domain). Comparisons: my studies of Ptolemy’s Geography, al-Idrisi’s map and the Hereford Mappa Mundi.
- Background reading: Tony Campbell, Portolan charts from the late thirteenth century to 1500, in The History of Cartography, Volume One (1987); Jonathan T. Lanman, On the Origin of Portolan Charts (1987); Ramon J. Pujades i Bataller, Les cartes portolanes (2007); Roel Nicolai, The Enigma of the Origin of Portolan Charts (2016).
- Update: this version doubles the Catalan Atlas readings to 201 and corrects how two of its panels were joined, so the Catalan figures changed (its median miss is now 88 km rather than 119 km); the Carta Pisana results are unchanged.
- I wrote the text, with drafting and editing assistance from Claude (Anthropic), which also helped prepare the analysis code. I reviewed and checked all text and results.


