
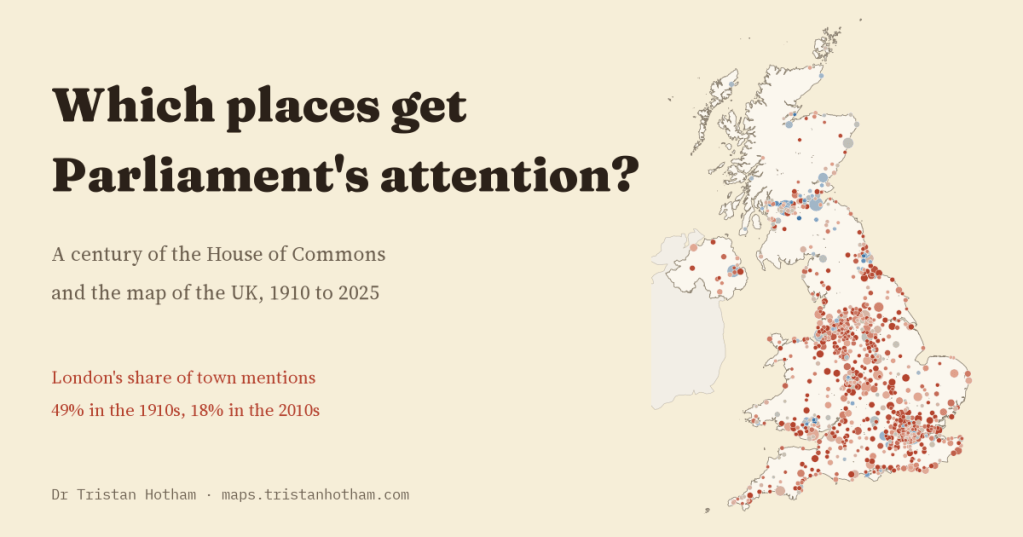
Which parts of the country does Parliament talk about? In four earlier studies I counted Commons mentions of UK towns, each from a different angle. Here I put them together and take the long view: a century of Hansard, 1,596 towns and cities, and one question. What decides a place’s share of Parliament’s attention?
Every day in the House of Commons, somebody stands up and names a place. A member asks about the hospital in their town, a minister announces money for a city, a debate returns to a coalfield, a port or the scene of a disaster. Which places get named, and which never do, is a small but real part of what it means for a part of the country to be represented.
I have looked at this four times already. The first study counted how often MPs said “in” plus the name of one of 1,661 UK towns, every year since 1909. The second compared that with what the public reads about on Wikipedia. The third asked what a by-election does to a town’s share of debate, and the fourth what a disaster does. This time I put all four on the same monthly counts, from 1910 to 2025, and asked the bigger questions they share.
From London to everywhere
In the 1910s, London alone took 49.1% of every Commons mention of a UK town or city. The ten most mentioned places took 78%, and Belfast, in the years of the Home Rule crisis, came second. A century later the picture is very different. In the 2010s London’s share was 18.3% and the top ten’s 35%. The number of places mentioned at least once in a decade rose from 360 to 1,318.
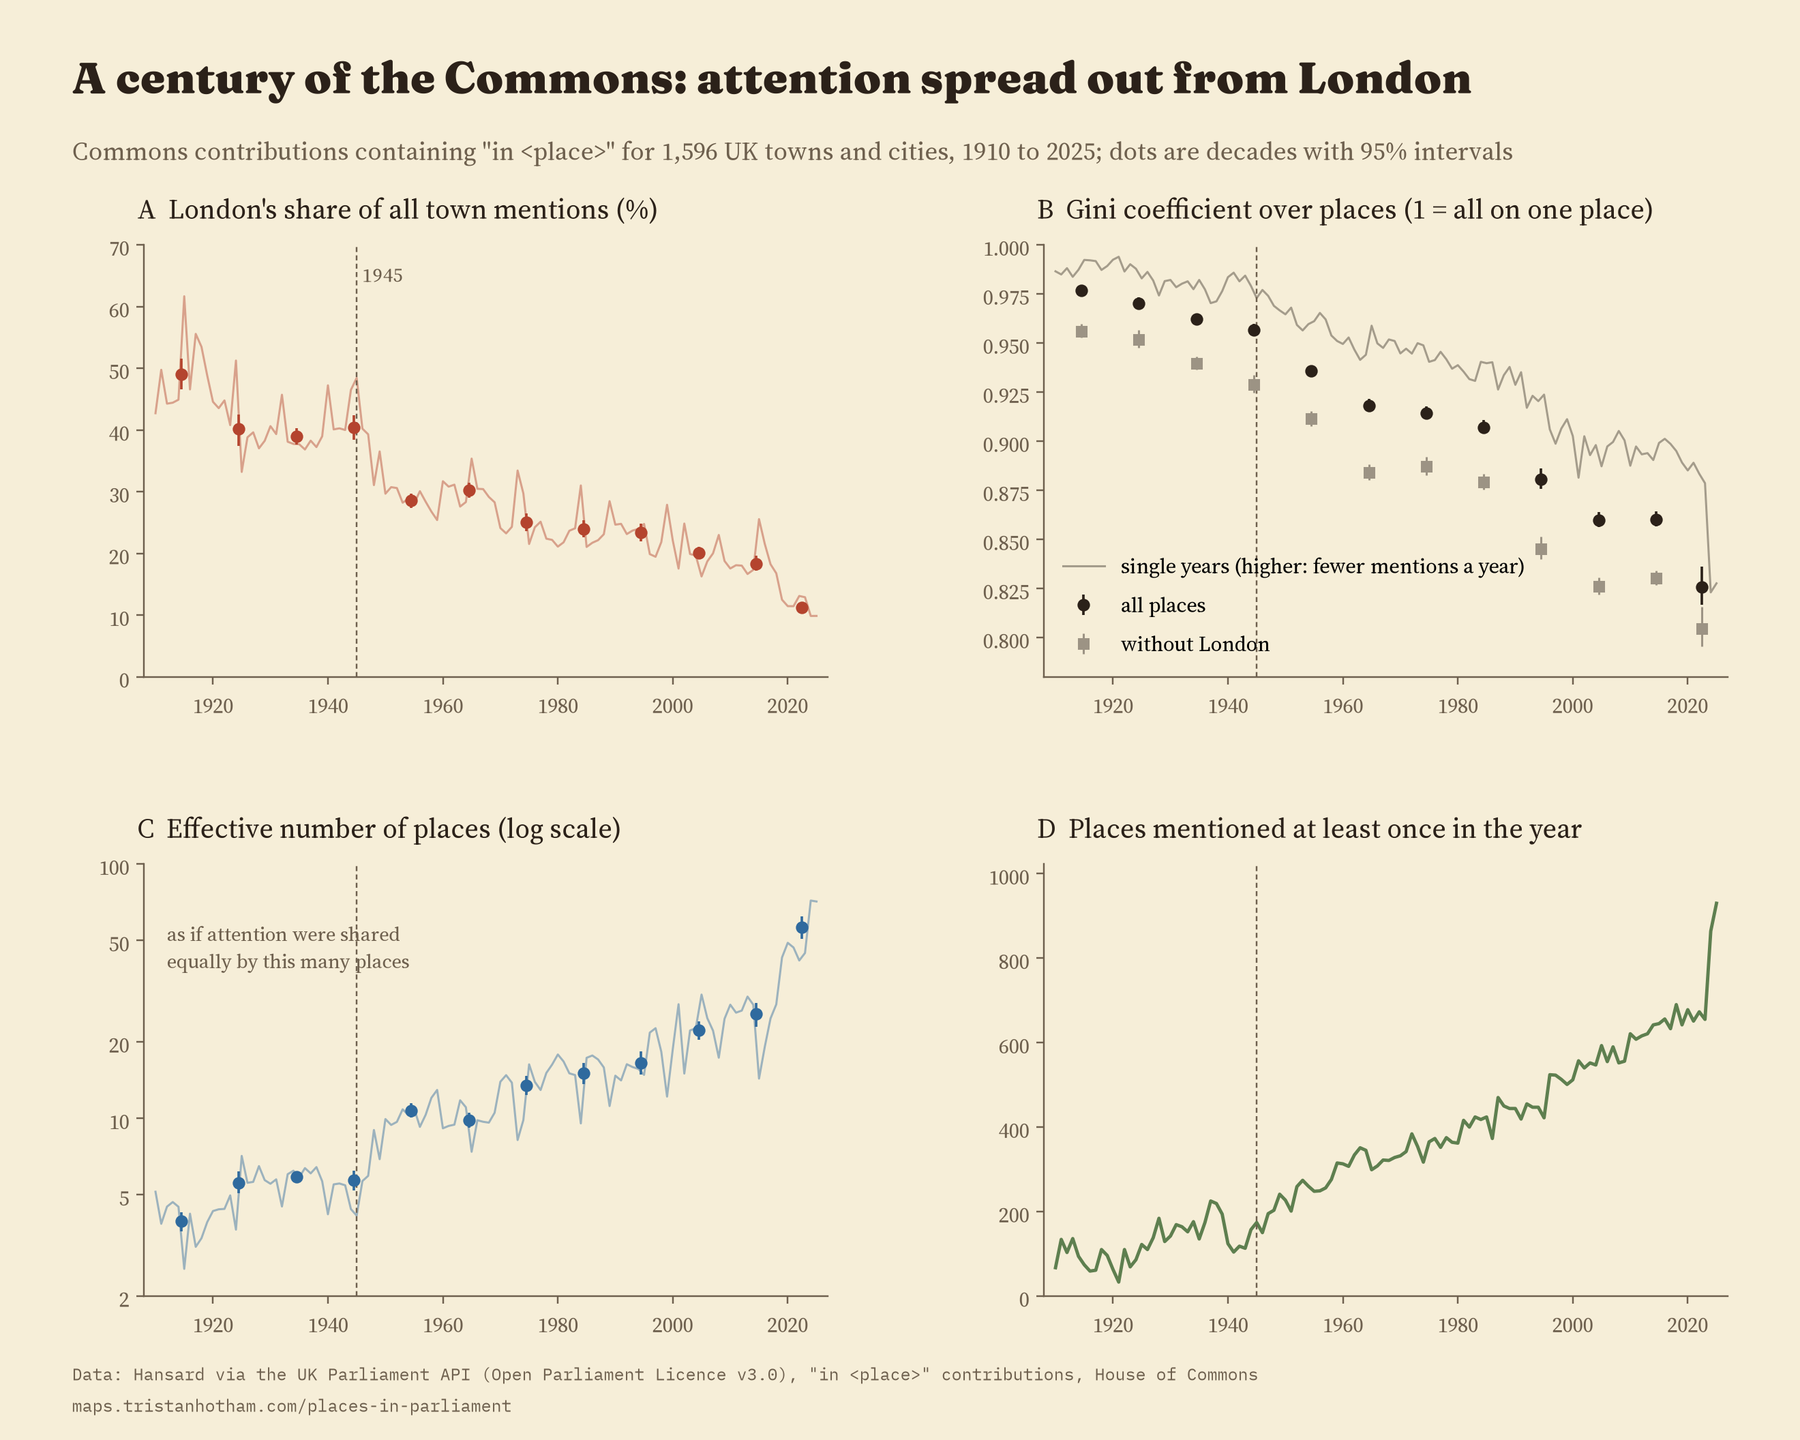
One way to picture this: if Parliament’s attention had been shared out equally, the 1910s pattern would be like talking about only 4 places. By the 2010s it was like talking about 26. The change sped up after 1945. Measured by the Gini coefficient, the usual yardstick for how unequal a share is, concentration fell about 3.4 times faster per decade after the war than before it. London’s own share fell at a similar pace in both periods, so the post-war change is mostly about many more towns joining the conversation, not about London dropping faster.
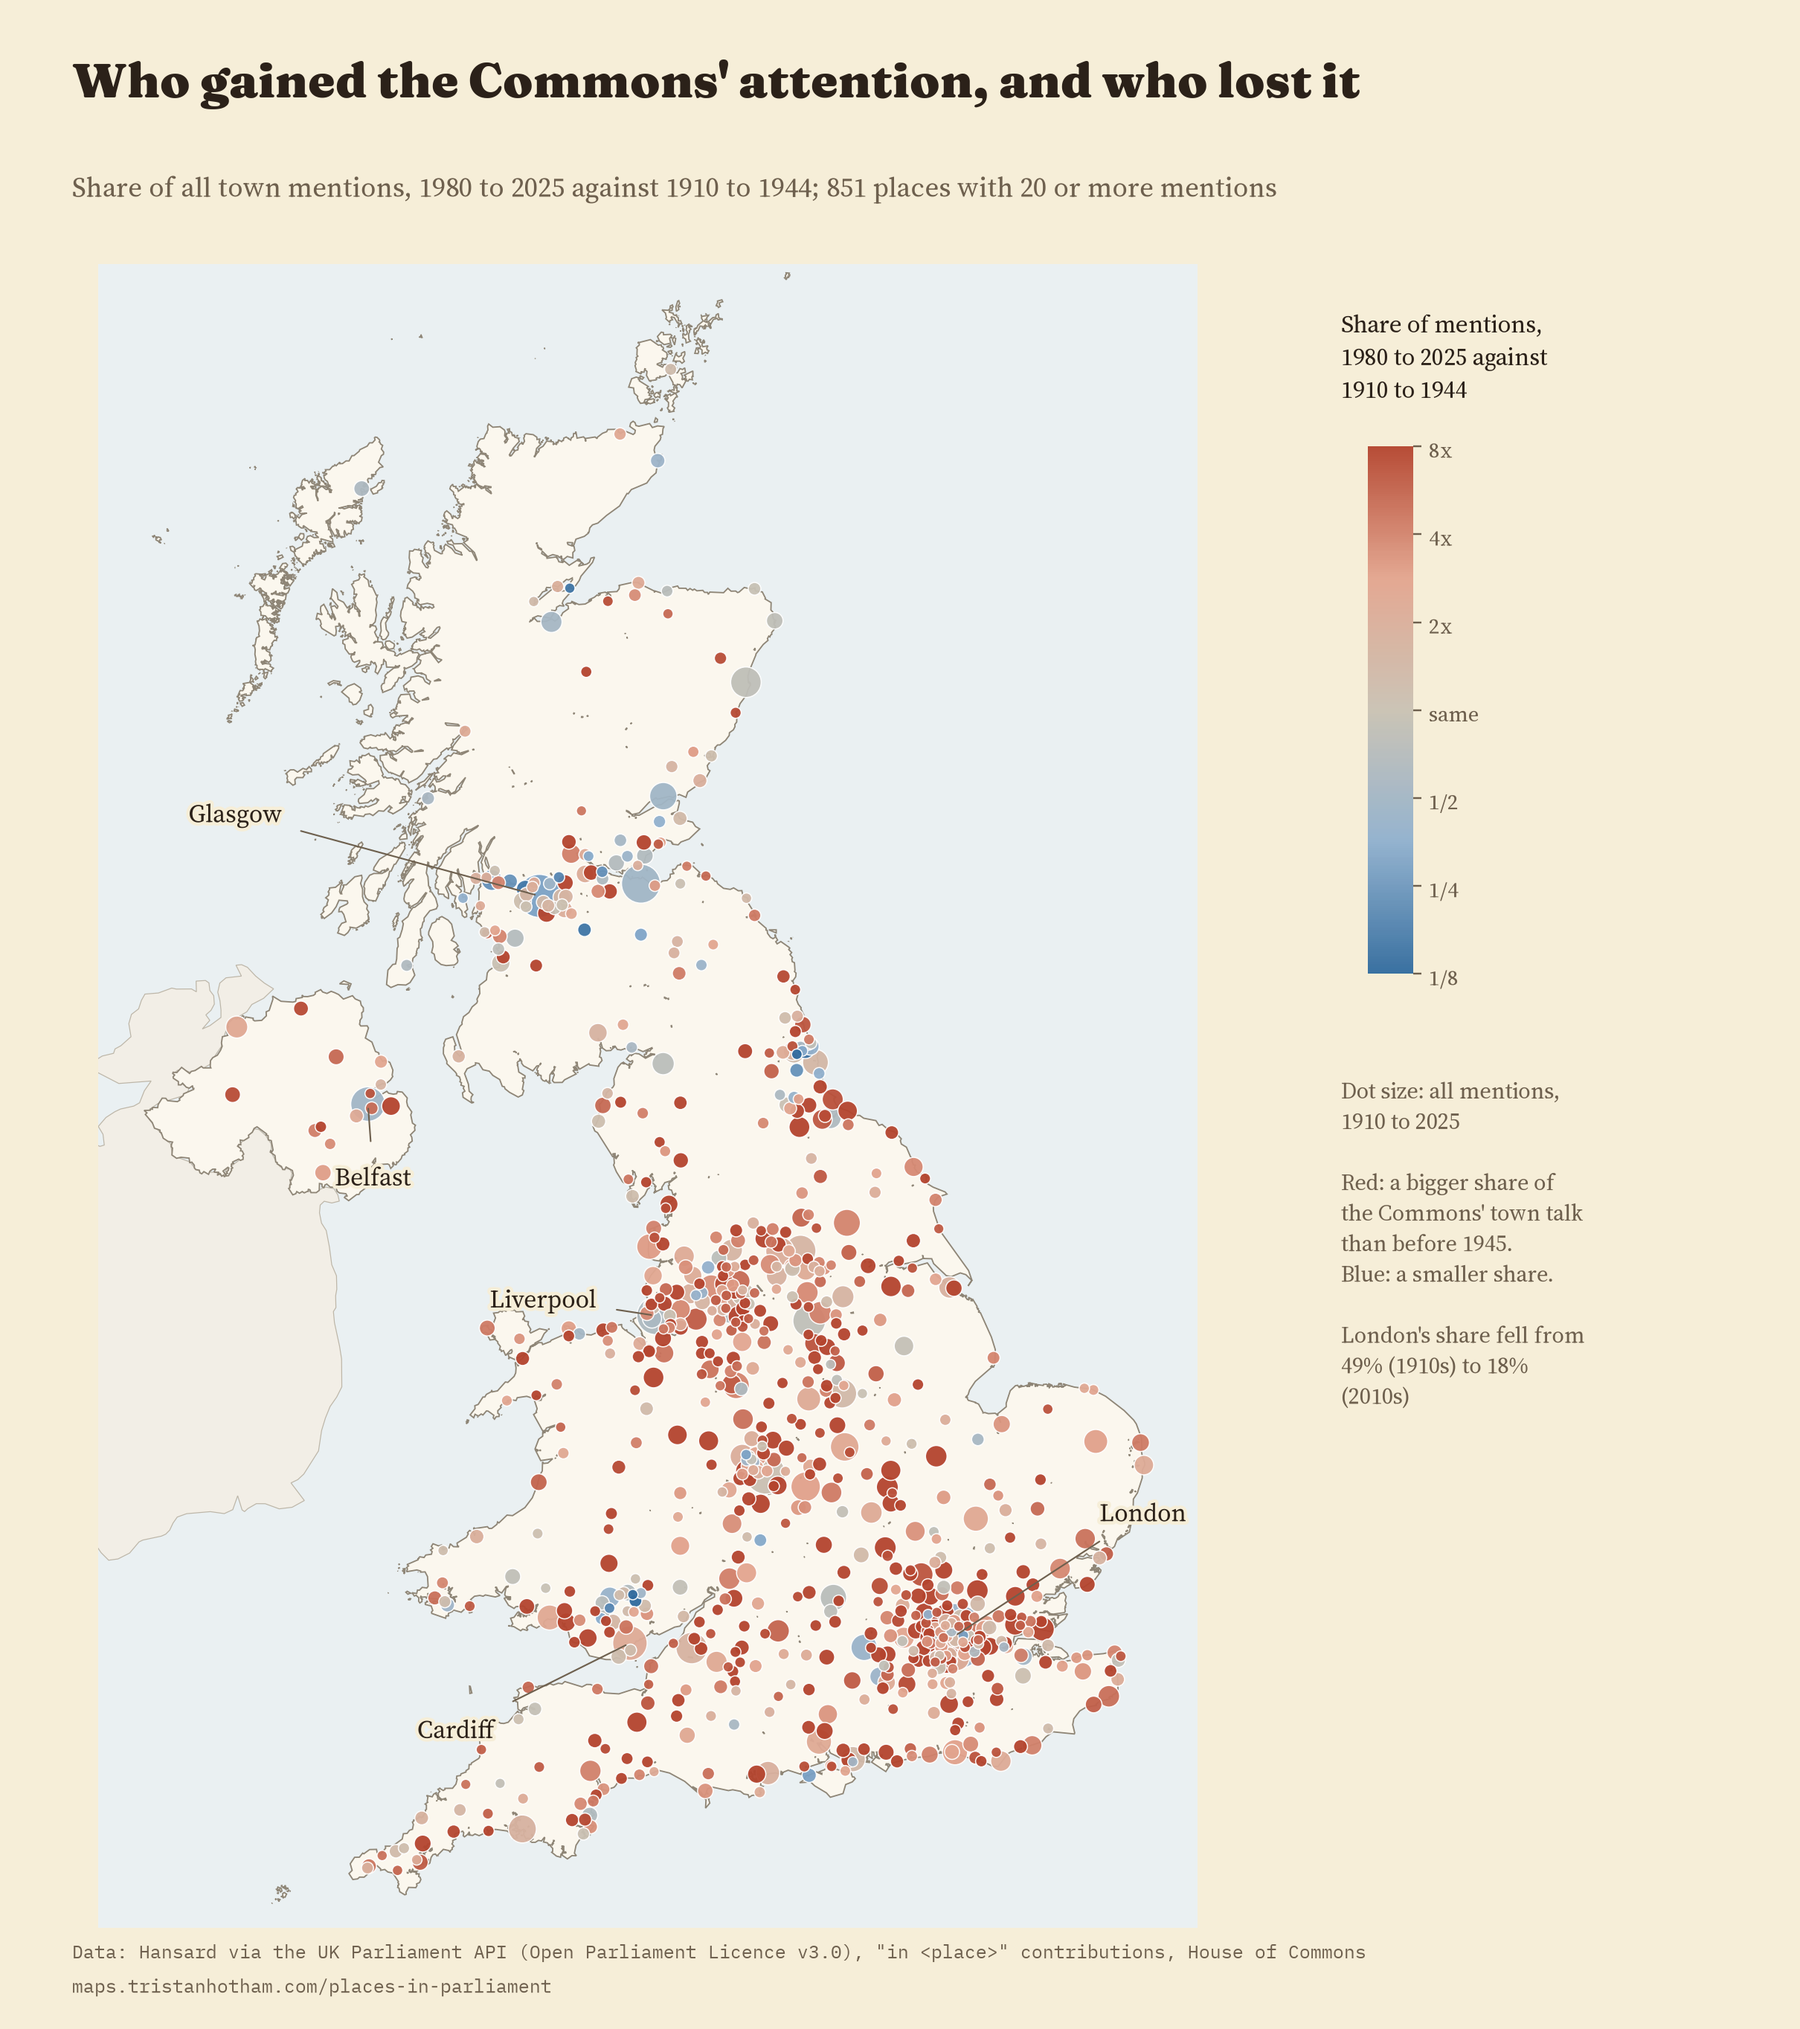
The map shows who gained. Of the 851 places mentioned at least 20 times, 738 took a bigger share of the Commons’ town talk after 1980 than before 1945. The places that lost ground are mostly the great cities of the early century, and towns that were at the centre of interwar debate, like Jarrow and Clydebank.
Size, interest and the electoral map
So what decides who gets mentioned now? For 2005 to 2025 I can compare 1,425 places on their size, how much the public reads about them on Wikipedia, whether their name is part of a Commons seat, where they are and whether a by-election or disaster happened there. Together these account for most of the differences between places. Size and public interest explain about the same amount (39% and 38% of what is explained), the electoral map 15%, and geography and recent shocks only a little.
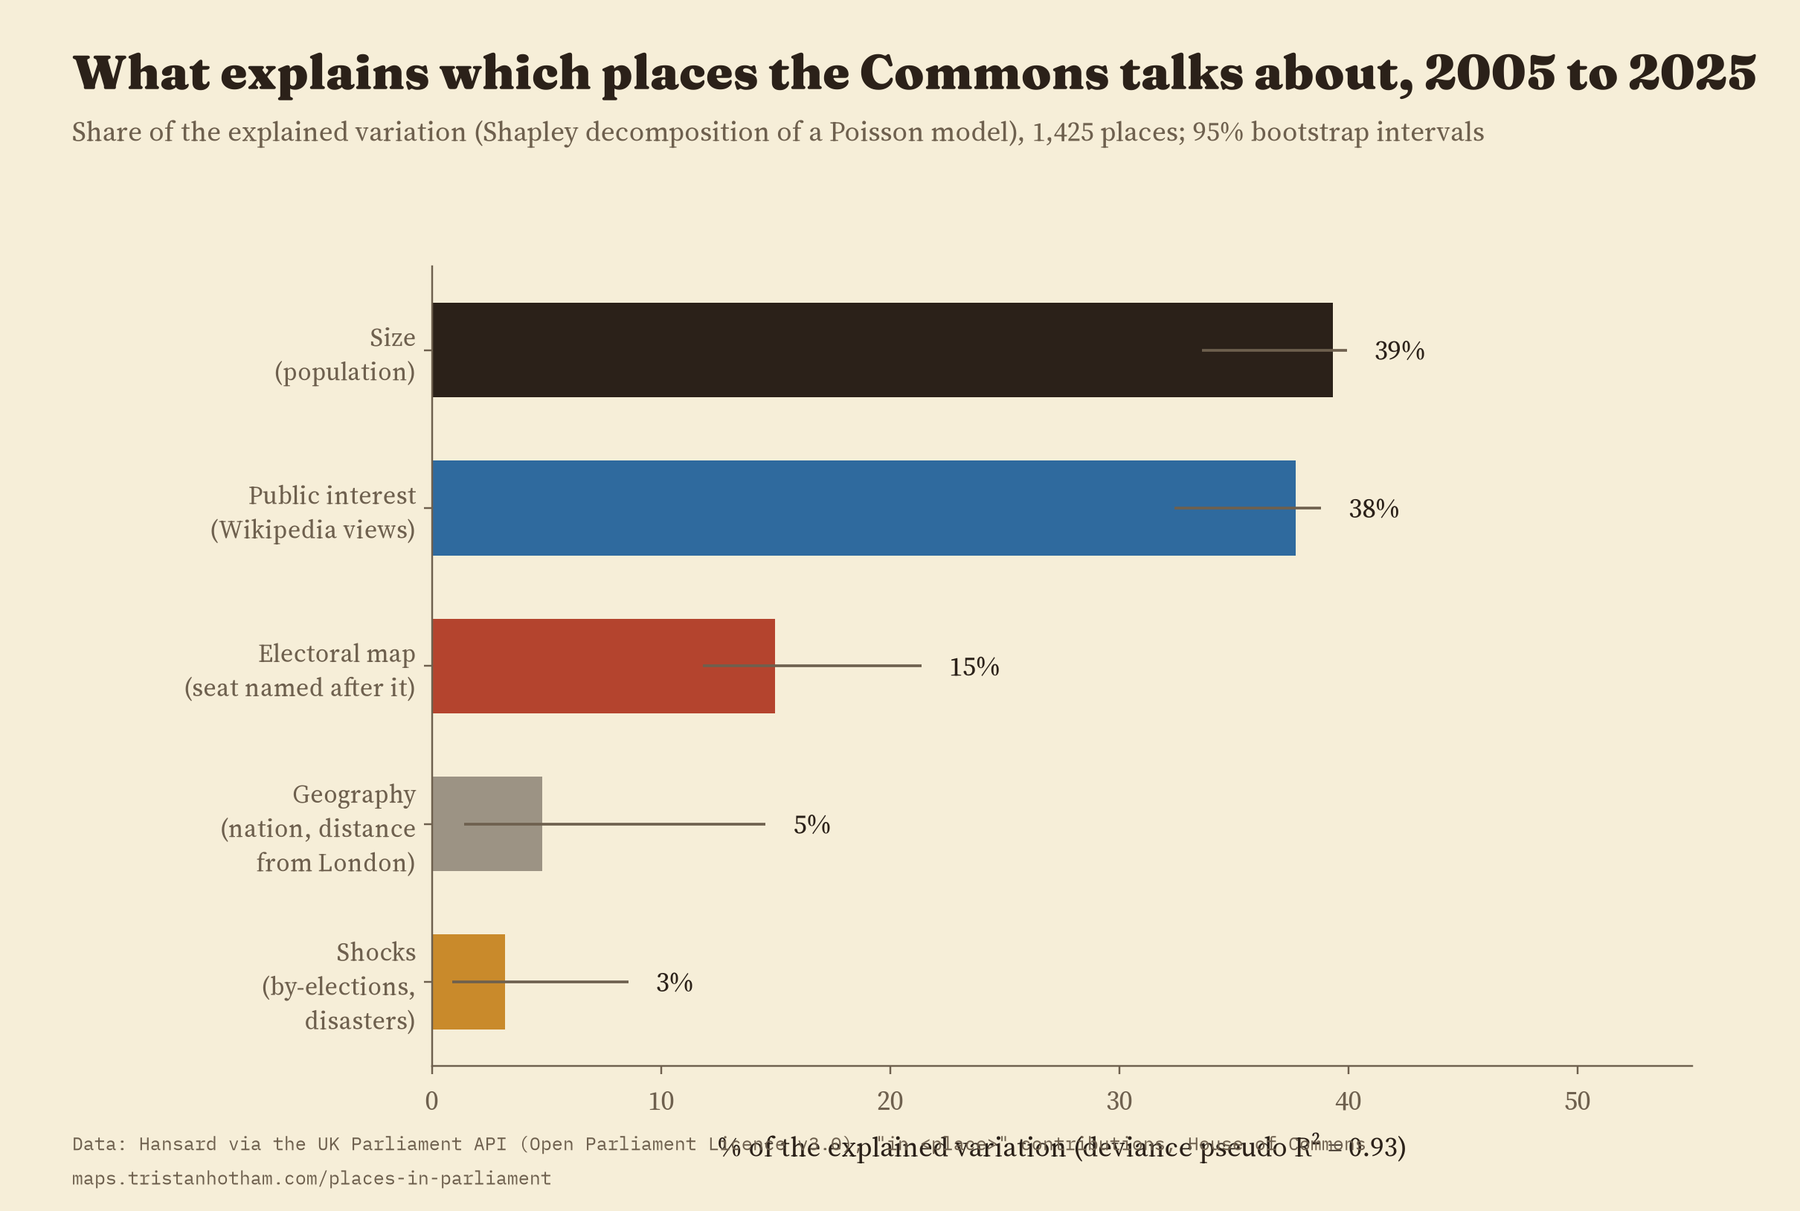
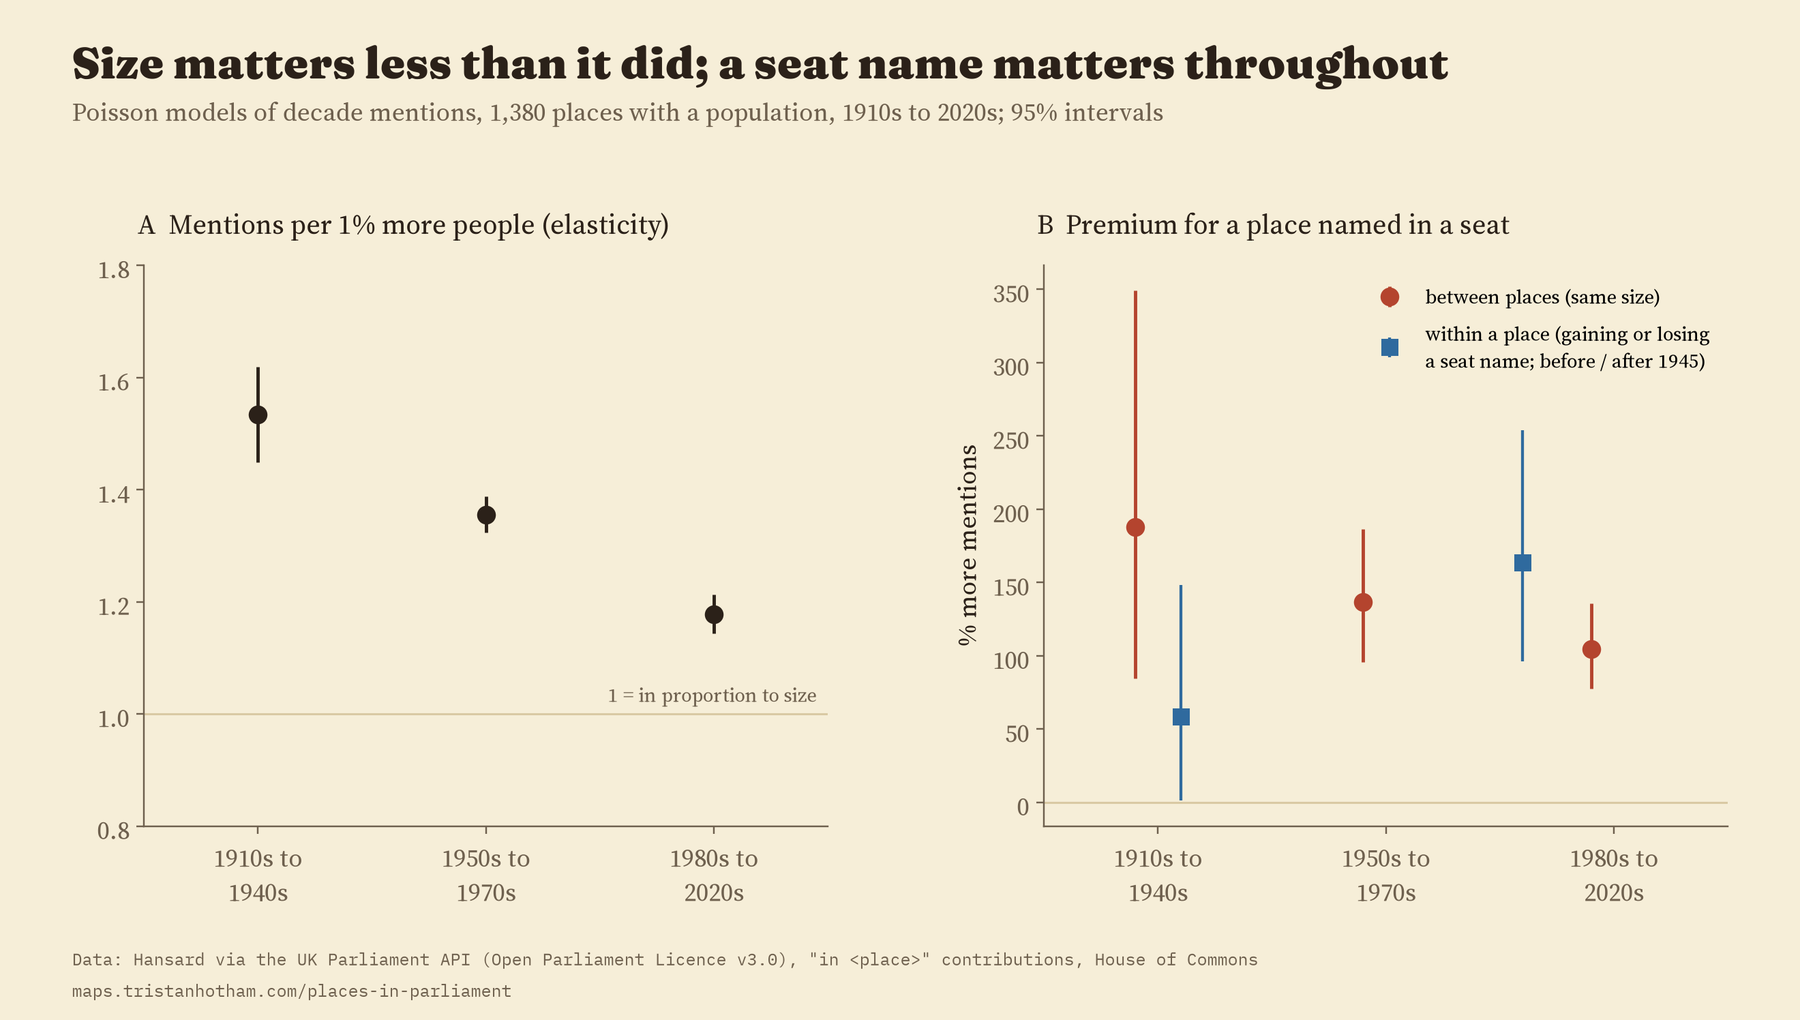
A place whose name is on a Commons seat has been mentioned more than a place of the same size in every era since 1910.
The electoral map has mattered for the whole century. Using the seat names at every general election since 1910, places named in a seat were mentioned 188% more than similar places before 1950, 137% more from 1950 to 1979 and 105% more since 1980. I expected that premium to grow after 1945, as members became more focused on their constituencies. It did not. What did change is the pull of size: before 1950, a town 1% bigger got about 1.5% more mentions; since 1980, about 1.2%. Big places still get more than their size alone would suggest, just less so than before.
Where a place stands is mostly about the place
Here is the result I find most striking. Take every place and every year from 1910 to 2025 and split the ups and downs of yearly mentions into parts. 53% is simply the place: its long-run level, the same in every decade. Another 18% is slow change, a place rising or falling over decades. The decade itself, which affects every place alike, is 7%, and year-to-year bursts within a decade 21%. By-elections and disasters, for all their drama, come to 0.05%.
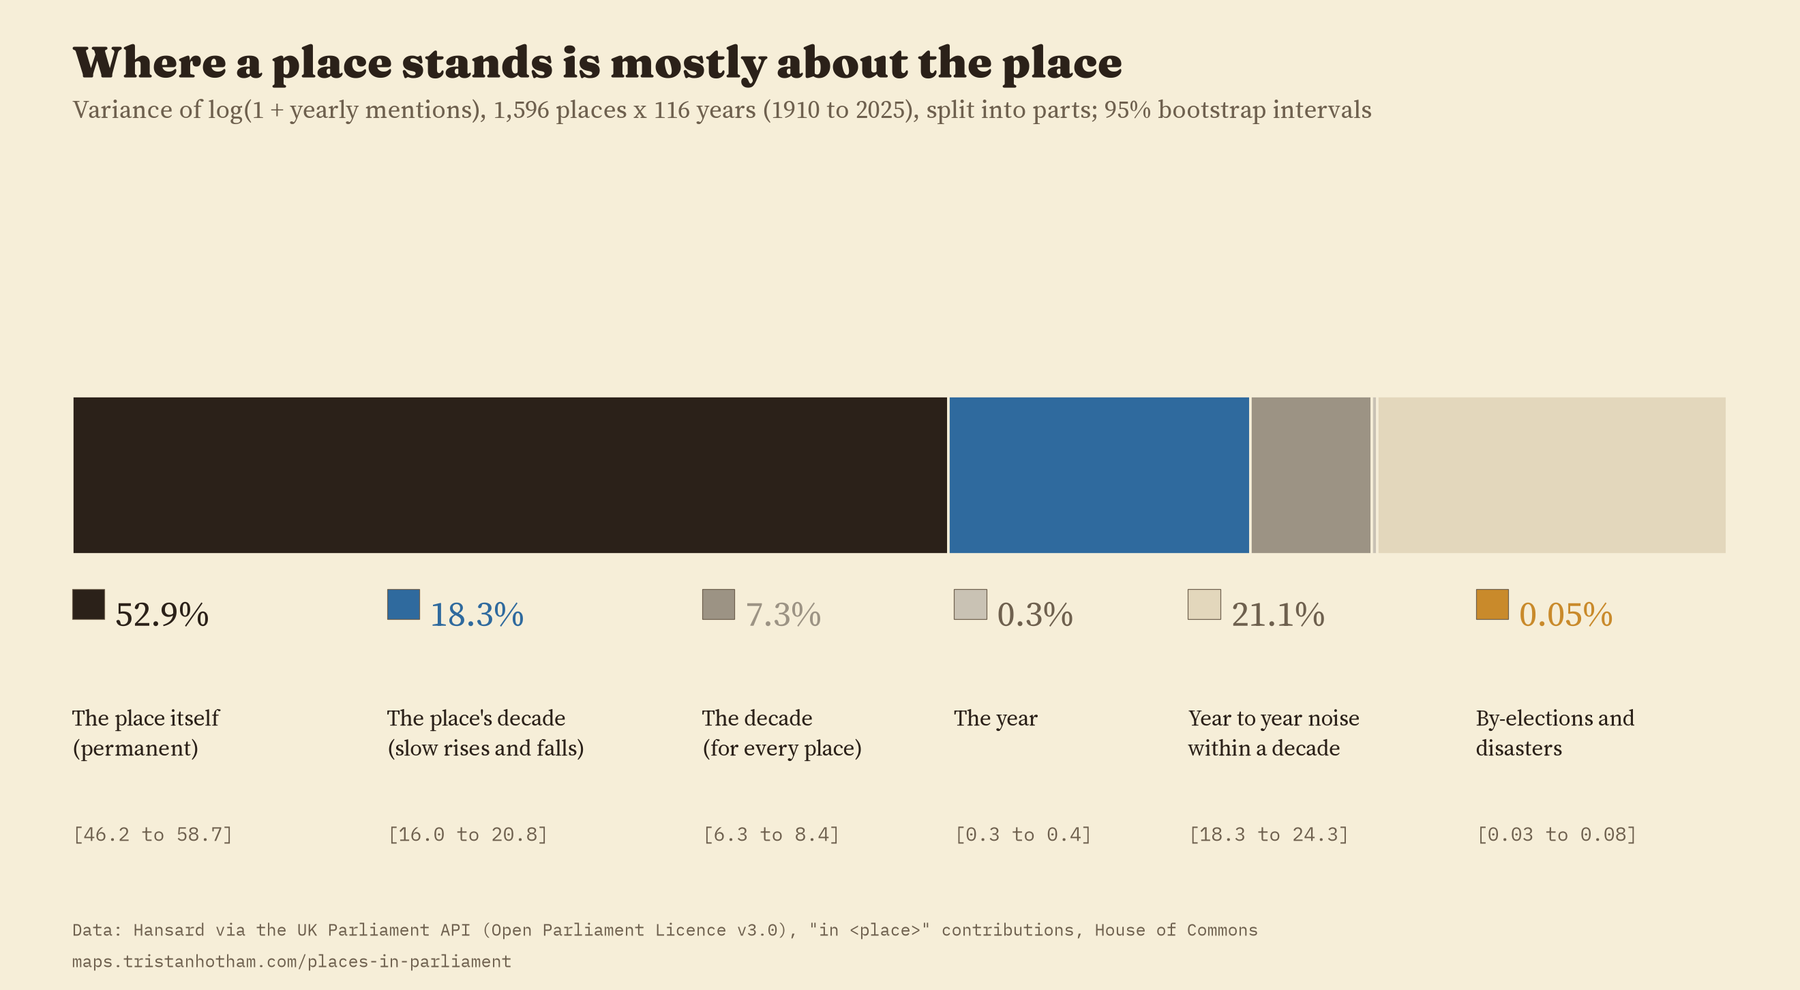
That does not mean shocks do nothing. They are rare, and when they happen they matter: in a by-election year a town is mentioned about 18% more than its own decade would suggest, in a disaster year about 27% more. But they rarely move a place’s standing for good.
By-elections and disasters, side by side
The two earlier studies of shocks used different methods, so I ran both through exactly the same design: each town compared with five similar towns, month by month, from two years before to three years after. Both make a town’s name jump. In the polling month and the two after, by-election towns were mentioned 3.9 times as often as their matched towns. In the month of a disaster and the two after, 3.5 times.
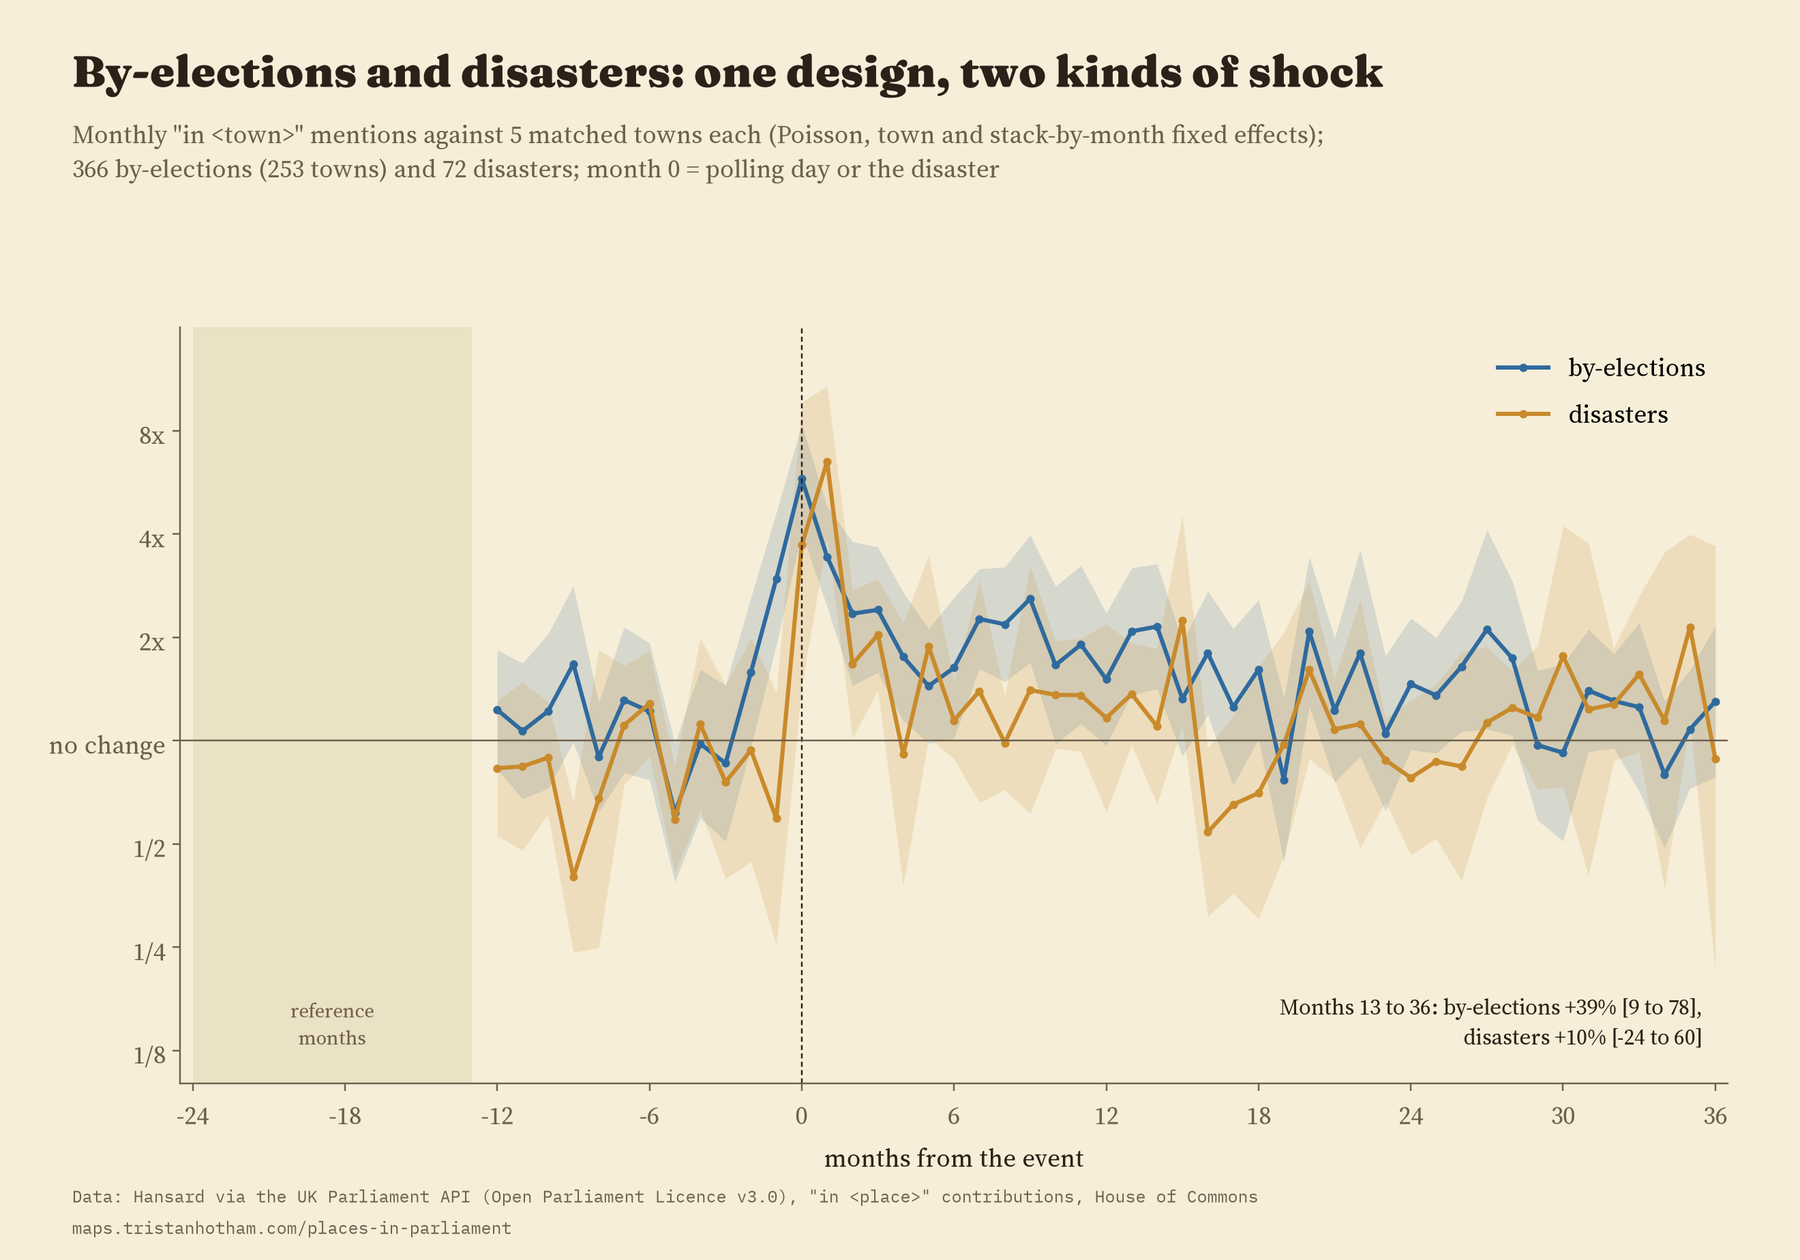
Disaster attention fades faster in the first year. Two to three years on, by-election towns were still 39% above their matched towns and disaster towns 10%, but the difference between those two is within the noise, and it depends on how I tie a disaster to a town (a colliery or a crash site is often not a town on my list). What seems to last is change: by-elections where the seat changed hands, and disasters with 50 or more deaths, left the longest traces. Those groups are small, so I treat that as a pointer rather than a finding.
How I did this
Hansard’s search tells you how many Commons speeches in a month contain a phrase. I used “in” plus the place name, which avoids the “hon. Member for” formula and people’s surnames, for the town list of the first study, leaving out names that are ambiguous (Newport, Durham, Boston). Checking the most mentioned places again turned up one more: “in Erskine” is nearly always “in Erskine May”, Parliament’s rule book, so it is out. I wrote the analysis plan down before running any model, and the paper reports every planned test, including the ones that did not come out as I expected.
There are limits. “In” plus a name is a sample of mentions, and the counts say nothing about who spoke or what they said. The town list is today’s, so Irish towns before 1922 are missing and populations are modern. The 2020s are only six years, and the number of places mentioned jumps so sharply in 2024 and 2025 that I would want to check it before reading much into it. Everything here describes patterns; it does not prove what causes them.
On the interactive page you can search for any of the 1,596 places and see how often MPs mentioned it, every month since 1909, with its by-elections and nearby disasters marked.
Notes and sources
- Hansard, House of Commons, monthly counts from the UK Parliament Hansard API. Contains Parliamentary information licensed under the Open Parliament Licence v3.0.
- The four earlier studies: Mentioned in the House, Who gets talked about?, Do by-elections make Parliament listen? and the disasters study (Hotham 2026). Seat names from Who Won Here?
- Wikipedia lists of UK by-elections and disasters (CC BY-SA 4.0); Wikipedia pageviews and Wikidata (CC0). Base map on the interactive page: OpenFreeMap, OpenStreetMap contributors (ODbL).
- Further reading: P. Norton, “The growth of the constituency role of the MP”, Parliamentary Affairs (1994); B. Jones and F. Baumgartner, The Politics of Attention (2005); A. Rodríguez-Pose, “The revenge of the places that don’t matter” (2018).
- I wrote the text, with drafting and editing assistance from Claude (Anthropic), which also helped prepare the analysis code. I reviewed and checked all text and results.

