
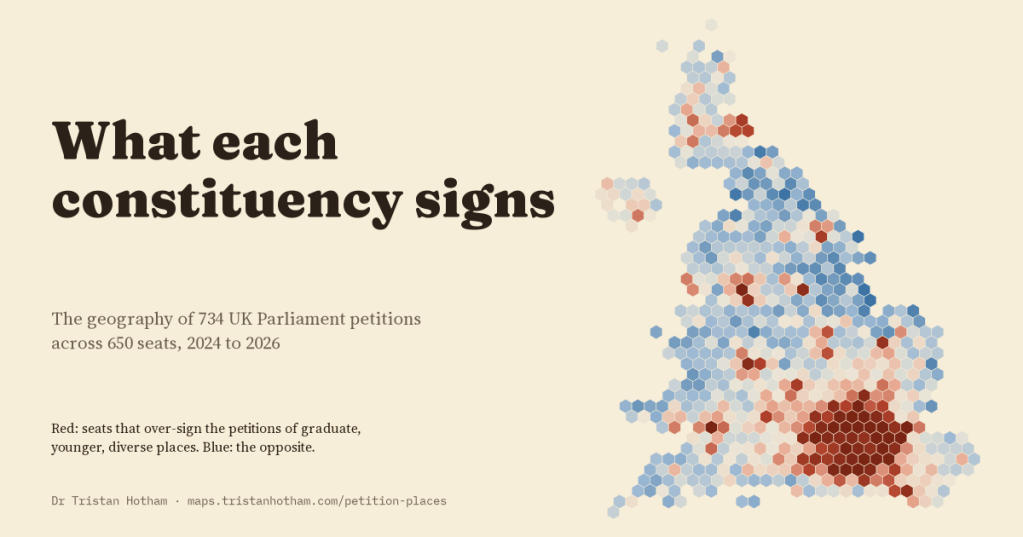
Every time you sign a UK Parliament petition, you give a postcode, and the site counts your signature in your constituency. That quietly turns every petition into a map. I put 734 of those maps side by side to see what each part of the country signs more than the rest.
The petitions site is a busy door into Parliament. Since the 2024 election people have started 17,201 petitions, and 9,057 of them were rejected before they ever went live. Petitions that reach 10,000 signatures get a government response, and those that reach 100,000 are considered for a debate. They cover everything: fireworks, farm taxes, rare diseases, school attendance fines, rail lines, Gaza, the personal allowance, dogs in laboratories.
I took the 734 petitions that had passed about 3,000 signatures, 30,882,864 signatures between them, and for every one of the 650 constituencies asked a simple question. Of all the petition signatures from this seat, what share went to this petition, and is that more or less than the country as a whole? A seat that signs a petition at twice its usual rate scores two. Measuring each seat against itself matters, because some seats sign far more petitions than others: from 9,446 signatures in Na h-Eileanan an Iar to 65,942 in Rayleigh and Wickford.
Every petition has a map
Some petitions are everywhere. “Call a General Election”, the biggest of all with 3,084,711 signatures, looks almost the same as the overall map of petition signing: only 8% of its signatures would have to move to match it exactly. Others are very much somewhere. “Grant Cornwall nation status” was signed at 67 times the usual rate in Truro and Falmouth, and 69% of its signatures would have to move.
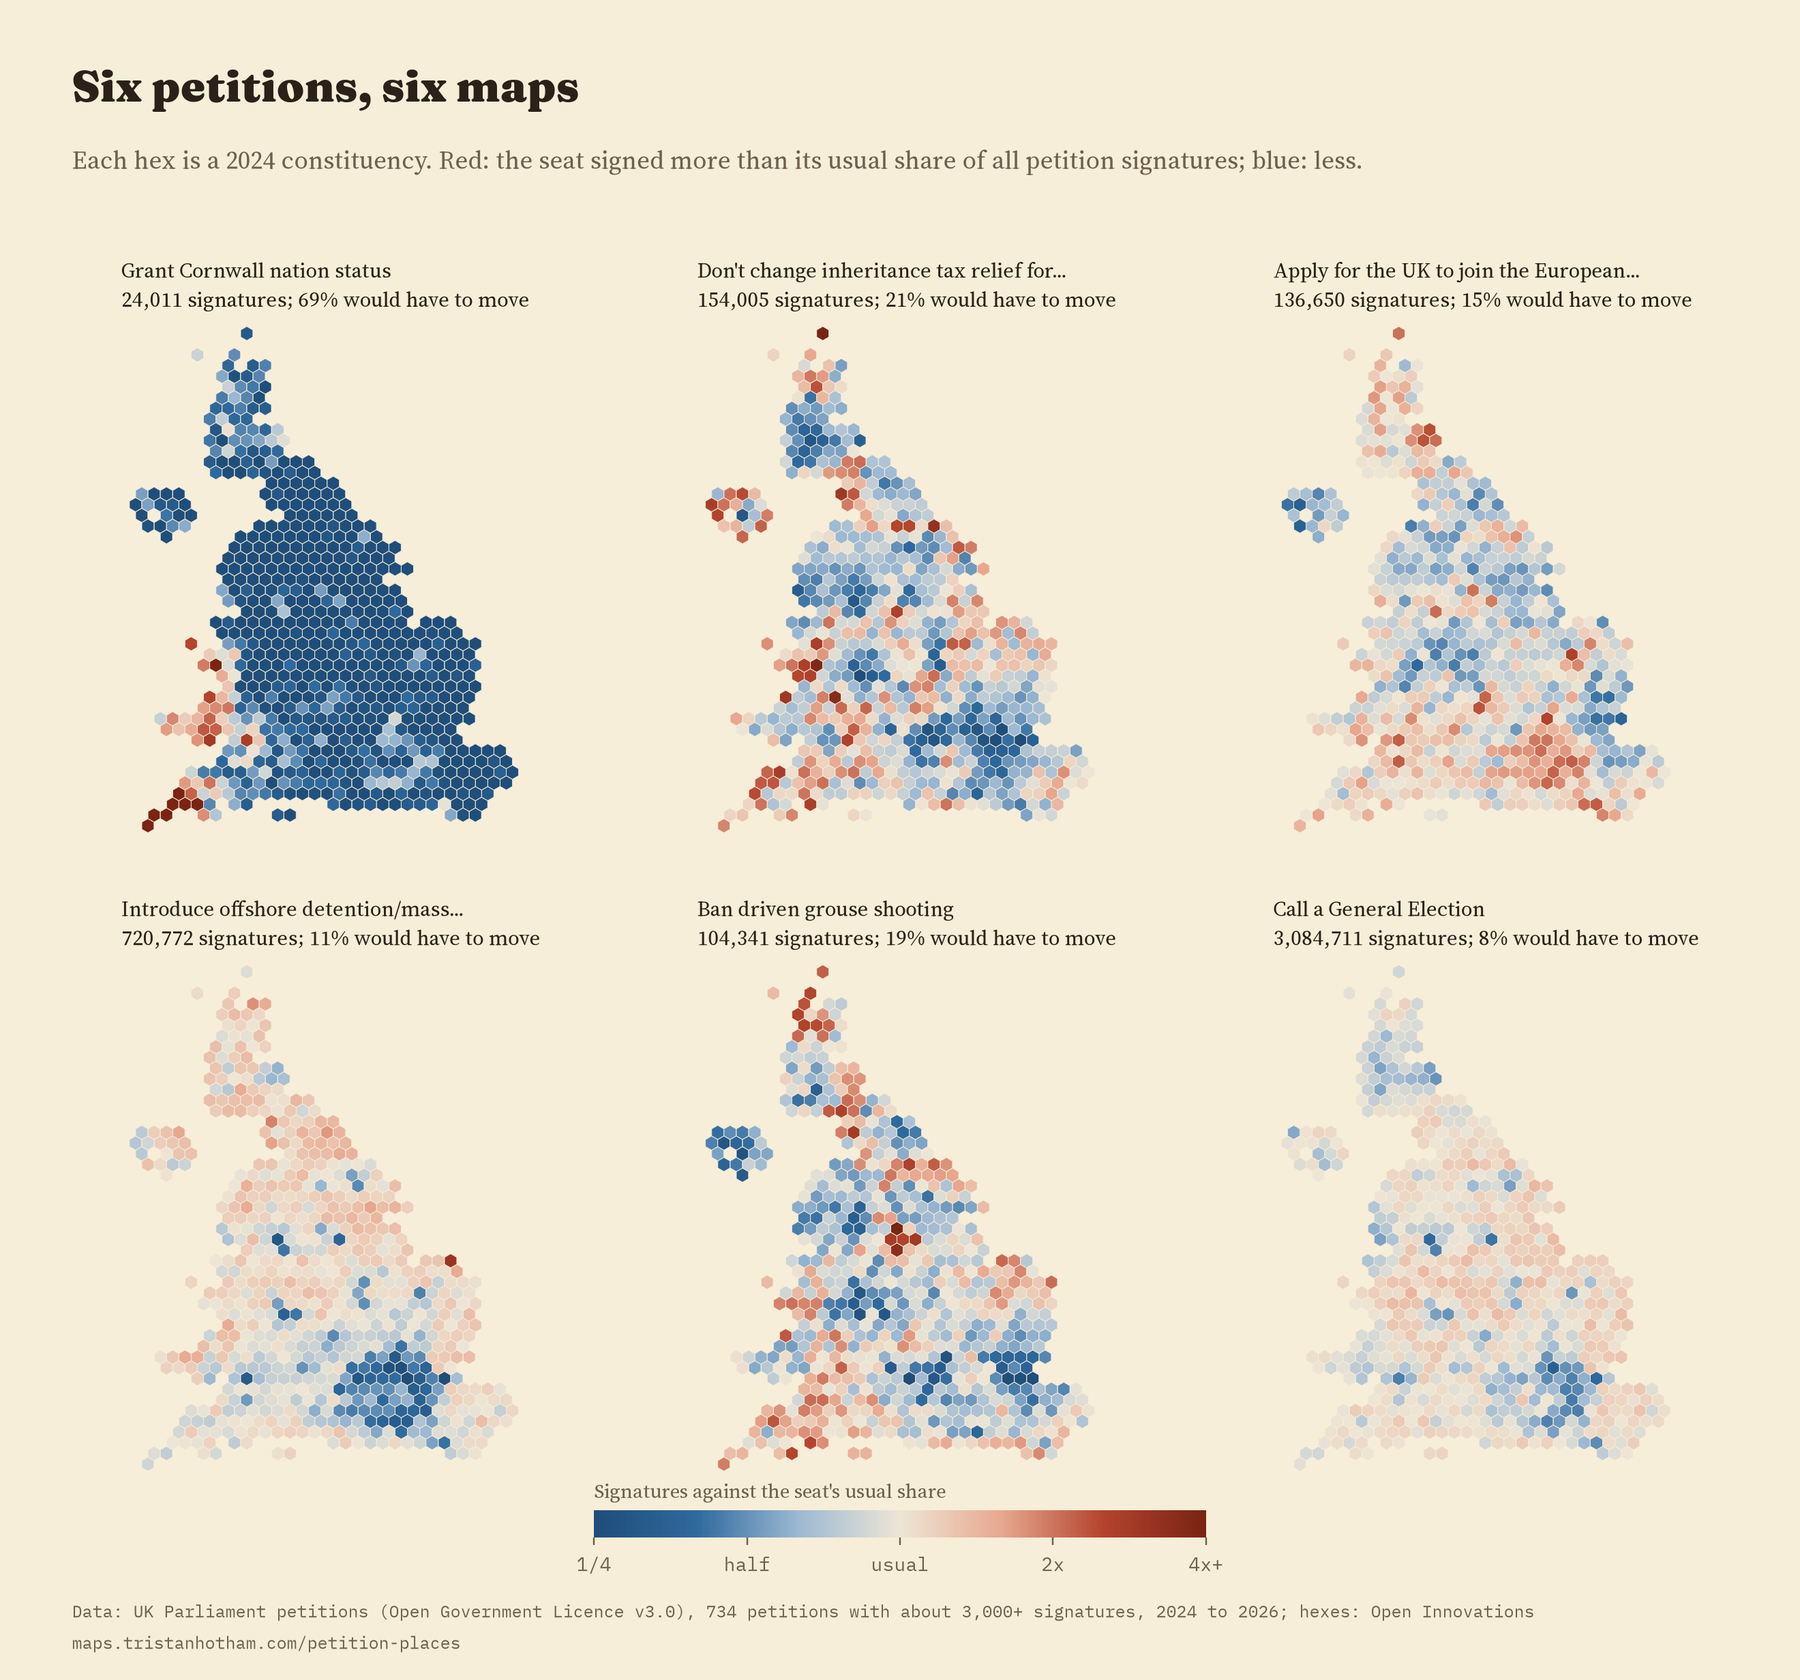
In between are petitions with clear but broad patterns. “Don’t change inheritance tax relief for working farms” was strongest in South Shropshire and North Herefordshire. “Ban driven grouse shooting” peaked in Sheffield Hallam and Derbyshire Dales, both on the edge of the Peak District. “Apply for the UK to join the European Union as a full member as soon as possible” was signed most in Cambridge and Hornsey and Friern Barnet. And every single one of the 734 maps is clustered: neighbouring seats sign alike far more than chance would allow.
Local causes are the most lopsided
Only ten petitions are about one particular part of the UK, among them Cornwall, the Scottish Parliament, the London Mayor, Northern Ireland veterans, the A1 in the North of England and the rail link between Oxford and Cambridge. Their maps are far more uneven than any other topic’s. In the typical one, 78% of signatures would have to move to match the national pattern, against 24% for everything else, and 45% of its signatures come from just ten seats. “The Government must get the East West Rail Line passenger service running ASAP” was signed at 298 times the usual rate in Buckingham and Bletchley.
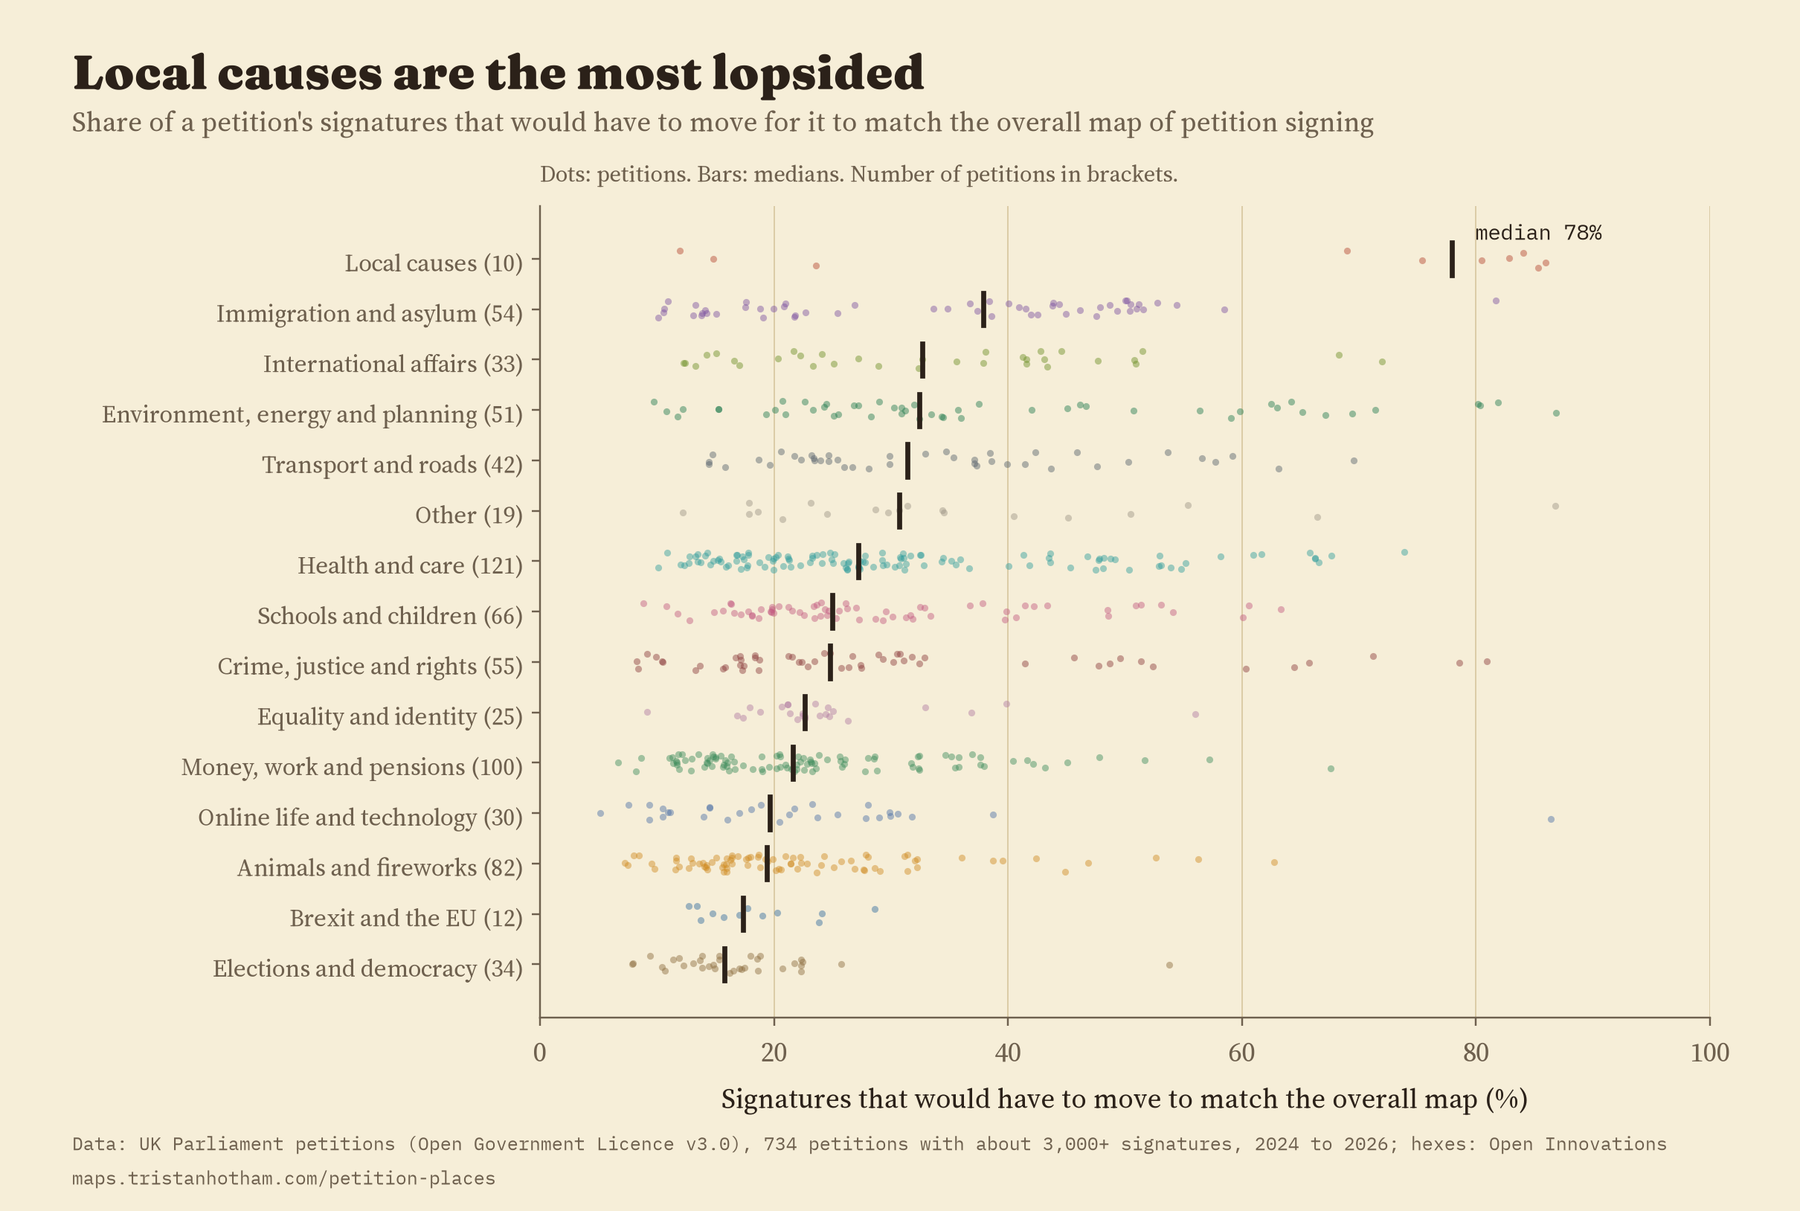
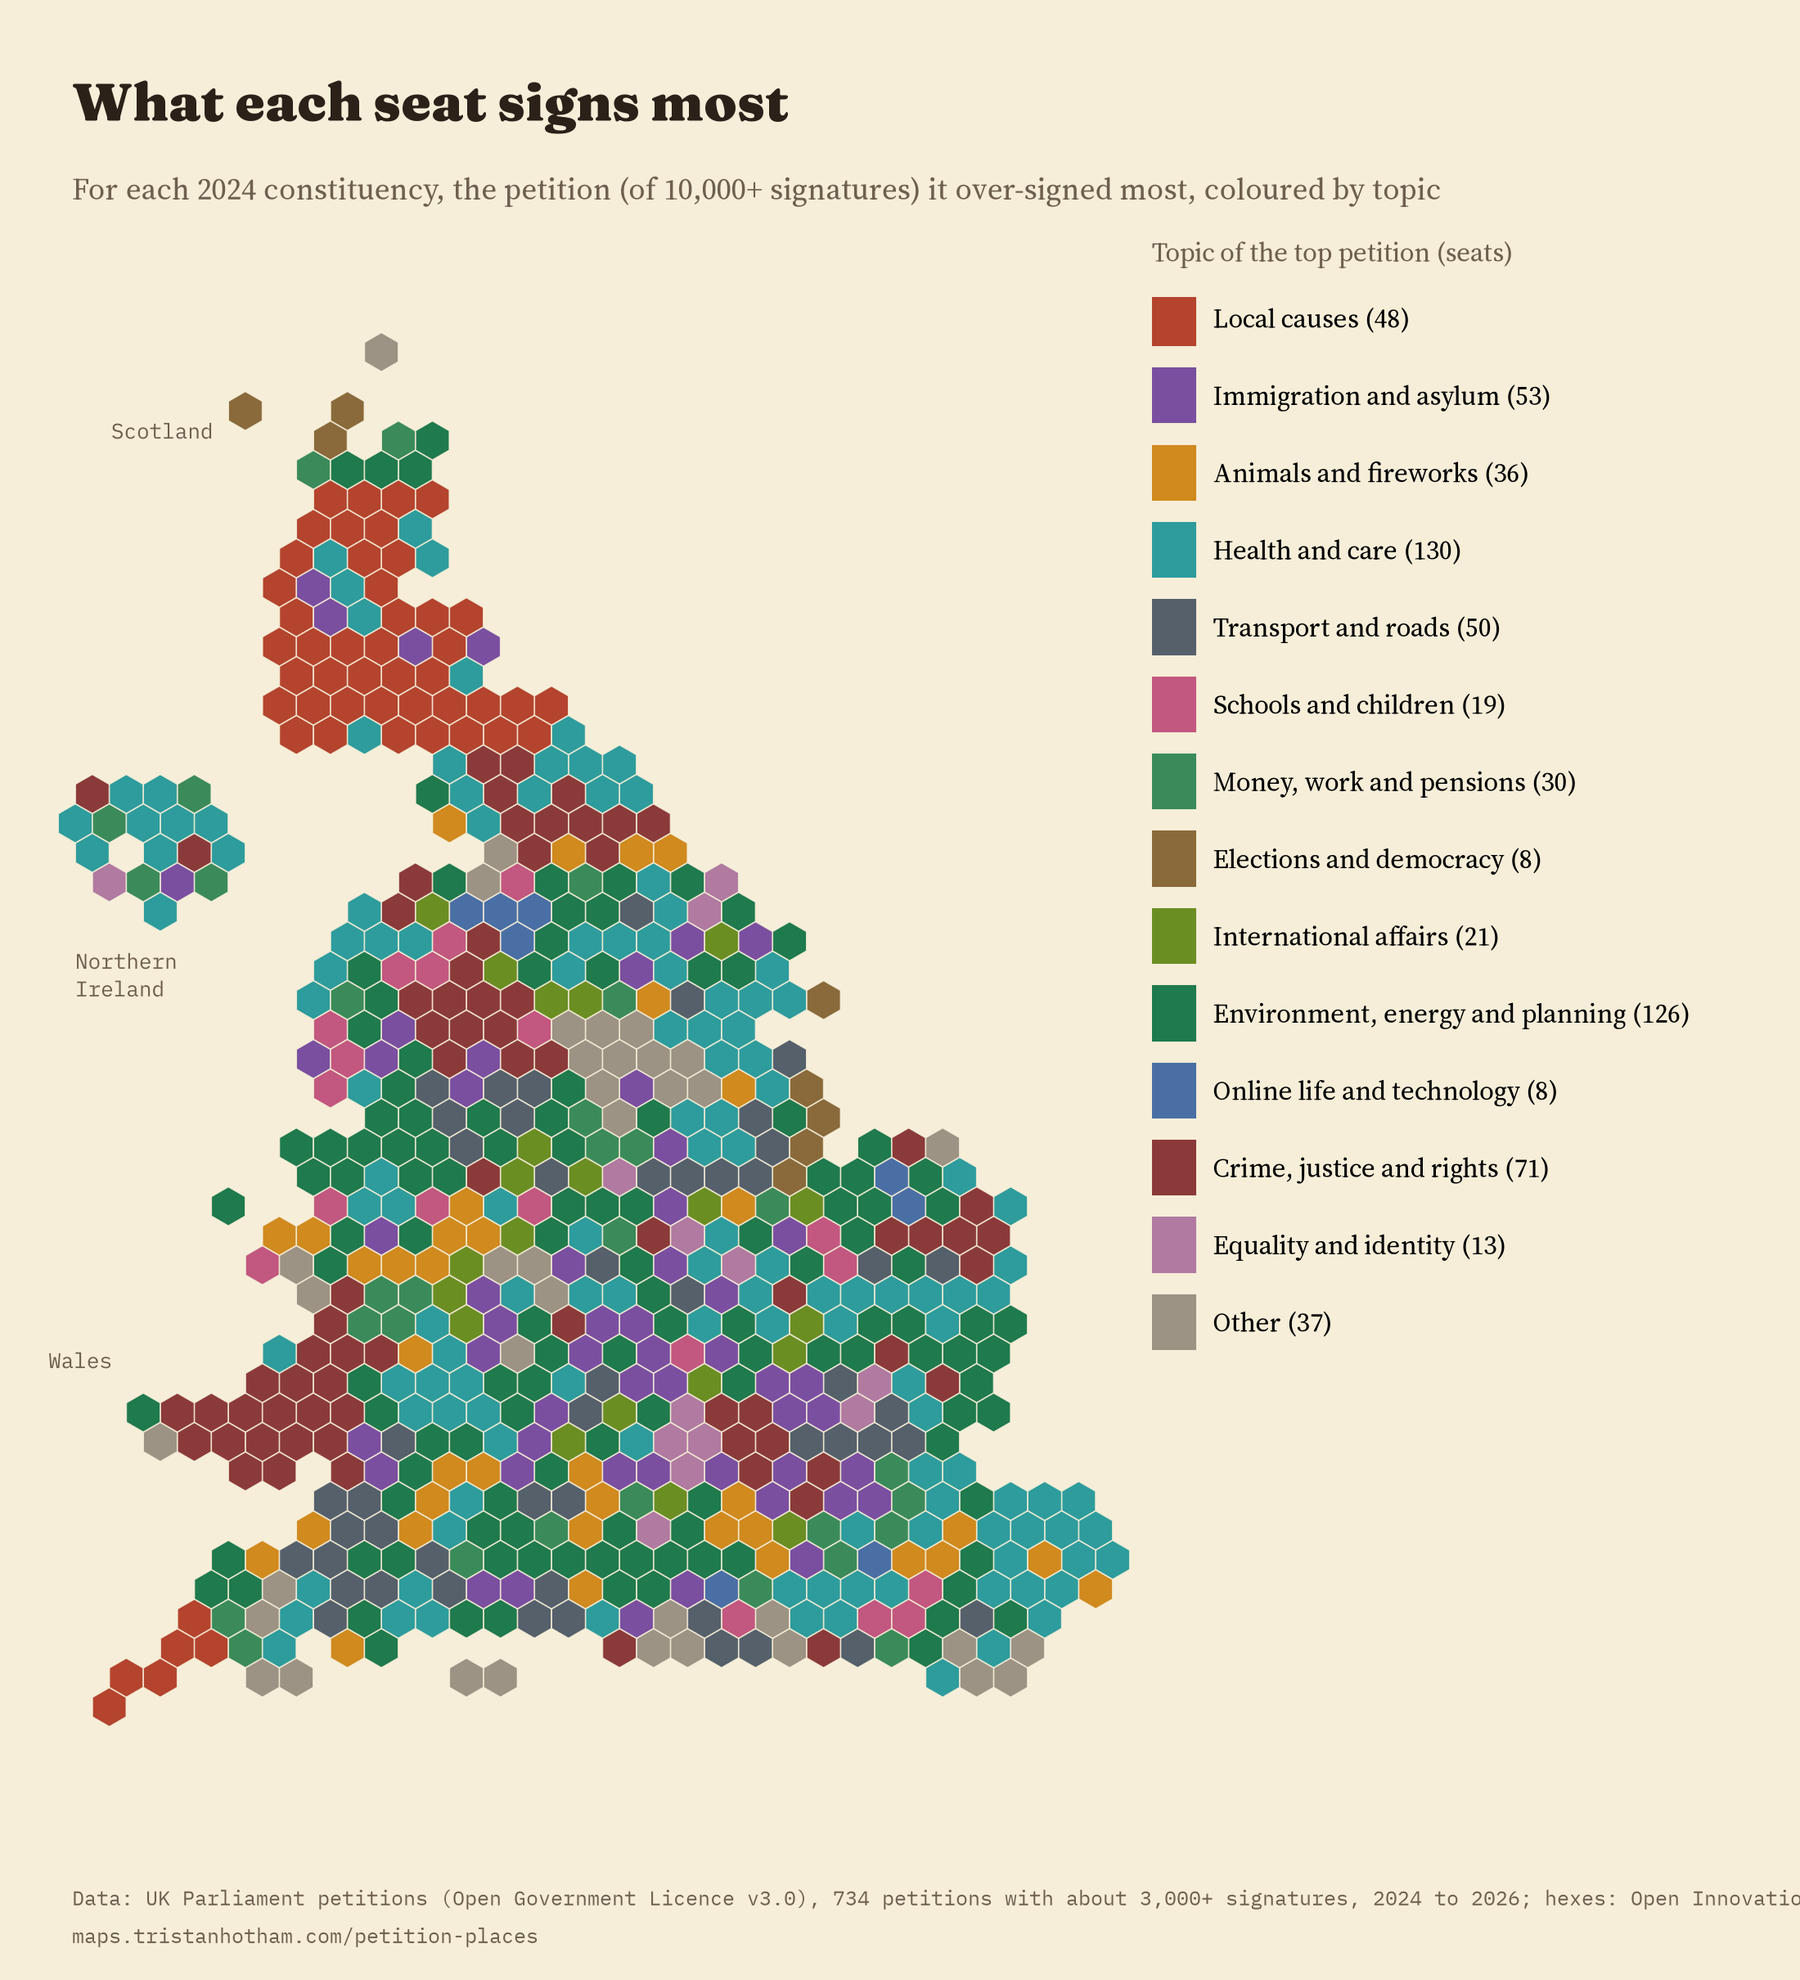
Among national topics, immigration petitions have the most uneven maps and petitions about elections and democracy the most even. Map the petition each seat over-signs most and you get a patchwork: health petitions top 130 seats, environment and planning 126, and 144 different petitions top at least one seat.
Two signature personalities
Put all the maps together and a fairly simple structure appears. Two summary dimensions hold 30% of all the variation between seats. The first separates seats with more graduates, younger people and more ethnic diversity from older, whiter seats where Reform UK did better in 2024. The second separates Labour-held seats with poorer health from Conservative and Liberal Democrat seats with older populations, and it is marked by petitions about nature, the countryside and animal welfare.
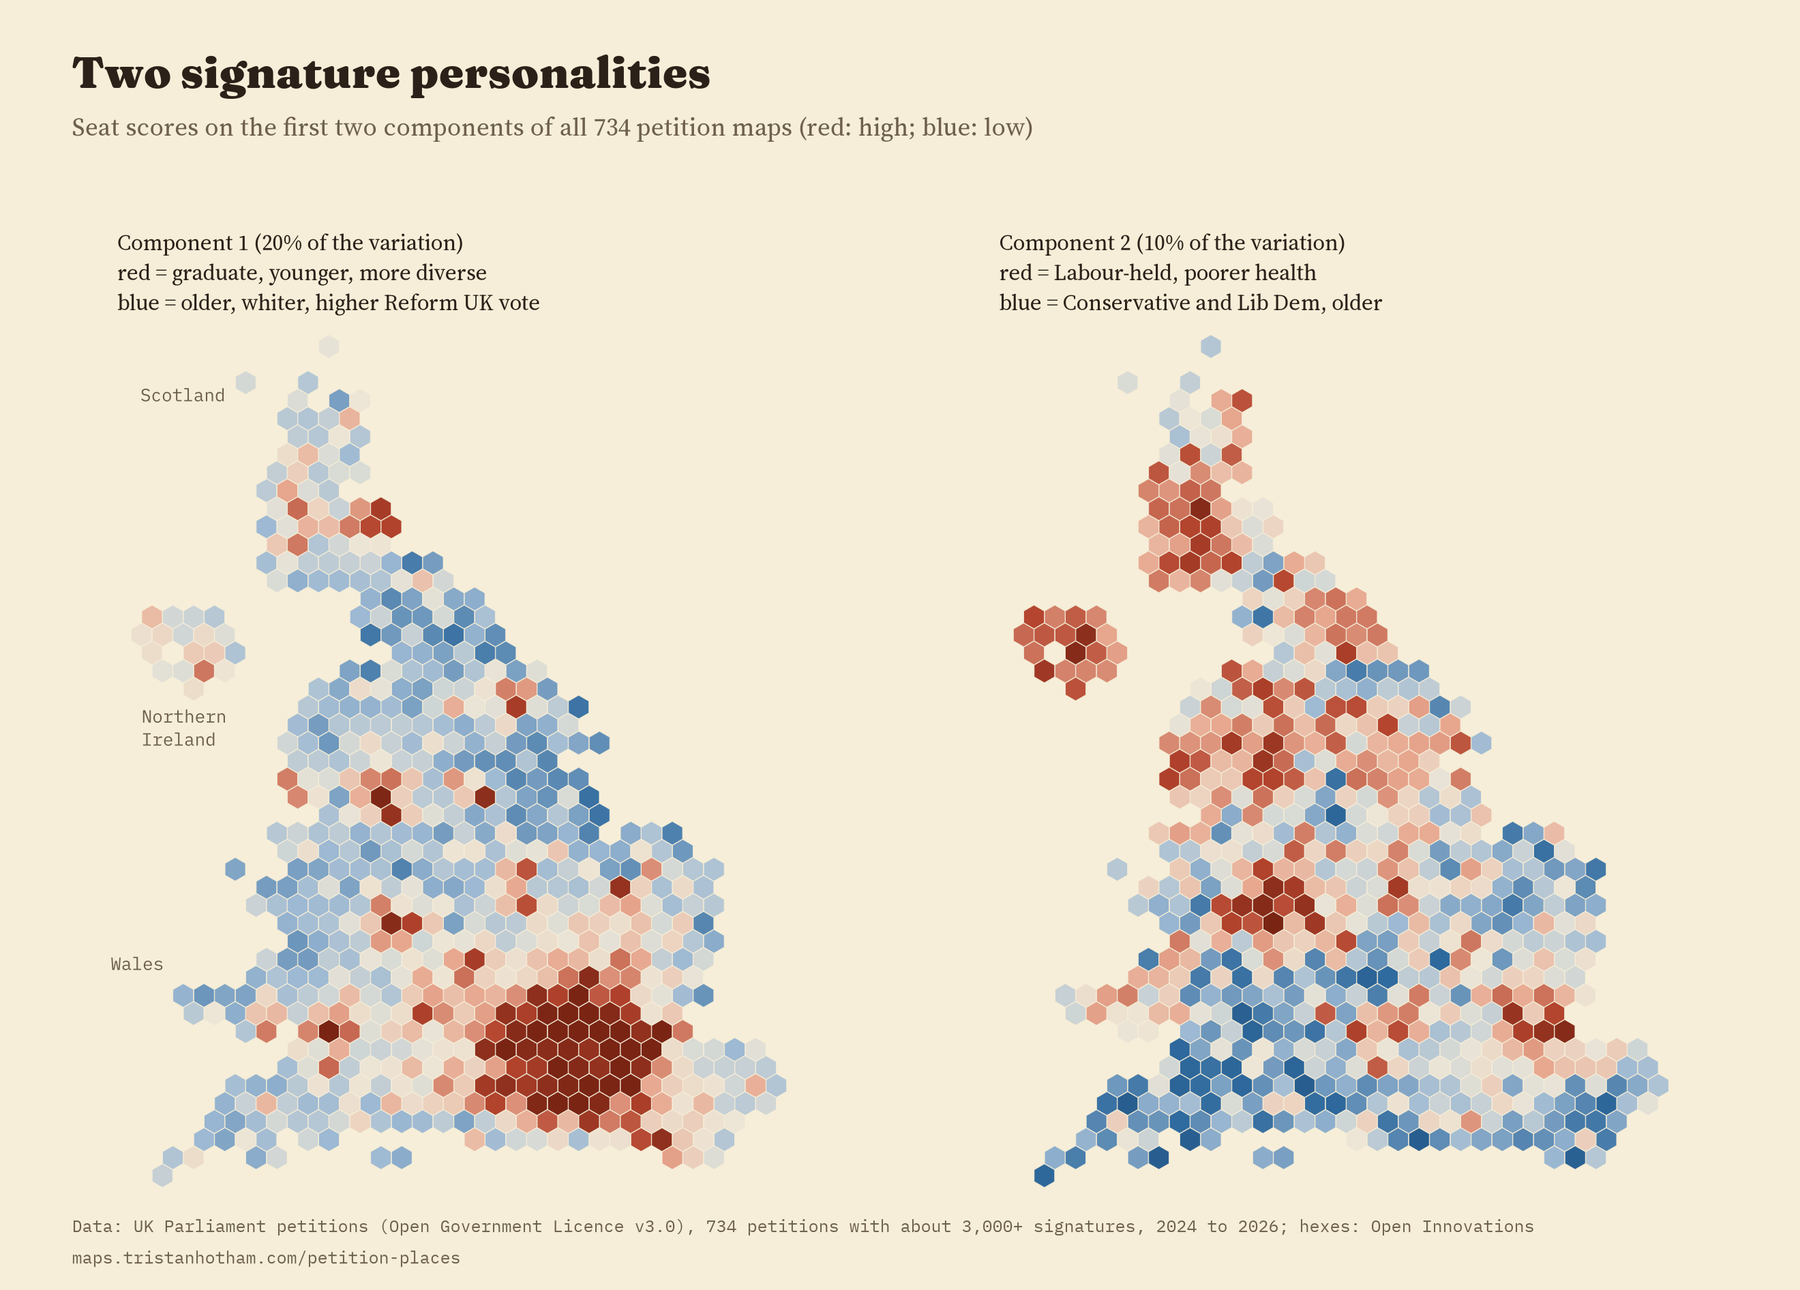
Split the petitions in two by date and the seats line up almost exactly the same way: a correlation of 0.96.
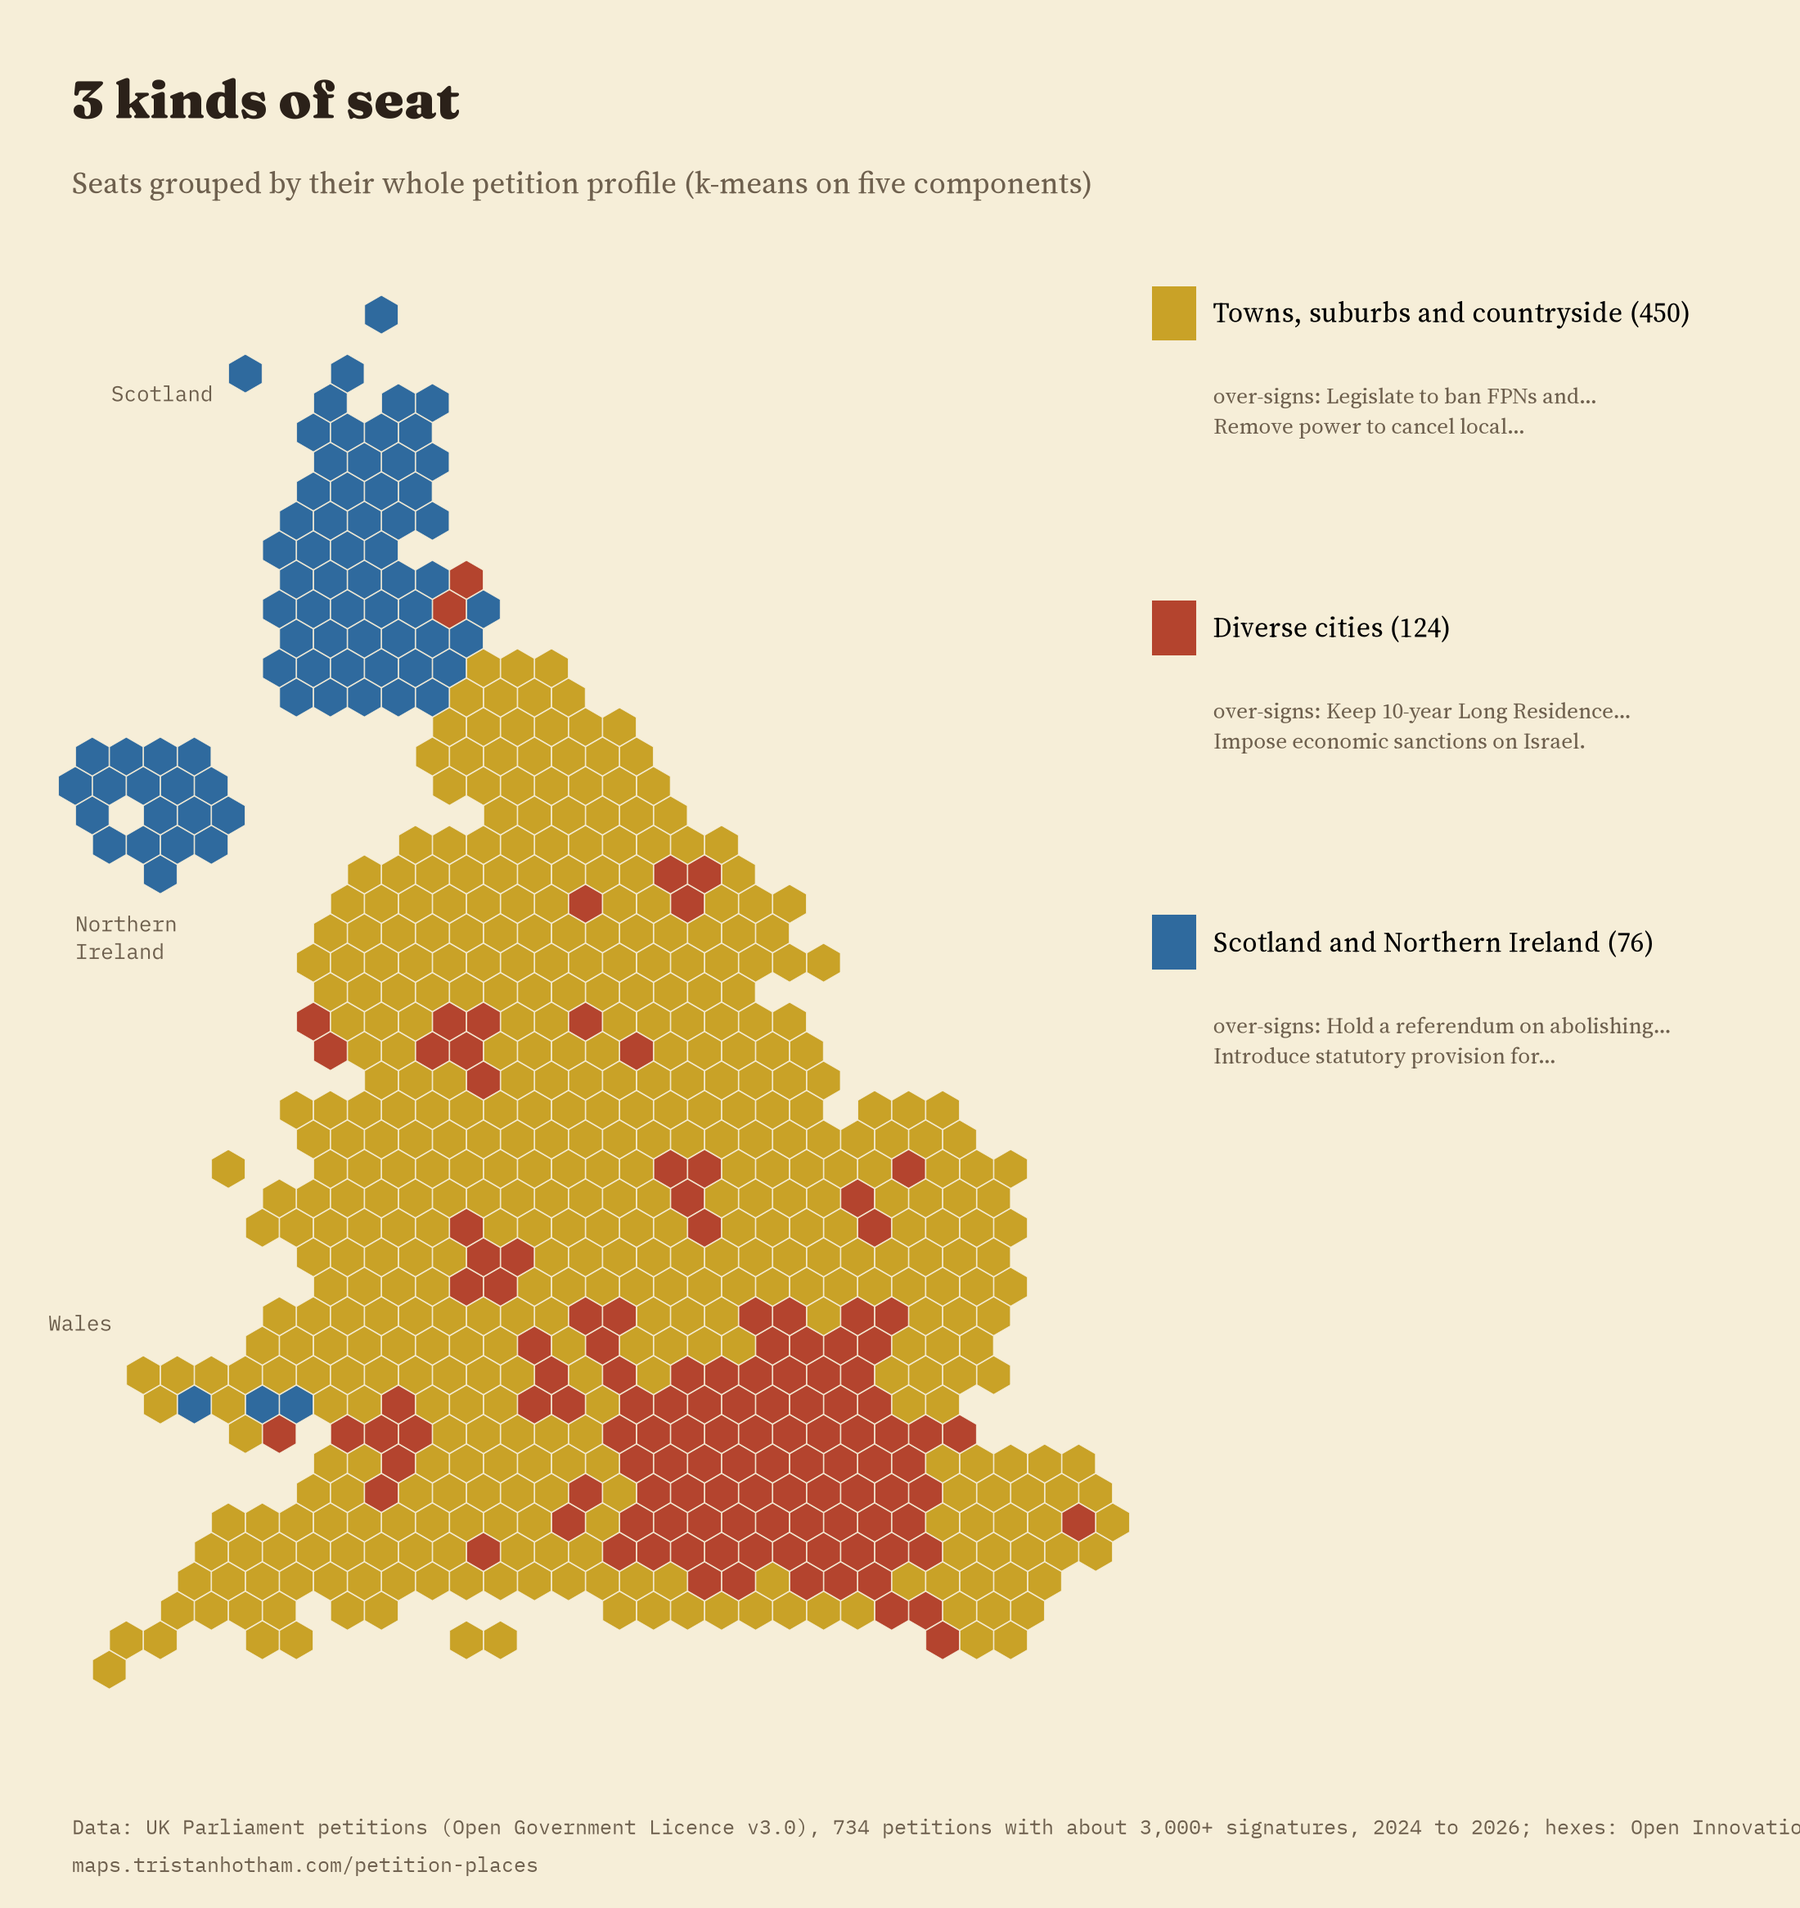
That stability is the finding I like best. These are not the traces of one or two big campaigns: the same pattern appears in the petitions started early in the Parliament and the ones started later. Grouping seats by their whole profile gives three kinds of place: 450 seats of towns, suburbs and countryside, 124 diverse city seats, 68 of them in London, and 76 seats, almost all in Scotland and Northern Ireland, which probably partly reflects how many petitions are about schools and services in England.
Does it follow the vote?
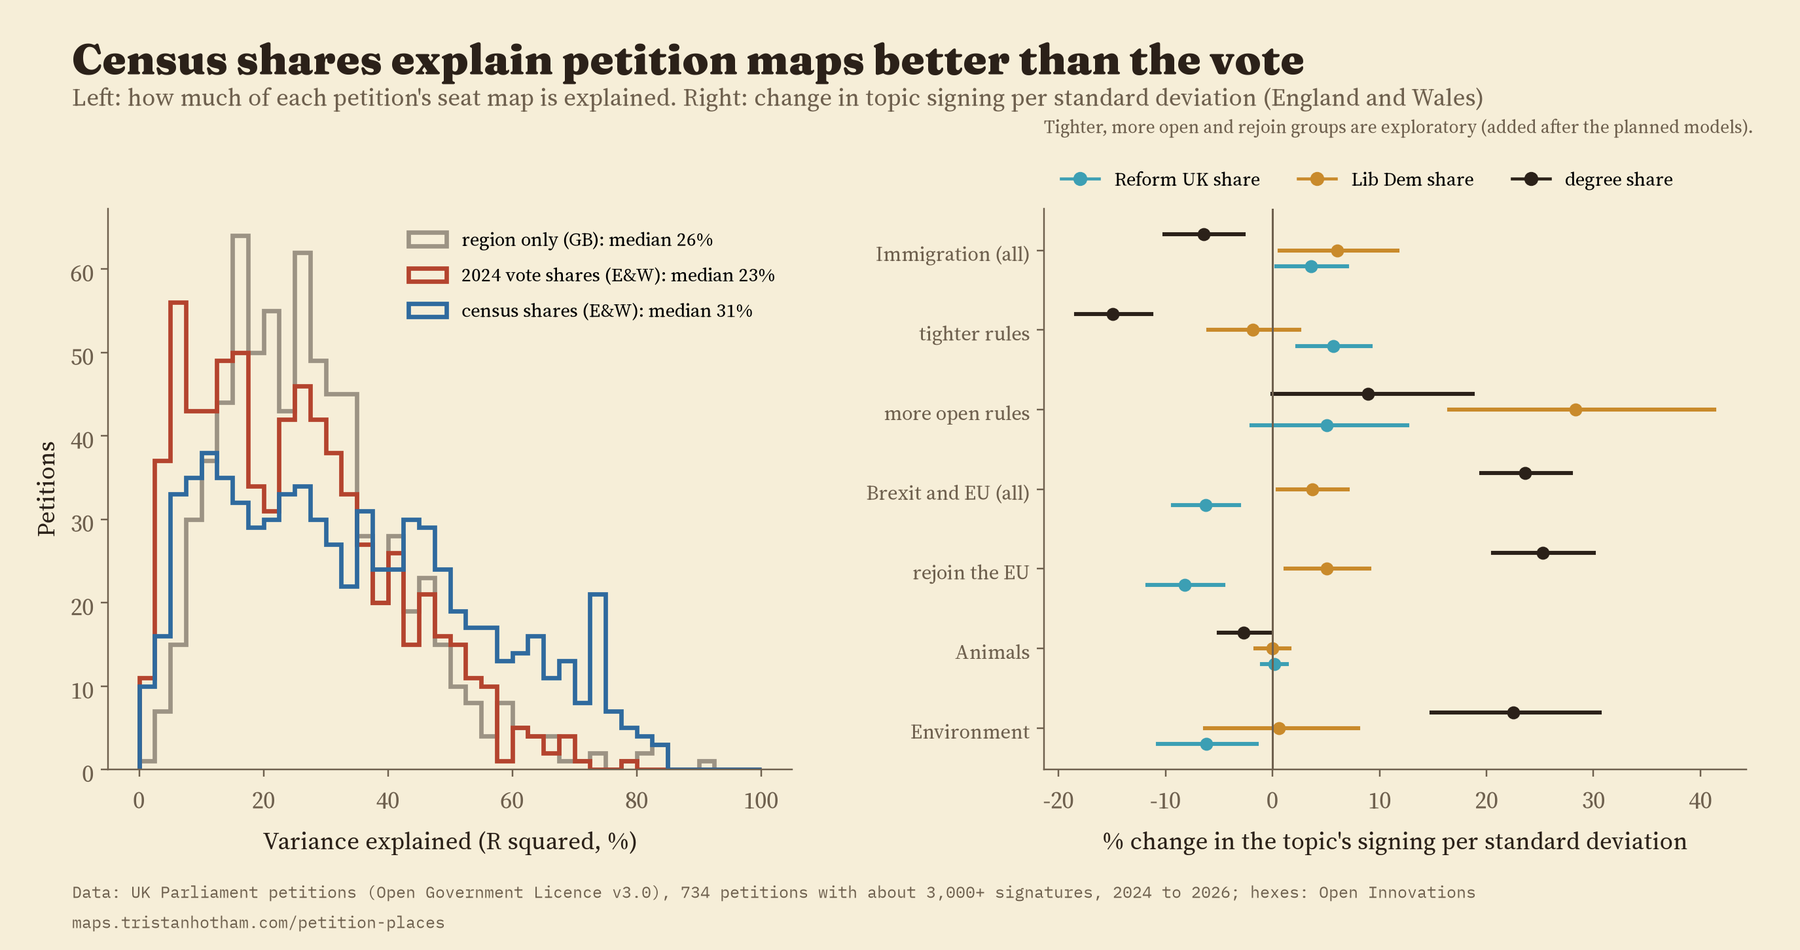
Partly. For the typical petition, the 2024 vote shares account for 26% of its map, about the same as simply knowing the region. In England and Wales, four census measures (age, degrees, health and ethnicity) account for more (31%) than the vote (23%). Most petitions, about animals, health or money, are signed right across the political map.
Two links were in my plan from the start. Petitions about the EU were signed less where Reform UK did well, even after allowing for age, degrees and region, and that held in every one of 19 checks. Immigration petitions as a group were signed a little more where Reform UK did well, but that held in only 10 of the checks. When I looked at the petitions themselves, a likely reason stood out: the group mixes petitions for tighter rules with petitions from people asking to keep their route to settlement, and the two have nearly opposite maps.
How I did this
The petitions site publishes signatures by constituency for every petition. I used the 734 with about 3,000 or more signatures, which hold 93% of all signatures. Seats with only a few signatures for a petition are pulled gently towards the usual rate, so no seat tops a list by chance. I sorted the petitions into topics with keyword rules and then read every one, moving 123 by hand. Votes and census shares for the 2024 seats come from the voteReproject package, and the hexagon layout from Open Innovations. I wrote the analysis plan down before computing any of the measures, and the paper reports it as planned, with later additions marked.
What this cannot tell you: who signed. A petition signed heavily in a seat with a high vote for one party does not mean that party’s voters signed it. People who sign petitions are not typical of everyone, postcodes are self-reported, and a determined local campaign can fill a map on its own. These maps describe places, not people.
Notes and sources
- UK Parliament petitions site, petition.parliament.uk: petitions and signatures by constituency, retrieved 2026. Open Government Licence v3.0.
- 2024 general election results, Census 2021 shares and simplified 2024 boundaries via voteReproject (Horan, Domijan and Brunsdon; MIT), from House of Commons Library and ONS data.
- Constituency hexagons: Open Innovations, odileeds/hexmaps (MIT).
- The closest earlier study: Vidgen, B. and Yasseri, T. (2020) What, when and where of petitions submitted to the UK government during a time of chaos. Policy Sciences 53, 535 to 557.
- Paper: Hotham, T. (2026) What each constituency signs: the geography of UK Parliament petitions. Zenodo. https://doi.org/10.5281/zenodo.24104518
- I wrote the text, with drafting and editing assistance from Claude (Anthropic), which also helped prepare the analysis code. I reviewed and checked all text and results.

