
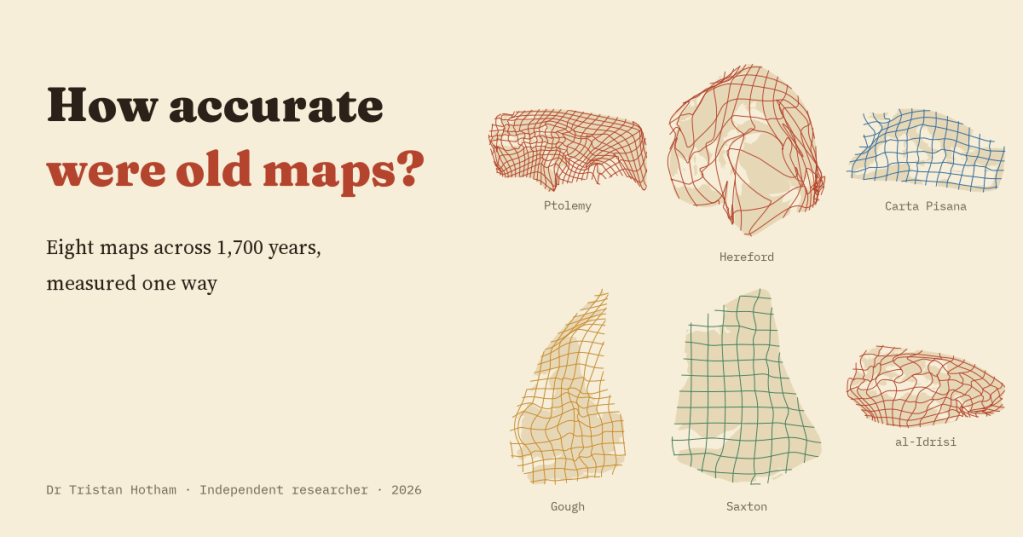
Every study of an old map ends with a number: so many kilometres out. But the numbers never line up, because every study measures differently. I took eight maps I have measured before, from Ptolemy to Ino Tadataka’s survey of Japan, and measured them all again the same way. The answer is not the story of steady progress you might expect.
I have measured a lot of old maps. Ptolemy’s coordinates for the known world. The Peutinger Table, a medieval copy of a Roman road map. Al-Idrisi’s world map, made in Palermo in 1154. The Carta Pisana, usually called the oldest surviving sea chart of the Mediterranean. The Hereford Mappa Mundi. The Gough Map of Britain. Saxton’s atlas of England and Wales. And Ino Tadataka’s survey of Japan, finished in 1821. For each I found real places on the map, put a pin where they really are, and asked how far out the map was.
The trouble is that each of those studies used its own method, its own projection and its own yardstick. A map of Britain will always be out by fewer kilometres than a map of the known world. So this time I took the same 3,772 places on the eight maps and measured them all again, one way.
One yardstick for eight maps
Each map is laid over the real world with the best single scale, shift and turn, the way a map historian would line up a scan on a modern map. Then I measure how far each place lands from where it really is. In kilometres the typical place is 4.4 km out on Saxton’s map of 1579, 18 km on the Gough Map, 94 km on the Carta Pisana and 526 km on the Hereford map. But much of that is size, so the yardstick I trust more is the error as a share of the size of the area mapped.
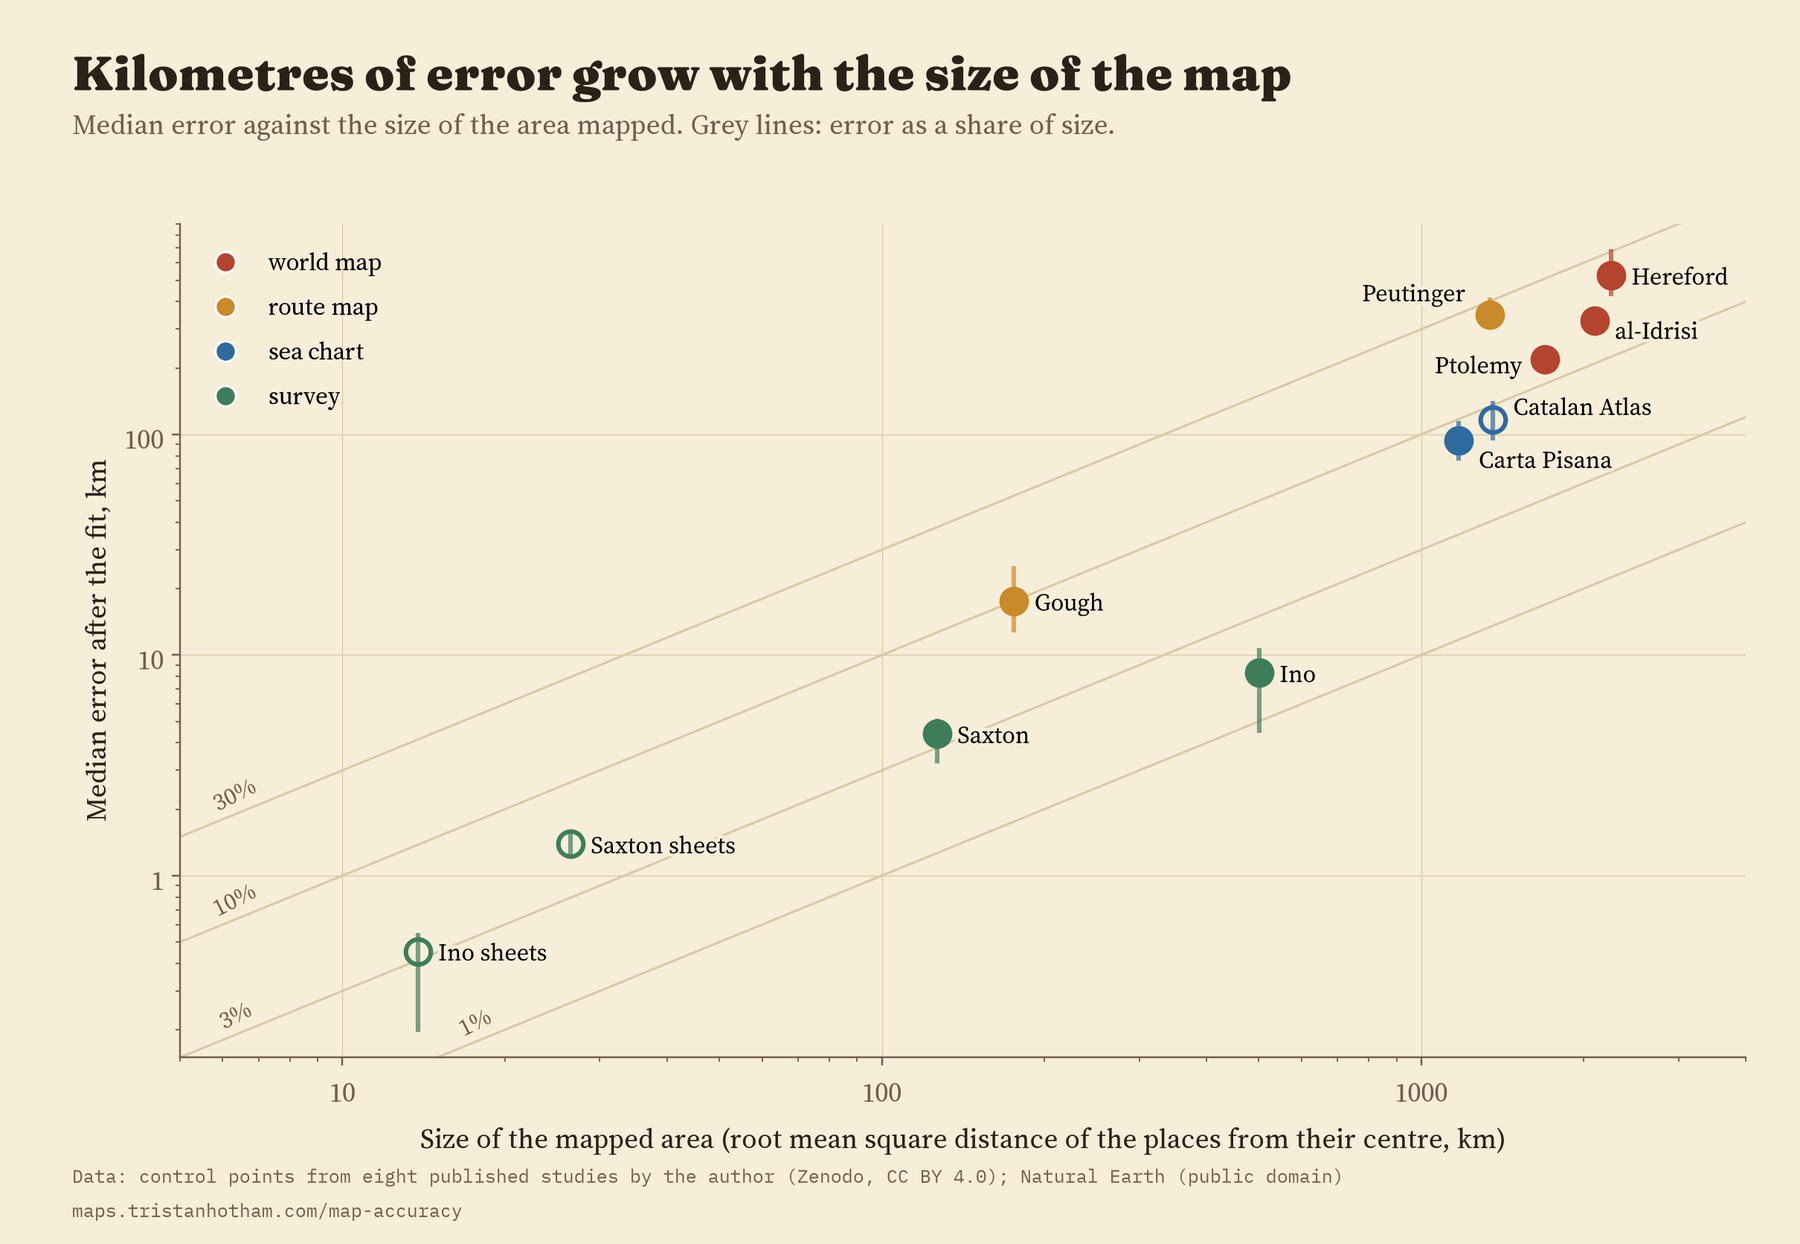
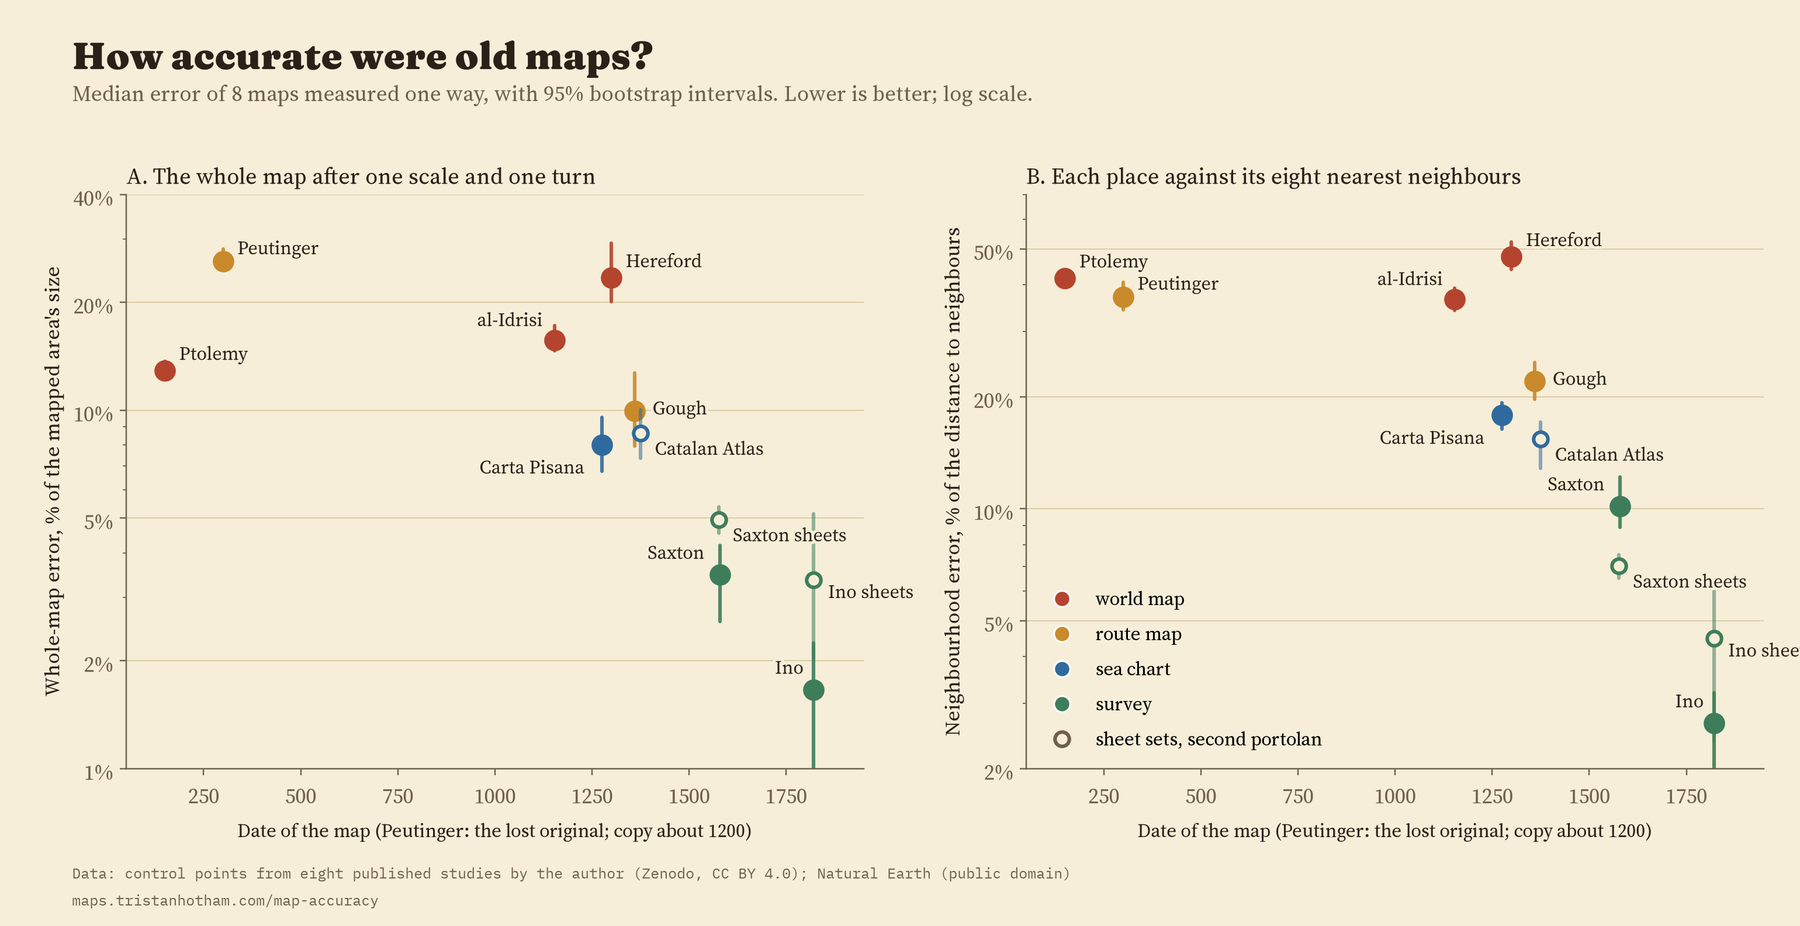
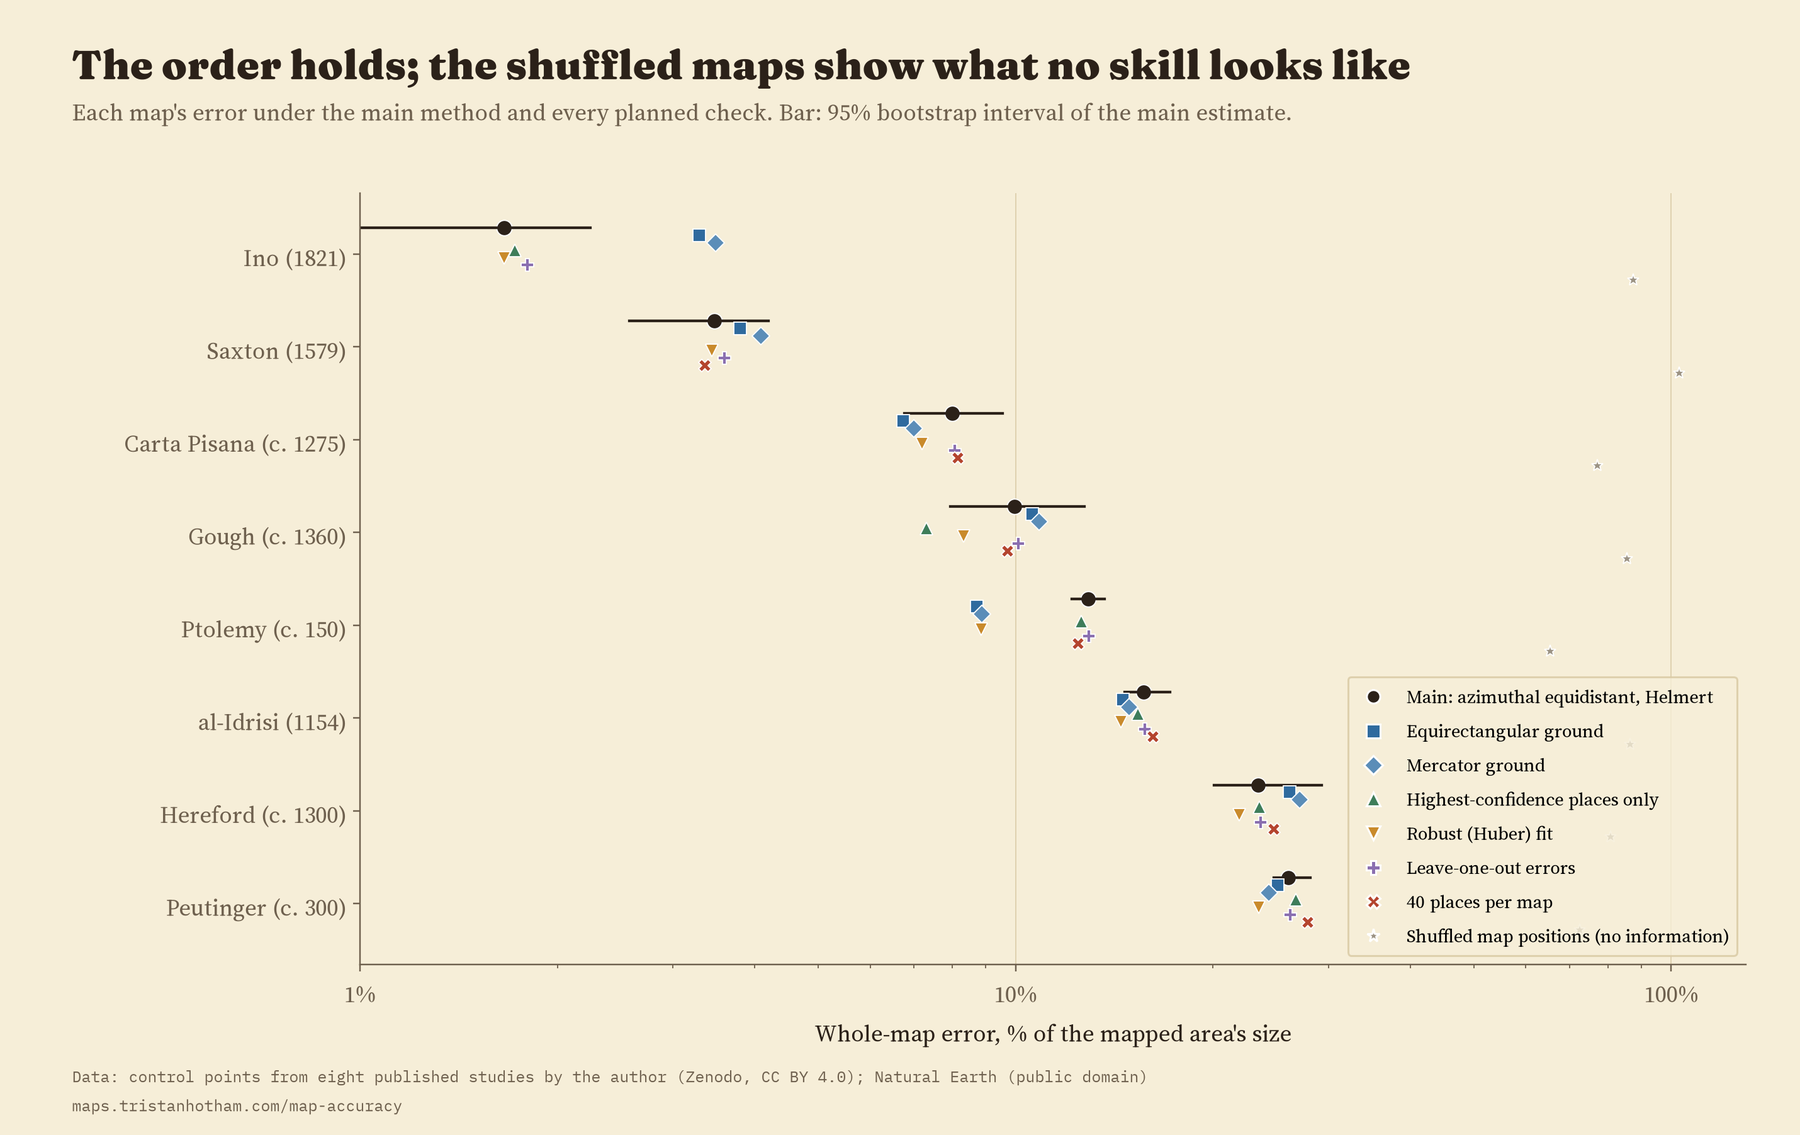
On that yardstick the order is: Ino’s Japan 1.7%, Saxton 3.5%, the Carta Pisana 8.0%, the Gough Map 10.0%, Ptolemy 12.9%, al-Idrisi 15.7%, the Hereford map 23.4% and the Peutinger Table 26.0%.
Not a story of progress
Look at that chart and it is tempting to see progress: big errors in antiquity, small ones by the age of survey. The numbers support something much narrower. The two surveys, Saxton’s and Ino’s, are both the latest maps and the best, and they carry the whole trend. Among the six maps made before 1500 there is no clear pattern with date at all. A sea chart from about 1275 has 2.9 times less error, for its size, than the Hereford map made a generation later. Ptolemy’s coordinates, from the second century, beat two world maps made a thousand years after him. And if you draw the real world on a different projection, the overall trend with date stops being clear. Of the 8 checks I planned in advance, the trend with date survives 5, so I would not call it robust. Accuracy, measured this way, is not progress.
Old maps were as accurate as their makers needed and their methods allowed. That varied a lot. It did not steadily improve.
What lines the maps up better is what they were for. The surveys were measured on the ground: a median of 2.6% of their size. The sea chart was made for sailors: 8.0%. The two route maps, made to show the order of places along roads and the distances between them: 18.0%. The world maps: 15.7%. The Hereford map is a picture of history and faith centred on Jerusalem, and the Peutinger Table is a road map rolled into a strip about 20 times longer than it is high. Judging either by how well it fits a modern map misses what it was for.
Eight ways to bend the world
Numbers only say how much. To see where, I drew each map’s distortion grid, the way the MapAnalyst software does: a regular grid laid on the real ground, then bent into the shape the old map gives it. The Peutinger Table collapses into a ribbon. The Hereford map folds over itself, with the Holy Land swollen. Al-Idrisi’s world is squashed north to south. The Carta Pisana is regular across the Mediterranean and bent in the Atlantic. Saxton and Ino are nearly square.
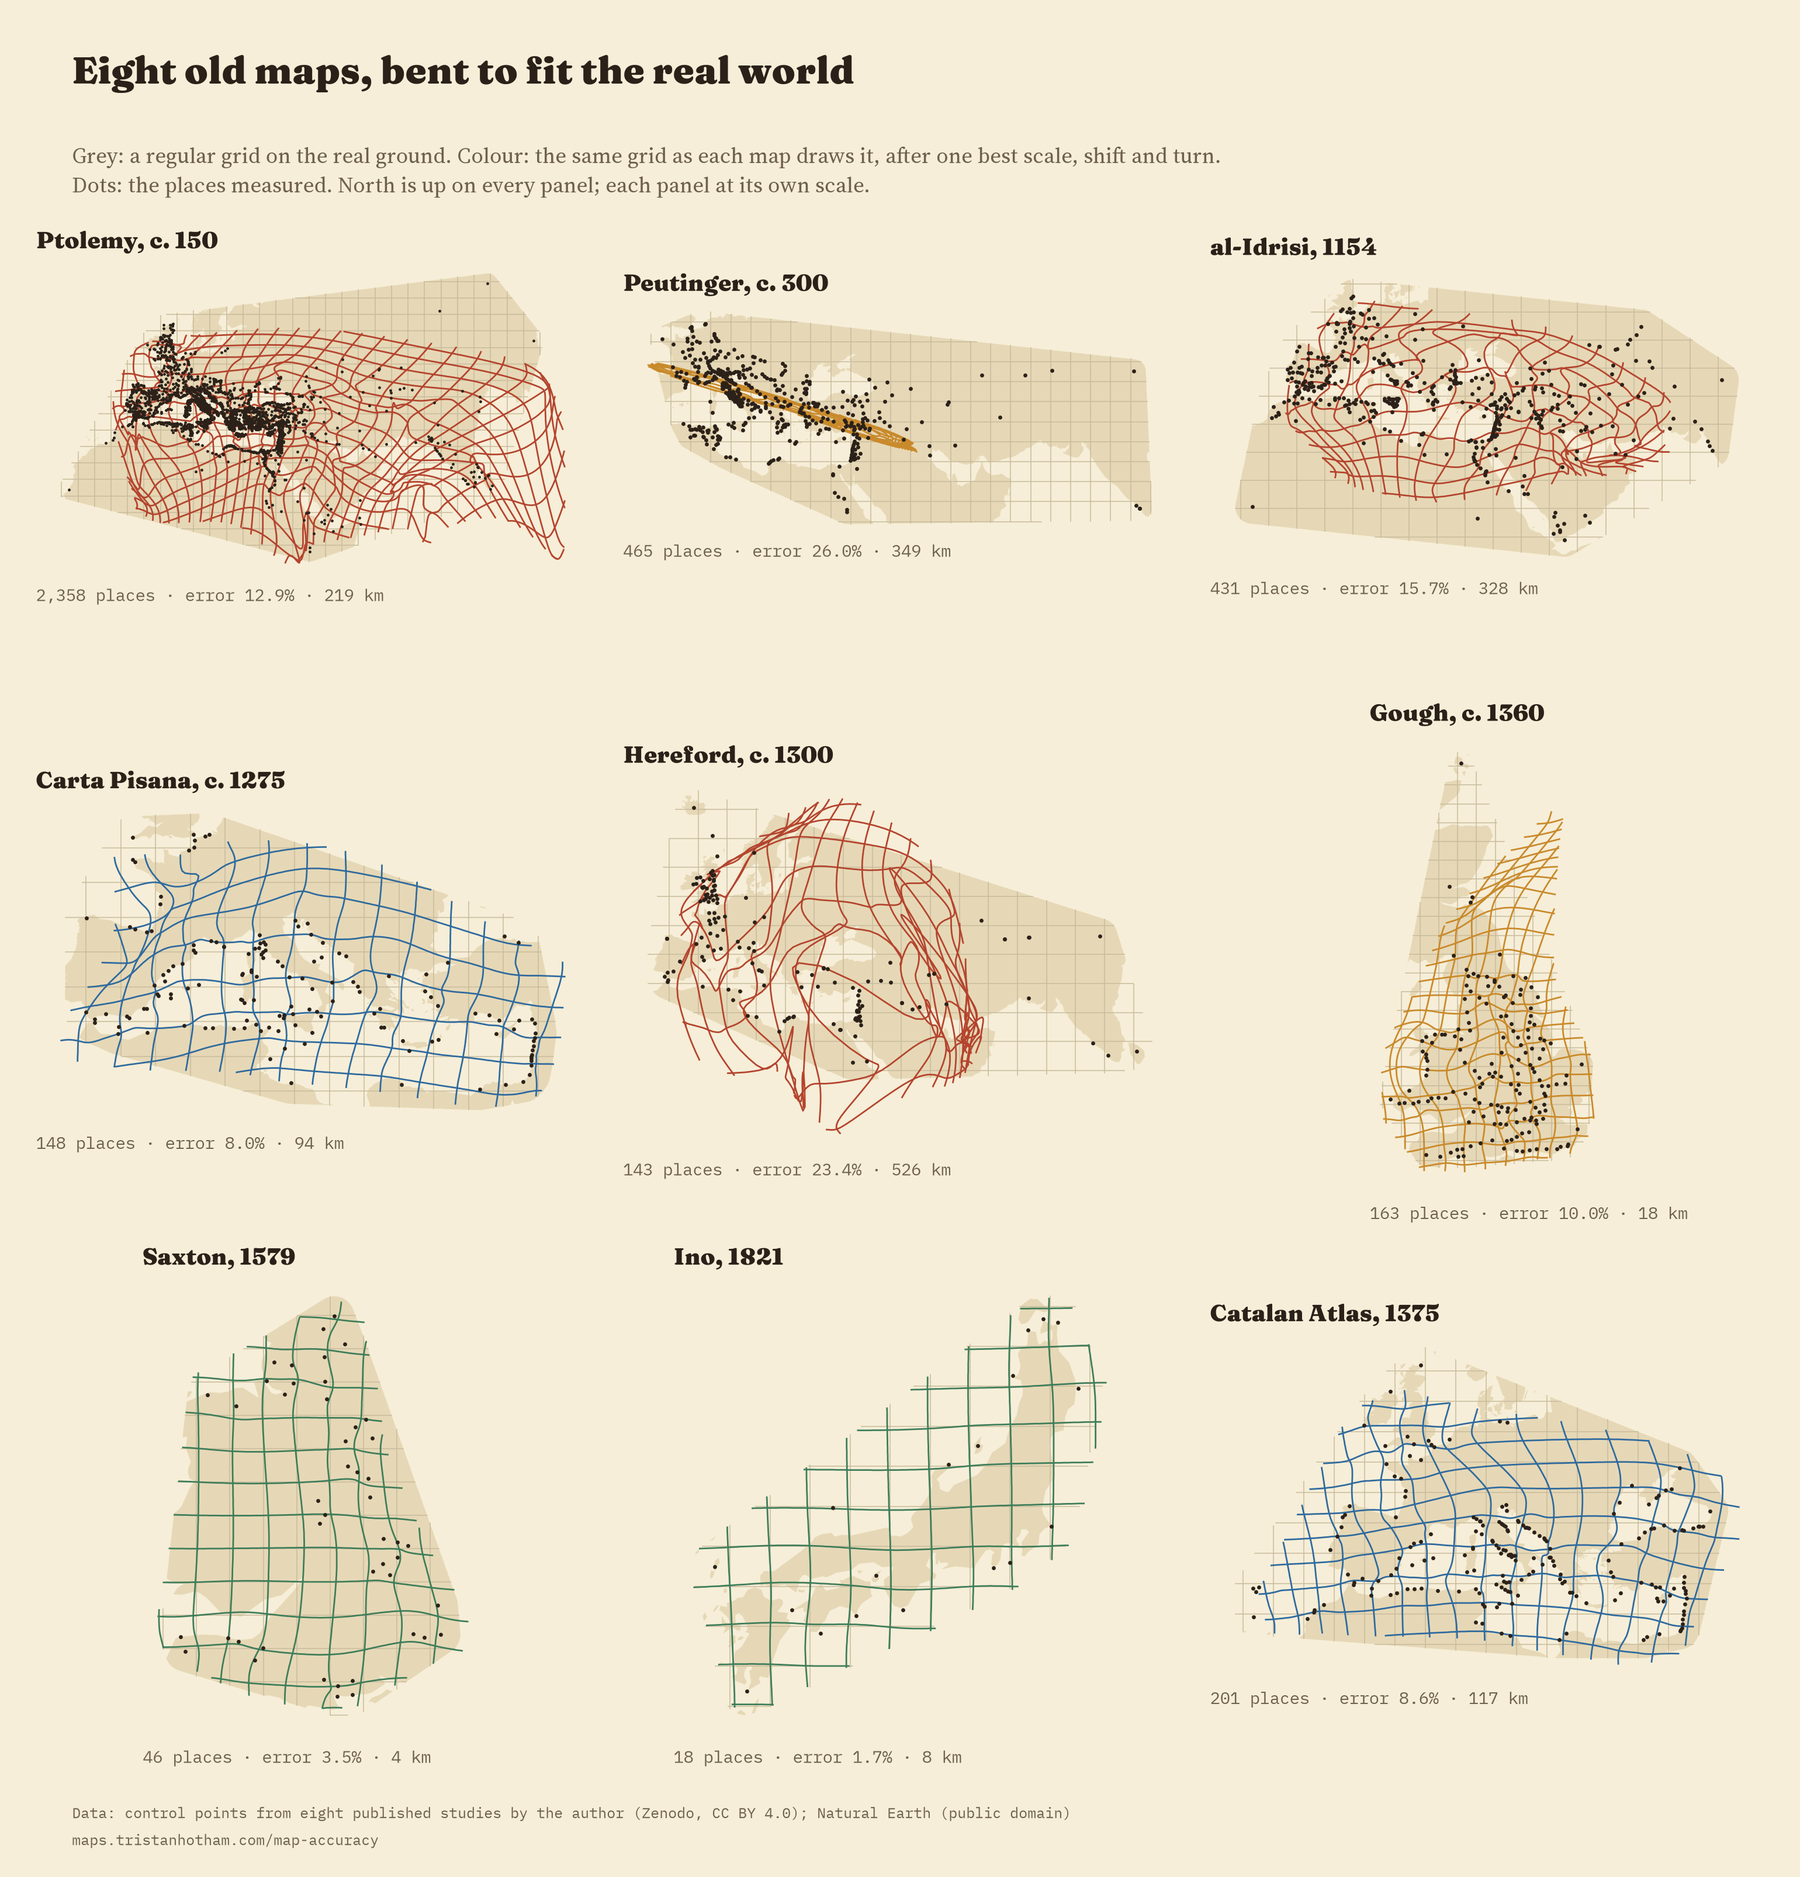
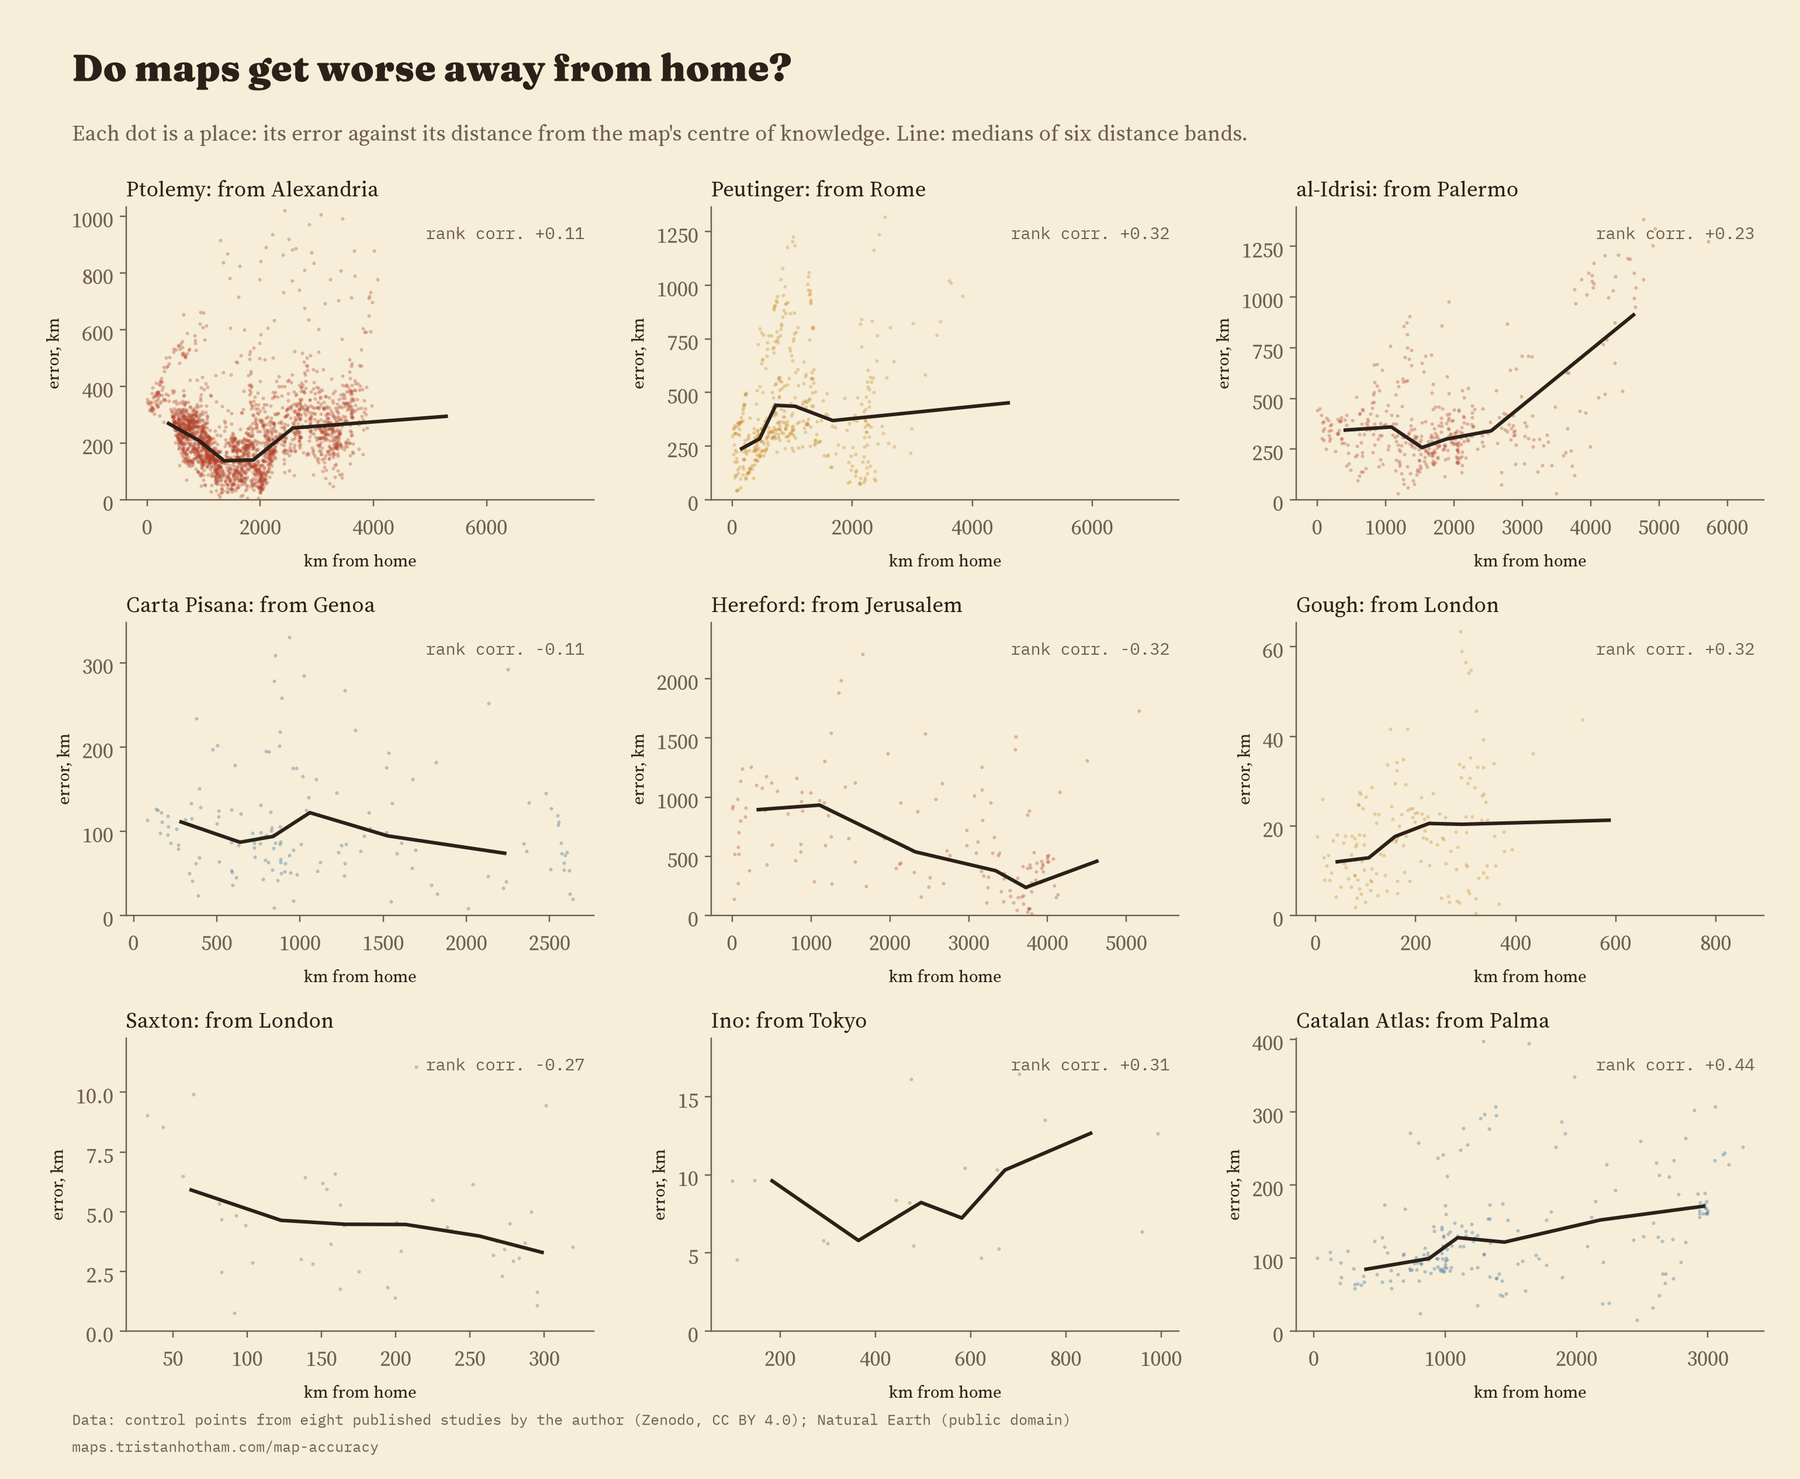
The errors come in regional blocks rather than at random: on 7 of the eight maps, a place’s error is much like its neighbours’. Maps also tend to get worse away from home, by about 35% for each step of the map’s own size from its centre of knowledge. But not everywhere. On the Hereford map it is the other way round: places near Jerusalem are out by a median 906 km and far places by 403 km, because the Holy Land is drawn several times too big.
Which way is up?
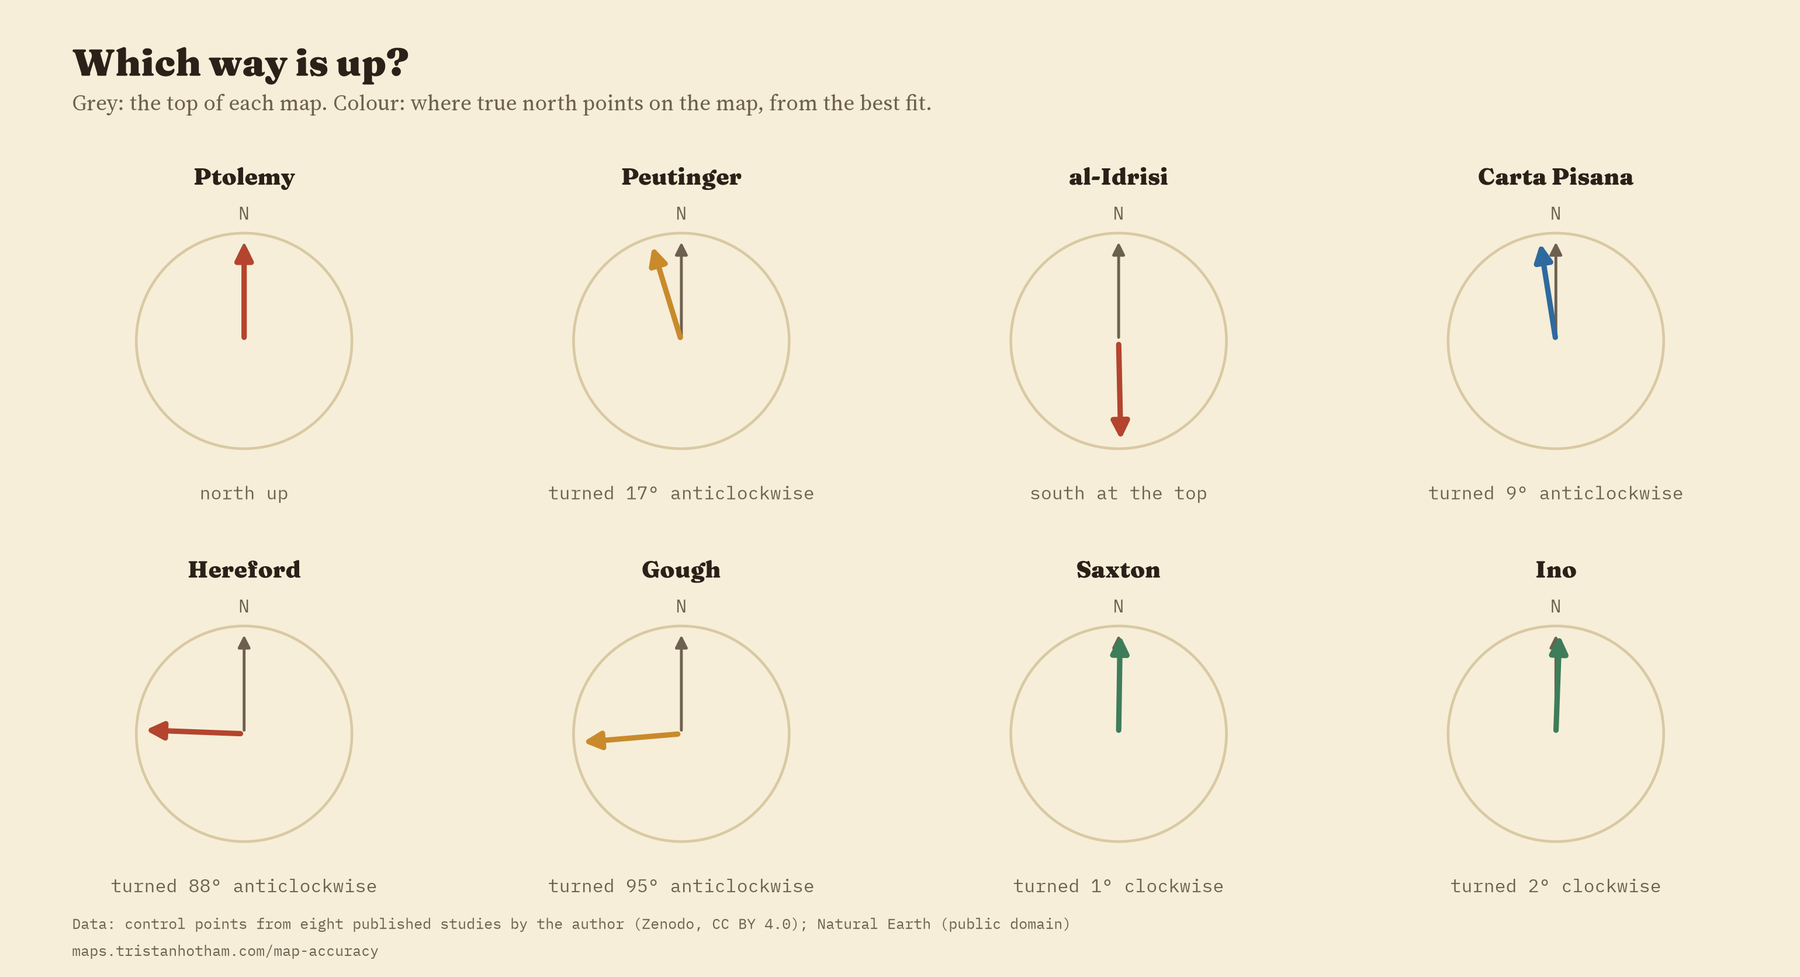
The same fit also finds each map’s north. Al-Idrisi put south at the top. The Hereford map and the Gough Map put east at the top. The Carta Pisana is turned about 9 degrees, the famous tilt of the portolan charts. Ptolemy, Saxton and Ino point within about two degrees of true north.
Checking the order
I wrote the method and the checks down before running anything. Drawing the real world on other projections, using a fit that ignores wild points, keeping only the places I was surest of, testing each place without itself, using 40 places per map, and leaving out each region in turn all leave the order of the eight maps almost the same. The levels do move, especially for the big maps: on a projection with straight lines of latitude and longitude, the world maps and sea charts look better, by up to 38%. And when I shuffled each map’s places at random, to see what a map with no information looks like, the errors jumped to 65% to 103% of the area’s size. Every one of these maps, even the strangest, knows a great deal about where things are.
How I did this
Every place comes from my earlier studies of these maps; nothing was read again. Each map is fitted to the real positions with one scale, one shift and one turn (a Helmert transformation, in the jargon), on a projection centred on its own places, and each error is the distance on the globe between where the map puts a place and where it is. The share of size divides the typical error by the typical distance of the places from their centre. A second measure asks how well each place’s eight nearest neighbours predict where it should be. Intervals come from resampling the places 2,000 times.
What this cannot tell you matters as much. These numbers measure how far identifiable places, on a particular copy, sit from the modern ground. Al-Idrisi is measured on Konrad Miller’s 1928 reconstruction, and the Hereford map and the Peutinger Table on his facsimiles. Ino’s own large sheets survive in the collection I used only for the far north, so his whole-country number comes from the map of Japan compiled from his survey in 1878. And eight maps are too few to separate date from purpose. None of this says whether a map did its job.
Notes and sources
- The eight earlier studies, each with its data and code: Ptolemy, the Peutinger Table, al-Idrisi, the portolan charts, the Hereford Mappa Mundi, the Gough Map, Saxton’s atlas and Ino’s Japan.
- Ptolemy’s coordinates: G. Grasshoff and O. Defaux, Catalog of Ptolemy’s Geography (Zenodo, CC BY 4.0). Coastlines: Natural Earth (public domain).
- The method follows B. Jenny and L. Hurni, Studying cartographic heritage (Computers and Graphics, 2011), the paper behind MapAnalyst, and W. Tobler, Bidimensional regression (Geographical Analysis, 1994).
- Further reading: J. B. Harley and D. Woodward (eds), The History of Cartography, Volume One (1987); D. Woodward, Reality, symbolism, time, and space in medieval world maps (1985); M. Edney, Cartography: The Ideal and Its History (2019).
- I wrote the text, with drafting and editing assistance from Claude (Anthropic), which also helped prepare the analysis code. I reviewed and checked all text and results.

