
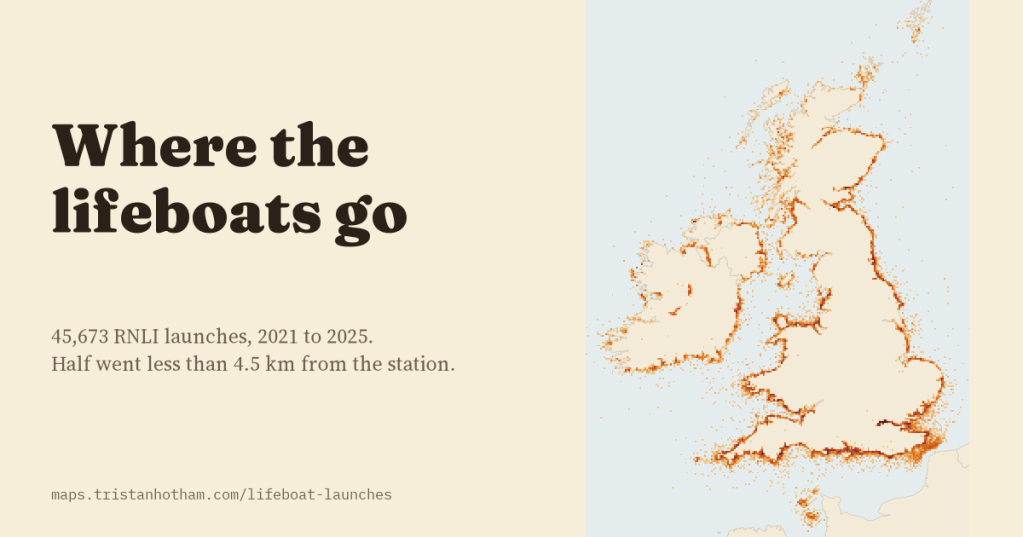
Every time an RNLI lifeboat launches, the crew fills in a record of where they went, for whom and when. I took all 45,673 launches from 2021 to 2025 and mapped the ones with a position. Most rescues happen within a few kilometres of the station, summer belongs to leisure boats, and the busiest station of all is not on the sea.
When a pager goes off at a lifeboat station, volunteers leave their work, their dinner or their bed and run for the boat. The RNLI, the charity that runs the lifeboats around the UK and Ireland, publishes a record of each launch afterwards: the station, the boat, the time, the sea, the kind of casualty, what happened, and the position of the incident. That makes it possible to ask some simple questions of five years of rescues. Where do the boats go? How far? For whom, and when?
Between 2021 and 2025 there were 45,673 launches from 238 stations, about 25 a day. A handful of positions needed fixing: 135 had lost the minus sign on their longitude, so that a launch from Fishguard appeared in the Netherlands, and 23 were impossible and were left off the map. That leaves 45,650 launches with a place.
A thin orange line around the islands
Put on a map, the launches trace the coast. They are thickest along the south coast of England, on the Thames, around Poole, in the Firth of Forth and on the Fylde coast at Blackpool. They are also bunched: on a grid of 2 km squares, half of all the launches fell in just 599 of the 9,689 squares that saw any at all.
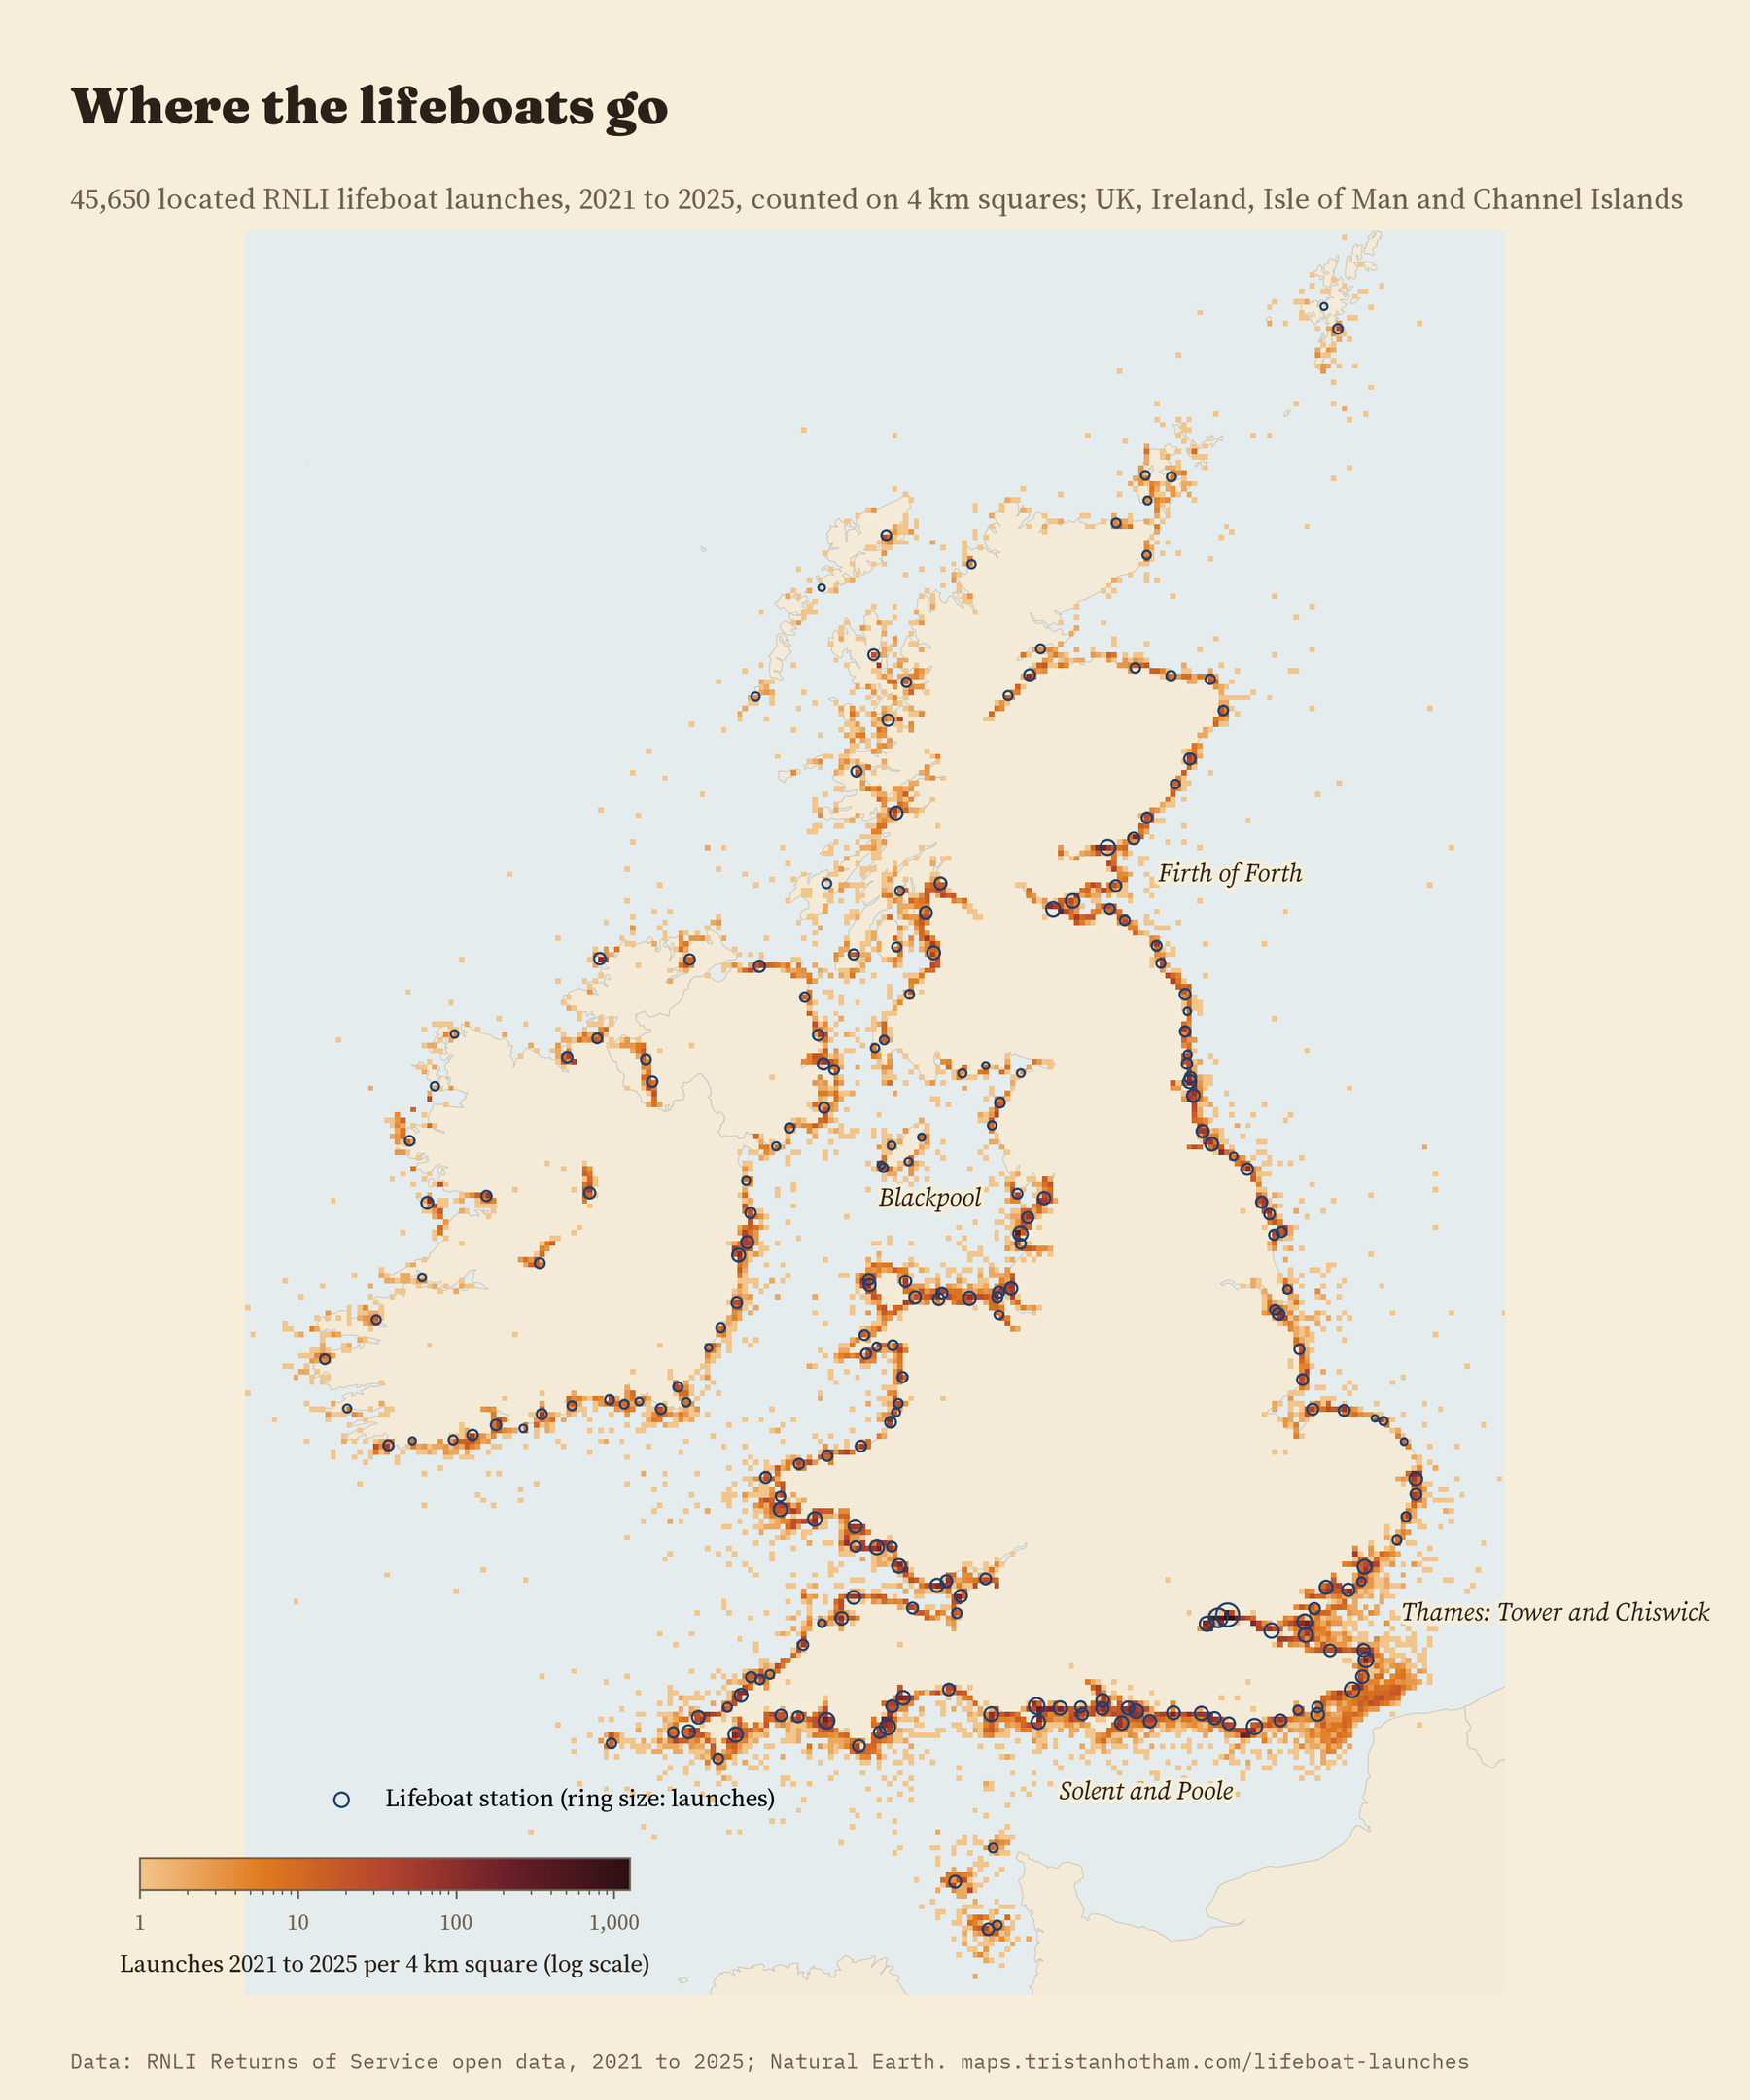
The busiest place of all is a river. Tower lifeboat station, beside Waterloo Bridge in central London, launched 3,077 times in five years, about 1.7 times a day and 6.7% of every launch in the data. Add Chiswick, Teddington and Gravesend and the Thames makes 11.8% of all launches. The three busiest 2 km squares in the whole data are all on the river near Tower.
Most rescues are close to home
Half of all launches went less than 4.5 km from the station in a straight line, and 77% less than 10 km. Only 7.6% went more than 20 km.
The kind of boat matters. All-weather lifeboats are big, fast and built for any sea; inshore lifeboats are smaller inflatable or rigid-hulled boats for shallow water, surf and rocks. The typical inshore launch went 3.5 km, the typical all-weather launch 9.3 km. Comparing the two boats at the same station, the all-weather boat went 150% further, and at 67 of the 68 stations busy enough to compare, its typical trip was the longer one.
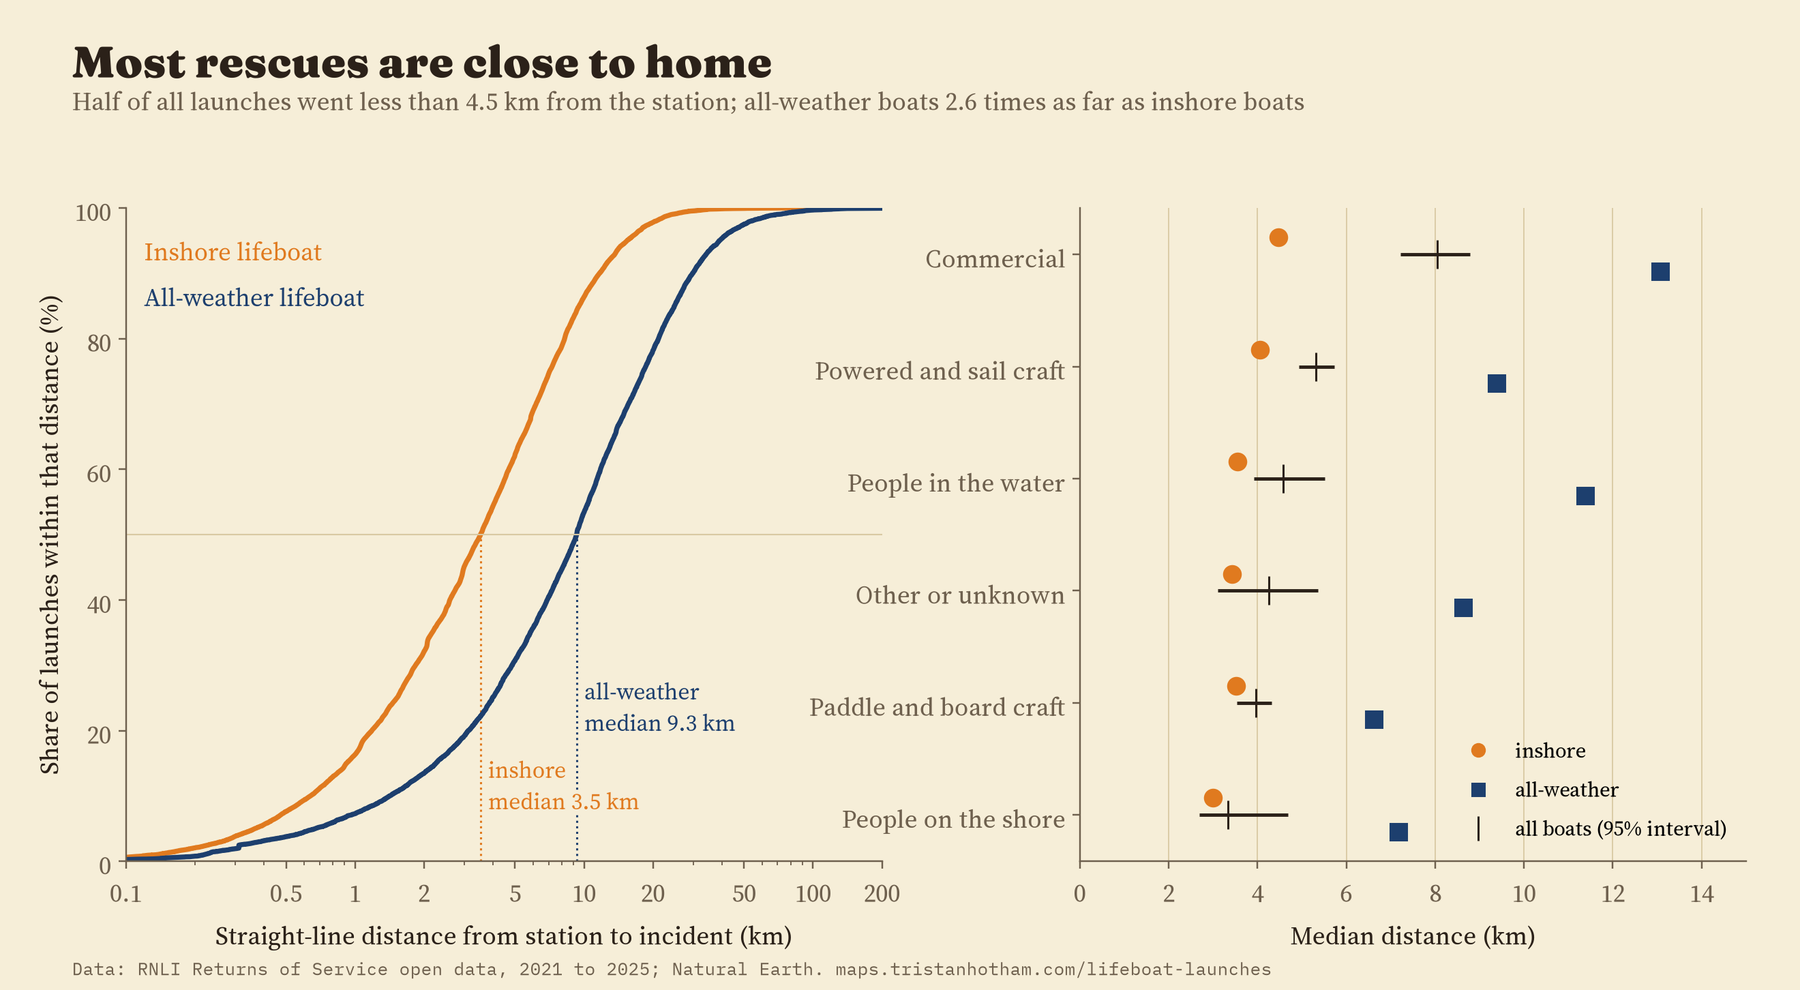
Fishing boats and other commercial casualties were further out than people in the water, by 27% at the same station. I expected motorboats and yachts to be further out too, but they were not: most leisure boating seems to happen close to the harbours where lifeboat stations are.
Summer, weekends and afternoons
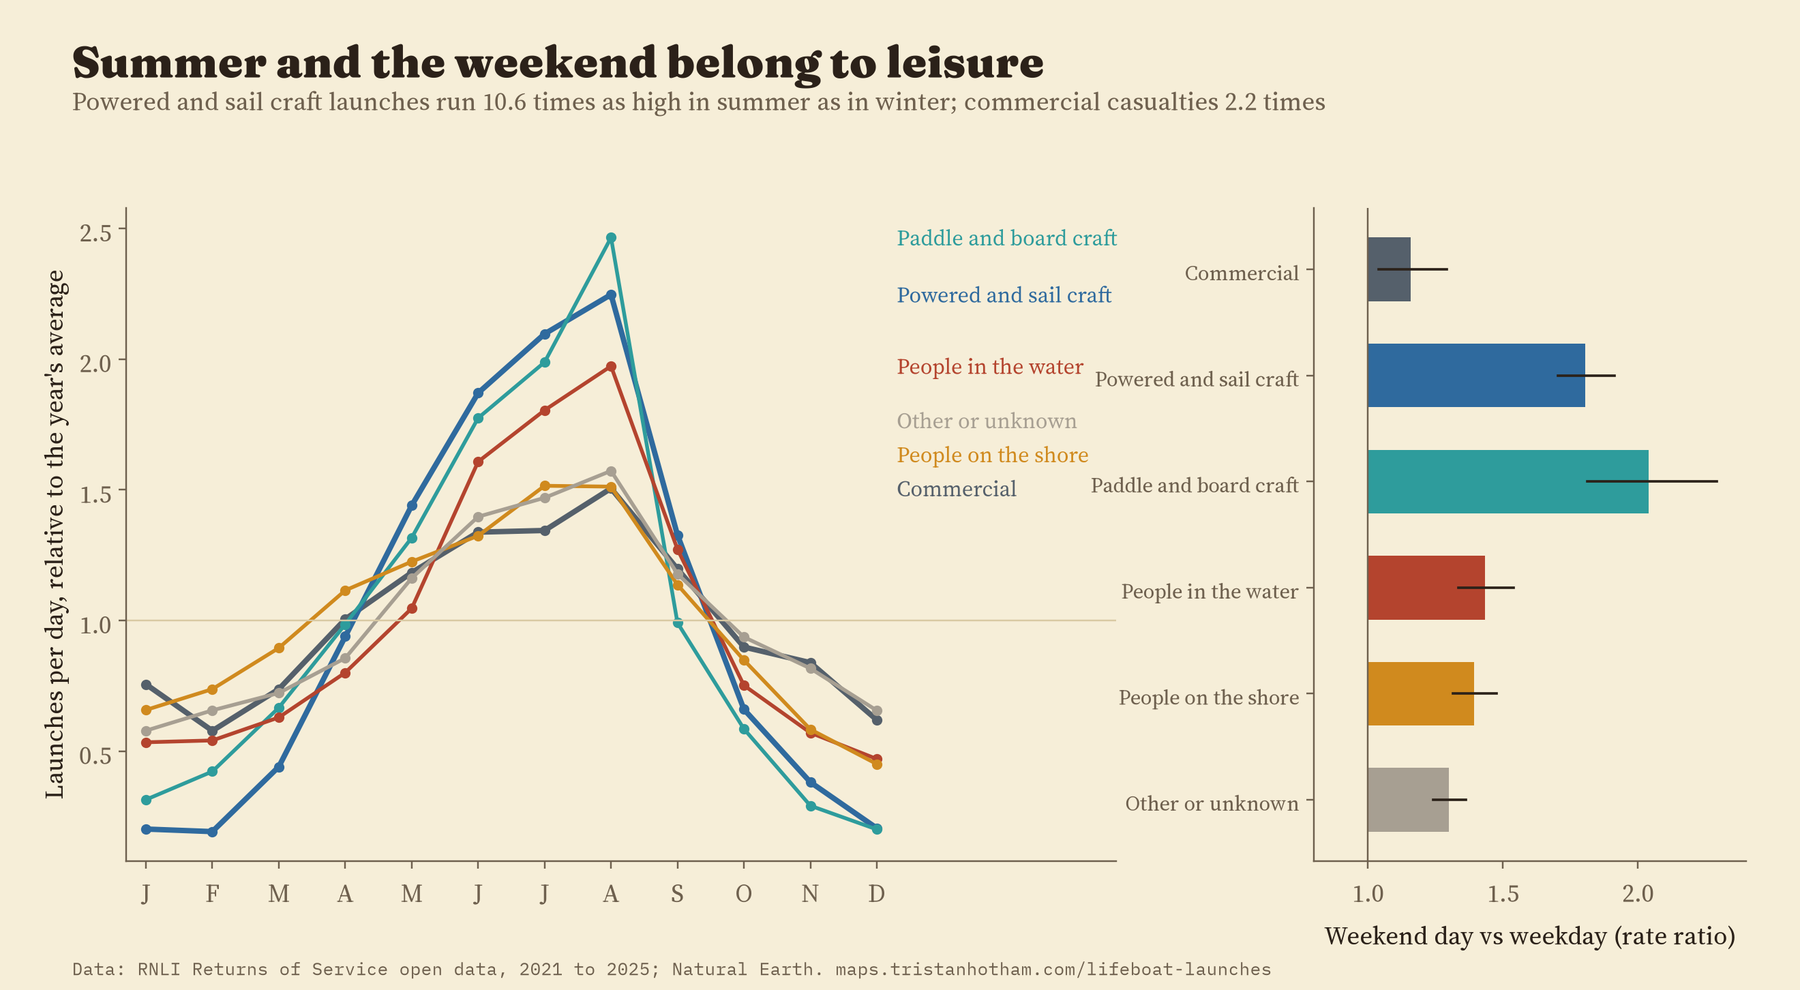
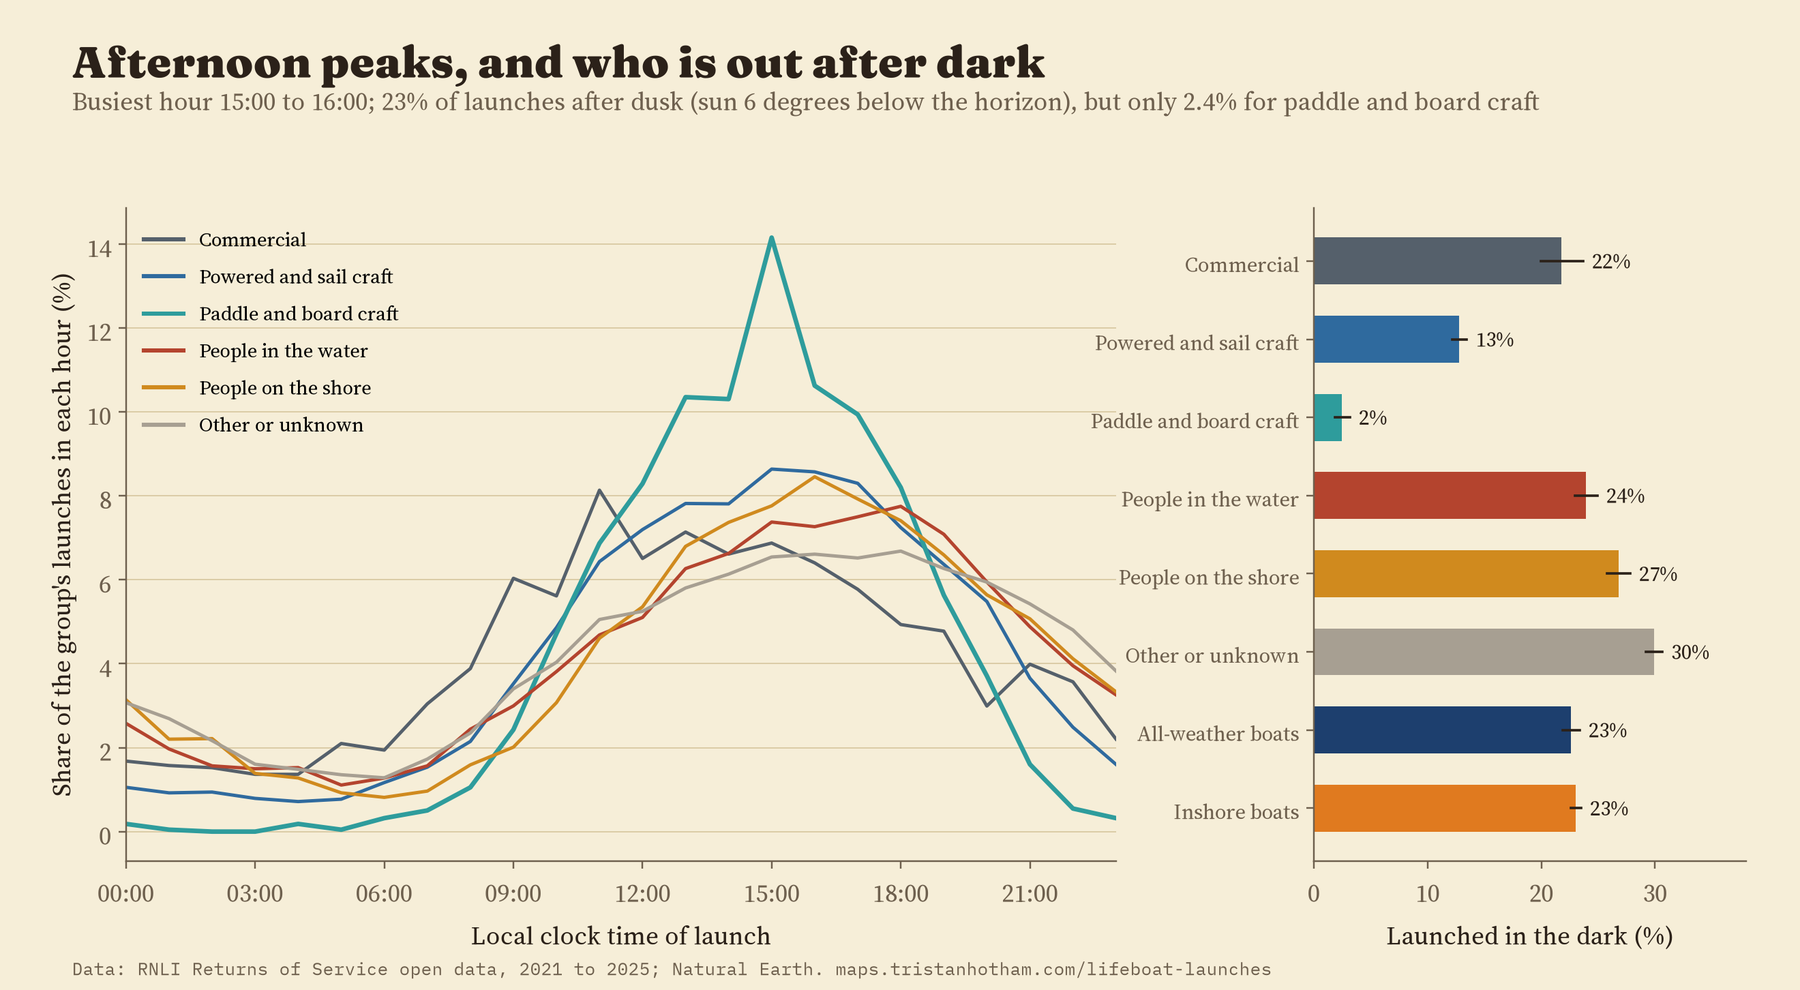
August is the busiest month, with about 45 launches a day against 12 in January. But the summer rush belongs to people at play. Launches to motorboats, yachts and dinghies were 10.6 times as frequent in June to August as in December to February. For kayaks, paddleboards and other boards it was 6.9 times, and for commercial casualties only 2.2 times.
Weekends tell the same story. A Saturday or Sunday brought about 2.0 times the launches of a weekday for paddle and board craft and 1.8 times for motorboats and yachts. Commercial casualties were a little busier at weekends too (1.16 times), which I had not expected.
The busiest RNLI lifeboat station is not on the sea at all. It is on the Thames, in central London.
The busiest hour to launch is 15:00 to 15:59. About 23% of launches were in the dark, and for people on the shore 27%. Paddle and board craft almost never needed a lifeboat after dark: 2.4% of their launches.
Busy stations are not the ones with most coast
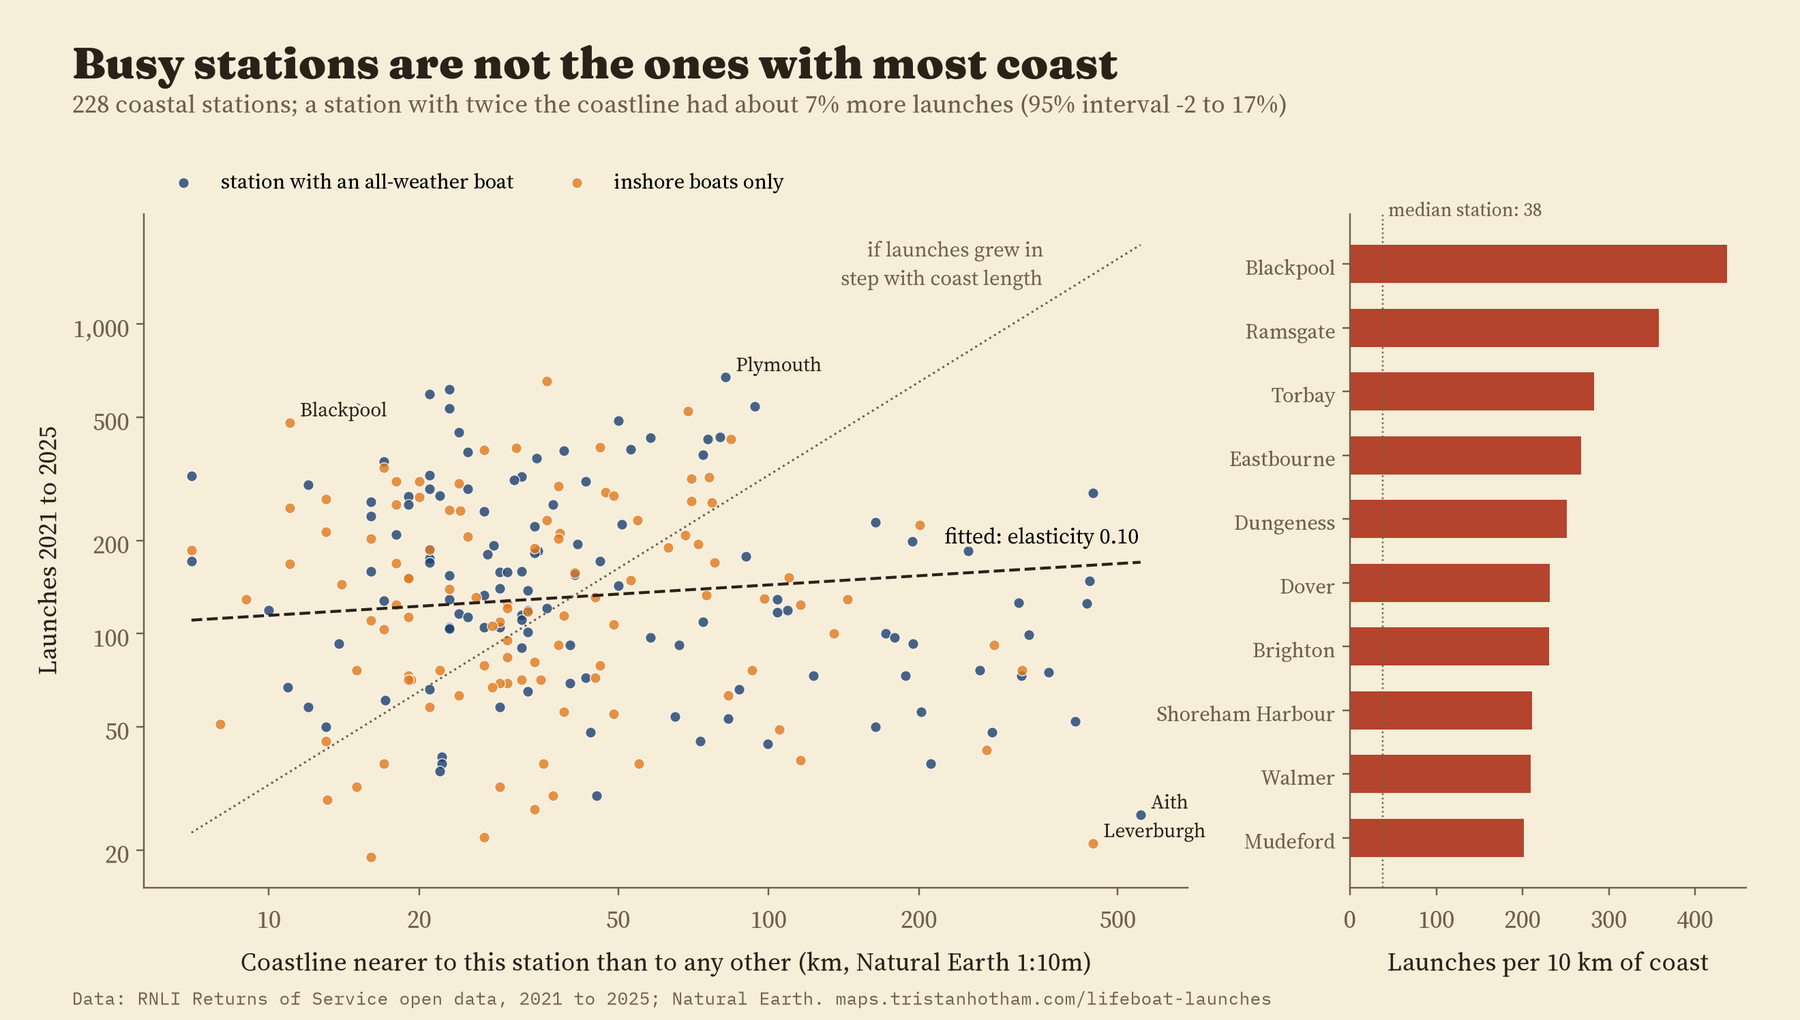
I gave every kilometre of coastline to its nearest lifeboat station. A station with twice as much coast had only about 7% more launches, a difference the data cannot tell apart from none. The busiest stations for their stretch of coast are on crowded shores: Blackpool, Ramsgate, Torbay and Eastbourne. The quietest are in Shetland, Harris, the north-west Highlands and the west of Ireland, where one station is nearest to hundreds of kilometres of ragged coast. Coast length on its own is a poor guide to where the lifeboats are needed. (Coast length is slippery anyway: measure it on a more detailed map and it grows, which is why I checked the result at two map scales.)
Flat, with shifting labels
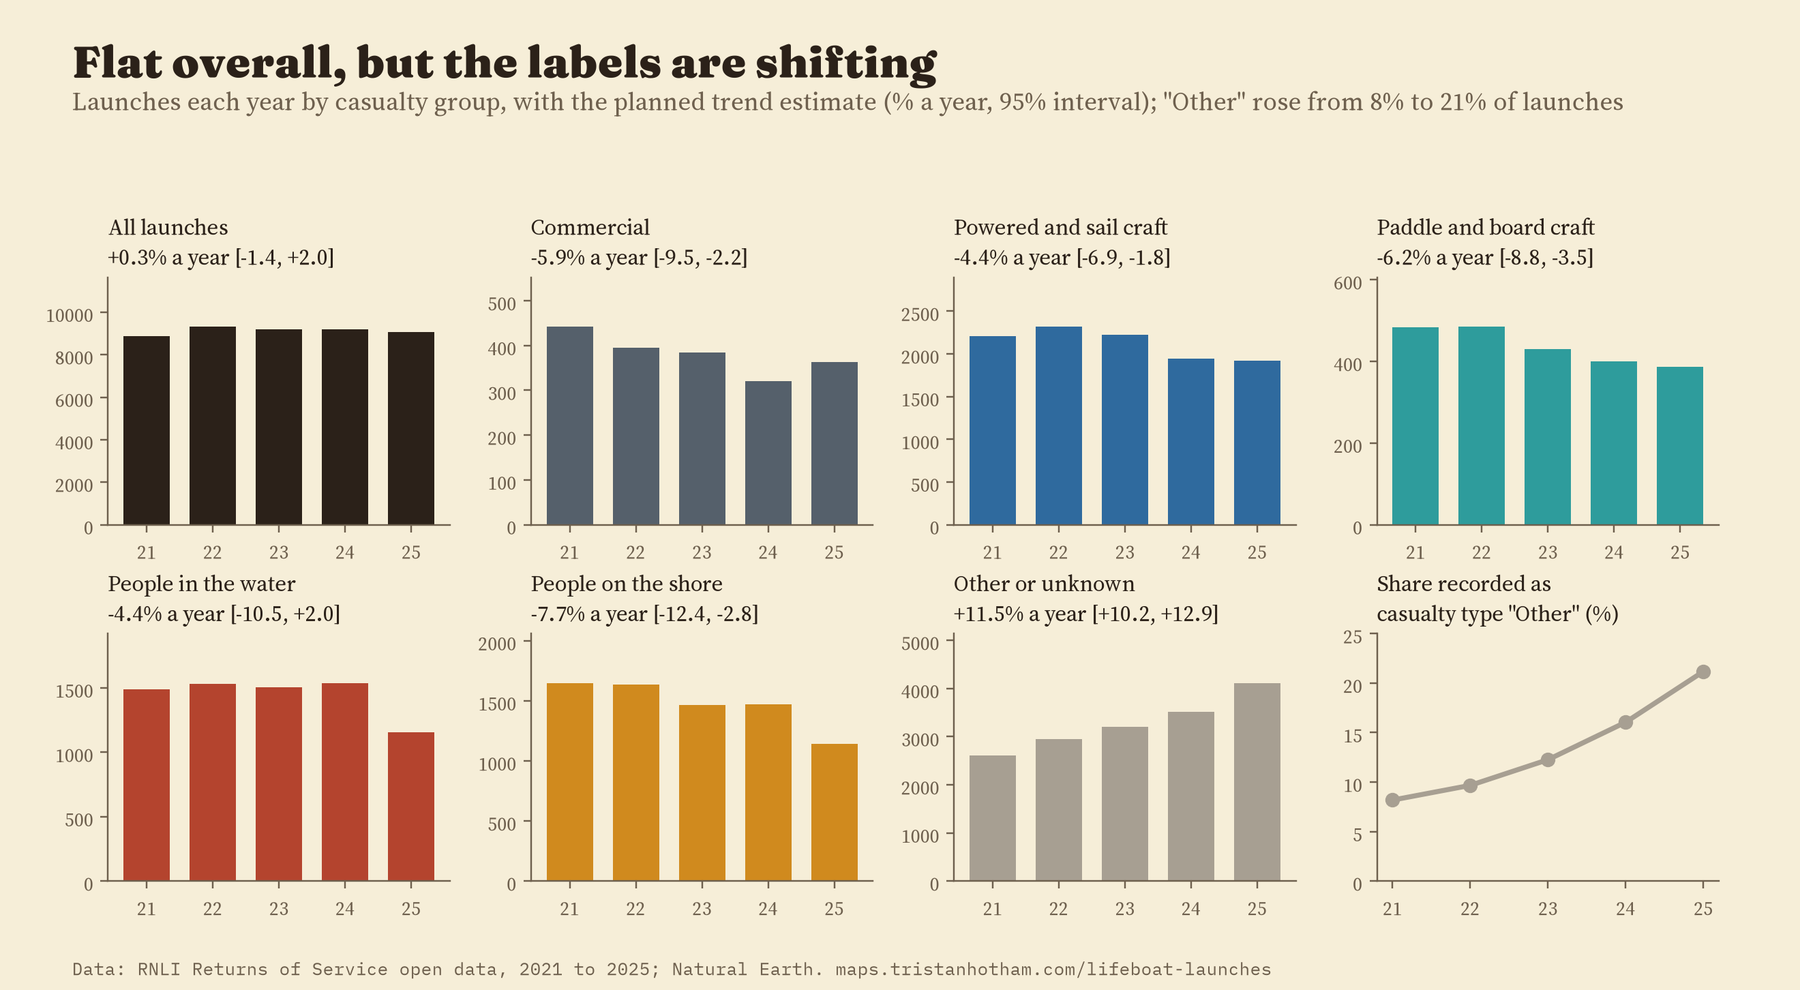
The total hardly changed: 8,883 launches in 2021 and 9,080 in 2025. I expected paddleboarding to push launches up, but launches to paddle and board craft fell by about 6% a year, and paddleboards on their own showed no clear trend either way. There is a catch, though. Over the same years the share of launches recorded with the casualty type “Other” rose from 8% to 21%. Some of the falls in other groups may simply be launches labelled differently, so I would not read them as real declines.
How I did this
The launch records are the RNLI’s Returns of Service, from its open data portal. I wrote down the questions, the comparisons and the checks before computing any of the results, and I report what came out, including where my expectations were wrong. Distances are straight lines from the station to the incident, not the route the boat took. The comparisons of boats and casualties are made within each station, and the two main ones (all-weather against inshore boats, commercial casualties against people in the water) hold when I drop the river and lake stations, the corrected positions, launches stood down before arriving, or each region in turn. The paper has the details.
Some things this cannot tell us. A launch is not an incident: two boats sent to one yacht make two records, and many emergencies are handled by coastguard helicopters, lifeguards, other services or passers-by. The records do not say how many people were on the water, so busier summers partly reflect more people out. Positions are as recorded by the crews. And because the RNLI’s licence does not allow the individual records to be shared, the map and the data files show launches counted on 1 km squares.
Notes and sources
- RNLI Returns of Service and RNLI Lifeboat Station Locations, RNLI open data portal, retrieved 2026, under the RNLI open data licence. Coastlines from Natural Earth (public domain). Base map on the interactive page: OpenFreeMap, OpenStreetMap contributors (ODbL).
- Background: M. Wright, How the RNLI is using geomatics to save lives, RICS Land Journal (2021); Open Data Institute, Case study: sharing data to improve the safety of lives at sea (2021); B. Mandelbrot, How long is the coast of Britain?, Science (1967).
- I wrote the text, with drafting and editing assistance from Claude (Anthropic), which also helped prepare the analysis code. I reviewed and checked all text and results.

