
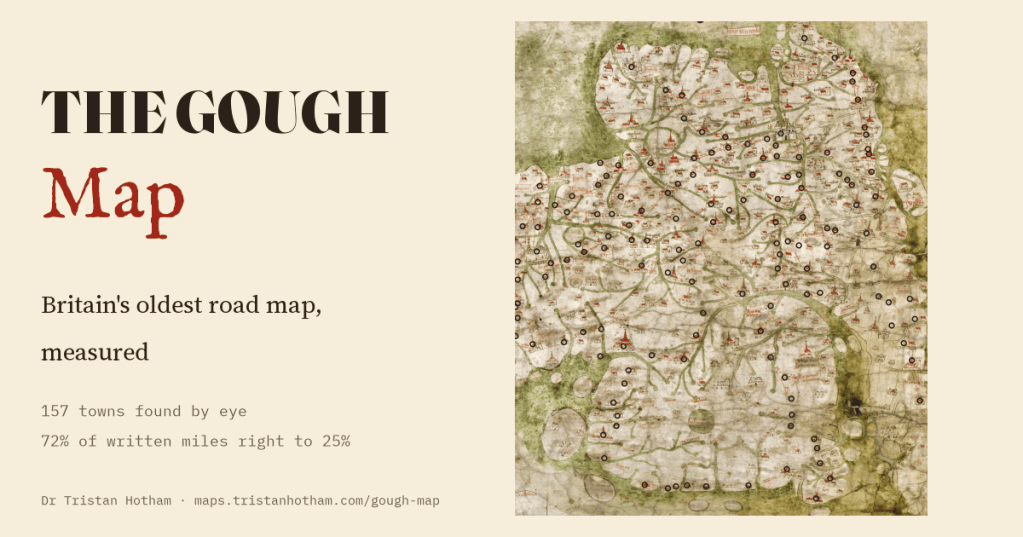
The Gough Map, drawn about 1360, is the oldest surviving road map of Britain. It lies on its side, it puts Wales in the wrong place and it squashes Scotland. I found 157 of its towns by eye and measured it against the real island and its real roads. The drawing wanders. The numbers written along its red roads, mostly, do not.
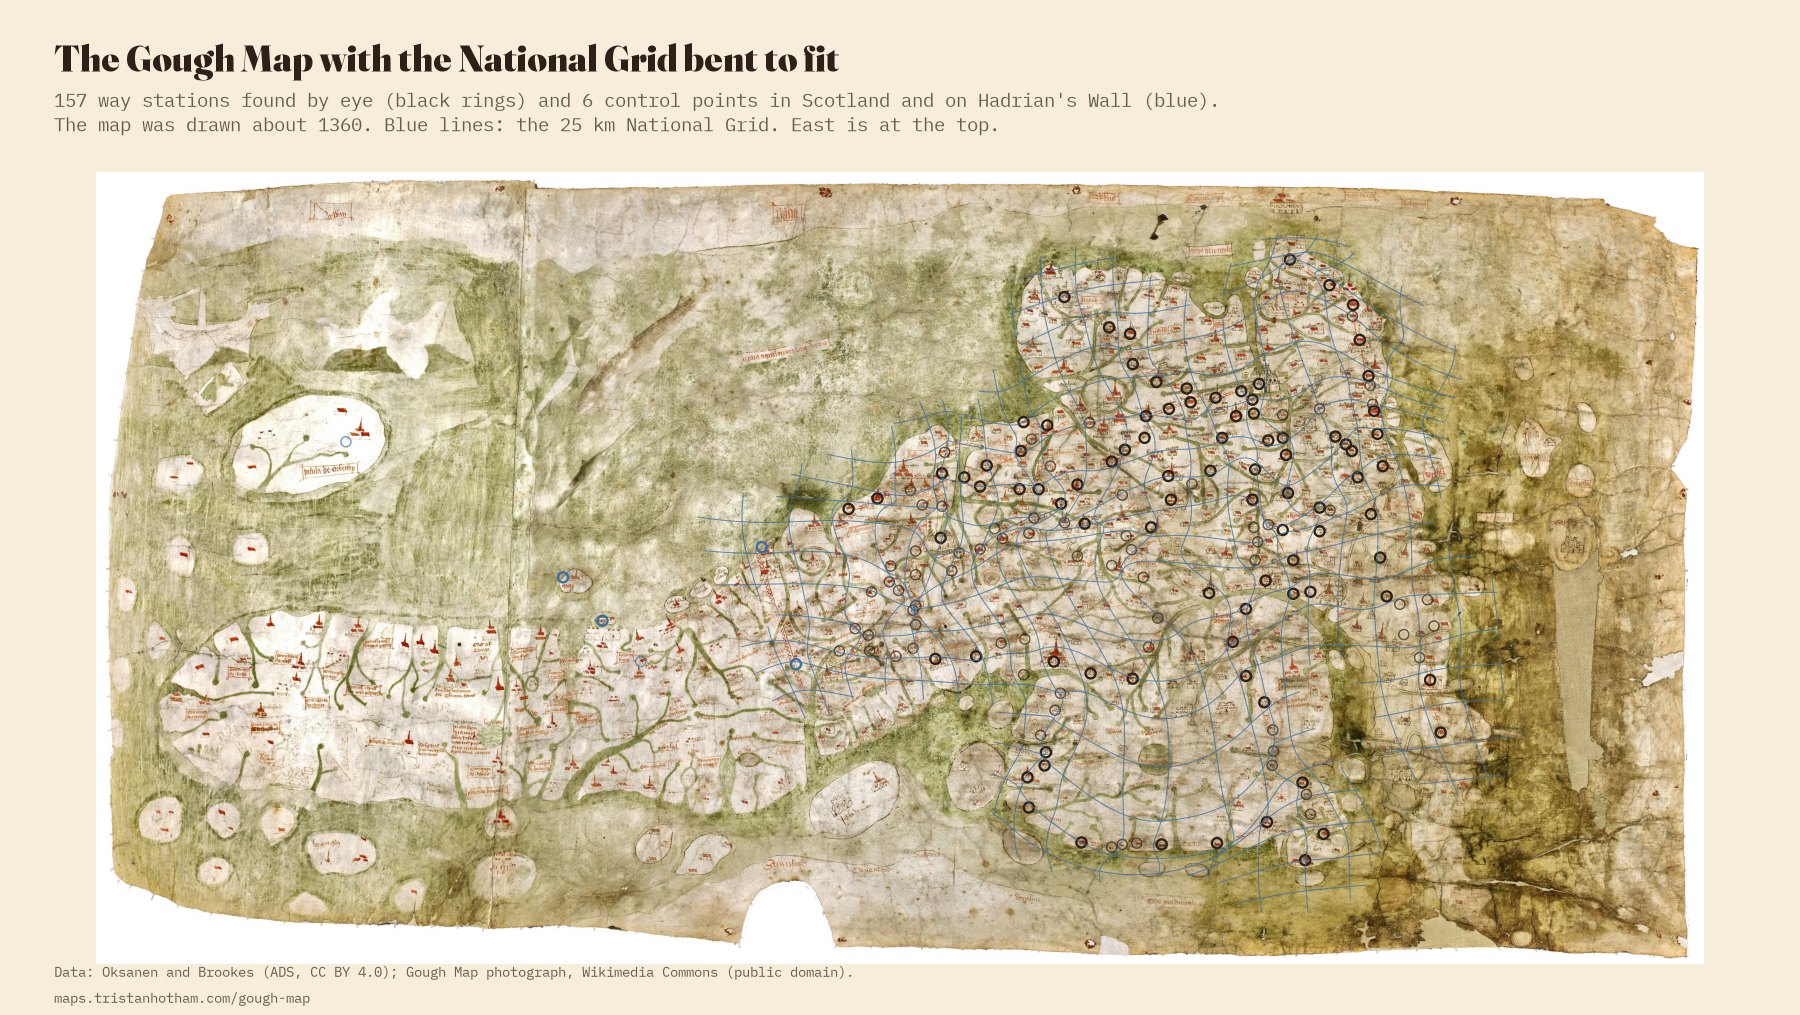
In the Bodleian Library in Oxford is a map of Britain on two pieces of parchment, about 115 by 56 centimetres. Nobody knows who made it. It takes its name from Richard Gough, the antiquary who bought it in 1774. East is at the top, so Scotland trails off to the left, Wales bulges out at the bottom and Kent sits up in the top right corner. Rivers wriggle across it in green, and towns are little houses and churches with red roofs.
What makes it special are thin red lines between the towns, across England and Wales, and beside most of them a Roman numeral: x, xii, xvi. Miles to the next town. Nothing older shows the roads of Britain like this. The historians Eljas Oksanen and Stuart Brookes have recently published a database of those lines: 179 way stations, 188 red lines with their numbers, and the real road each line most likely follows, traced on the ground and dated. It gives where each town really is. It does not give where the map draws it, so I found 157 of them on a photograph of the map, zooming in town by town.
On its side, and mostly right
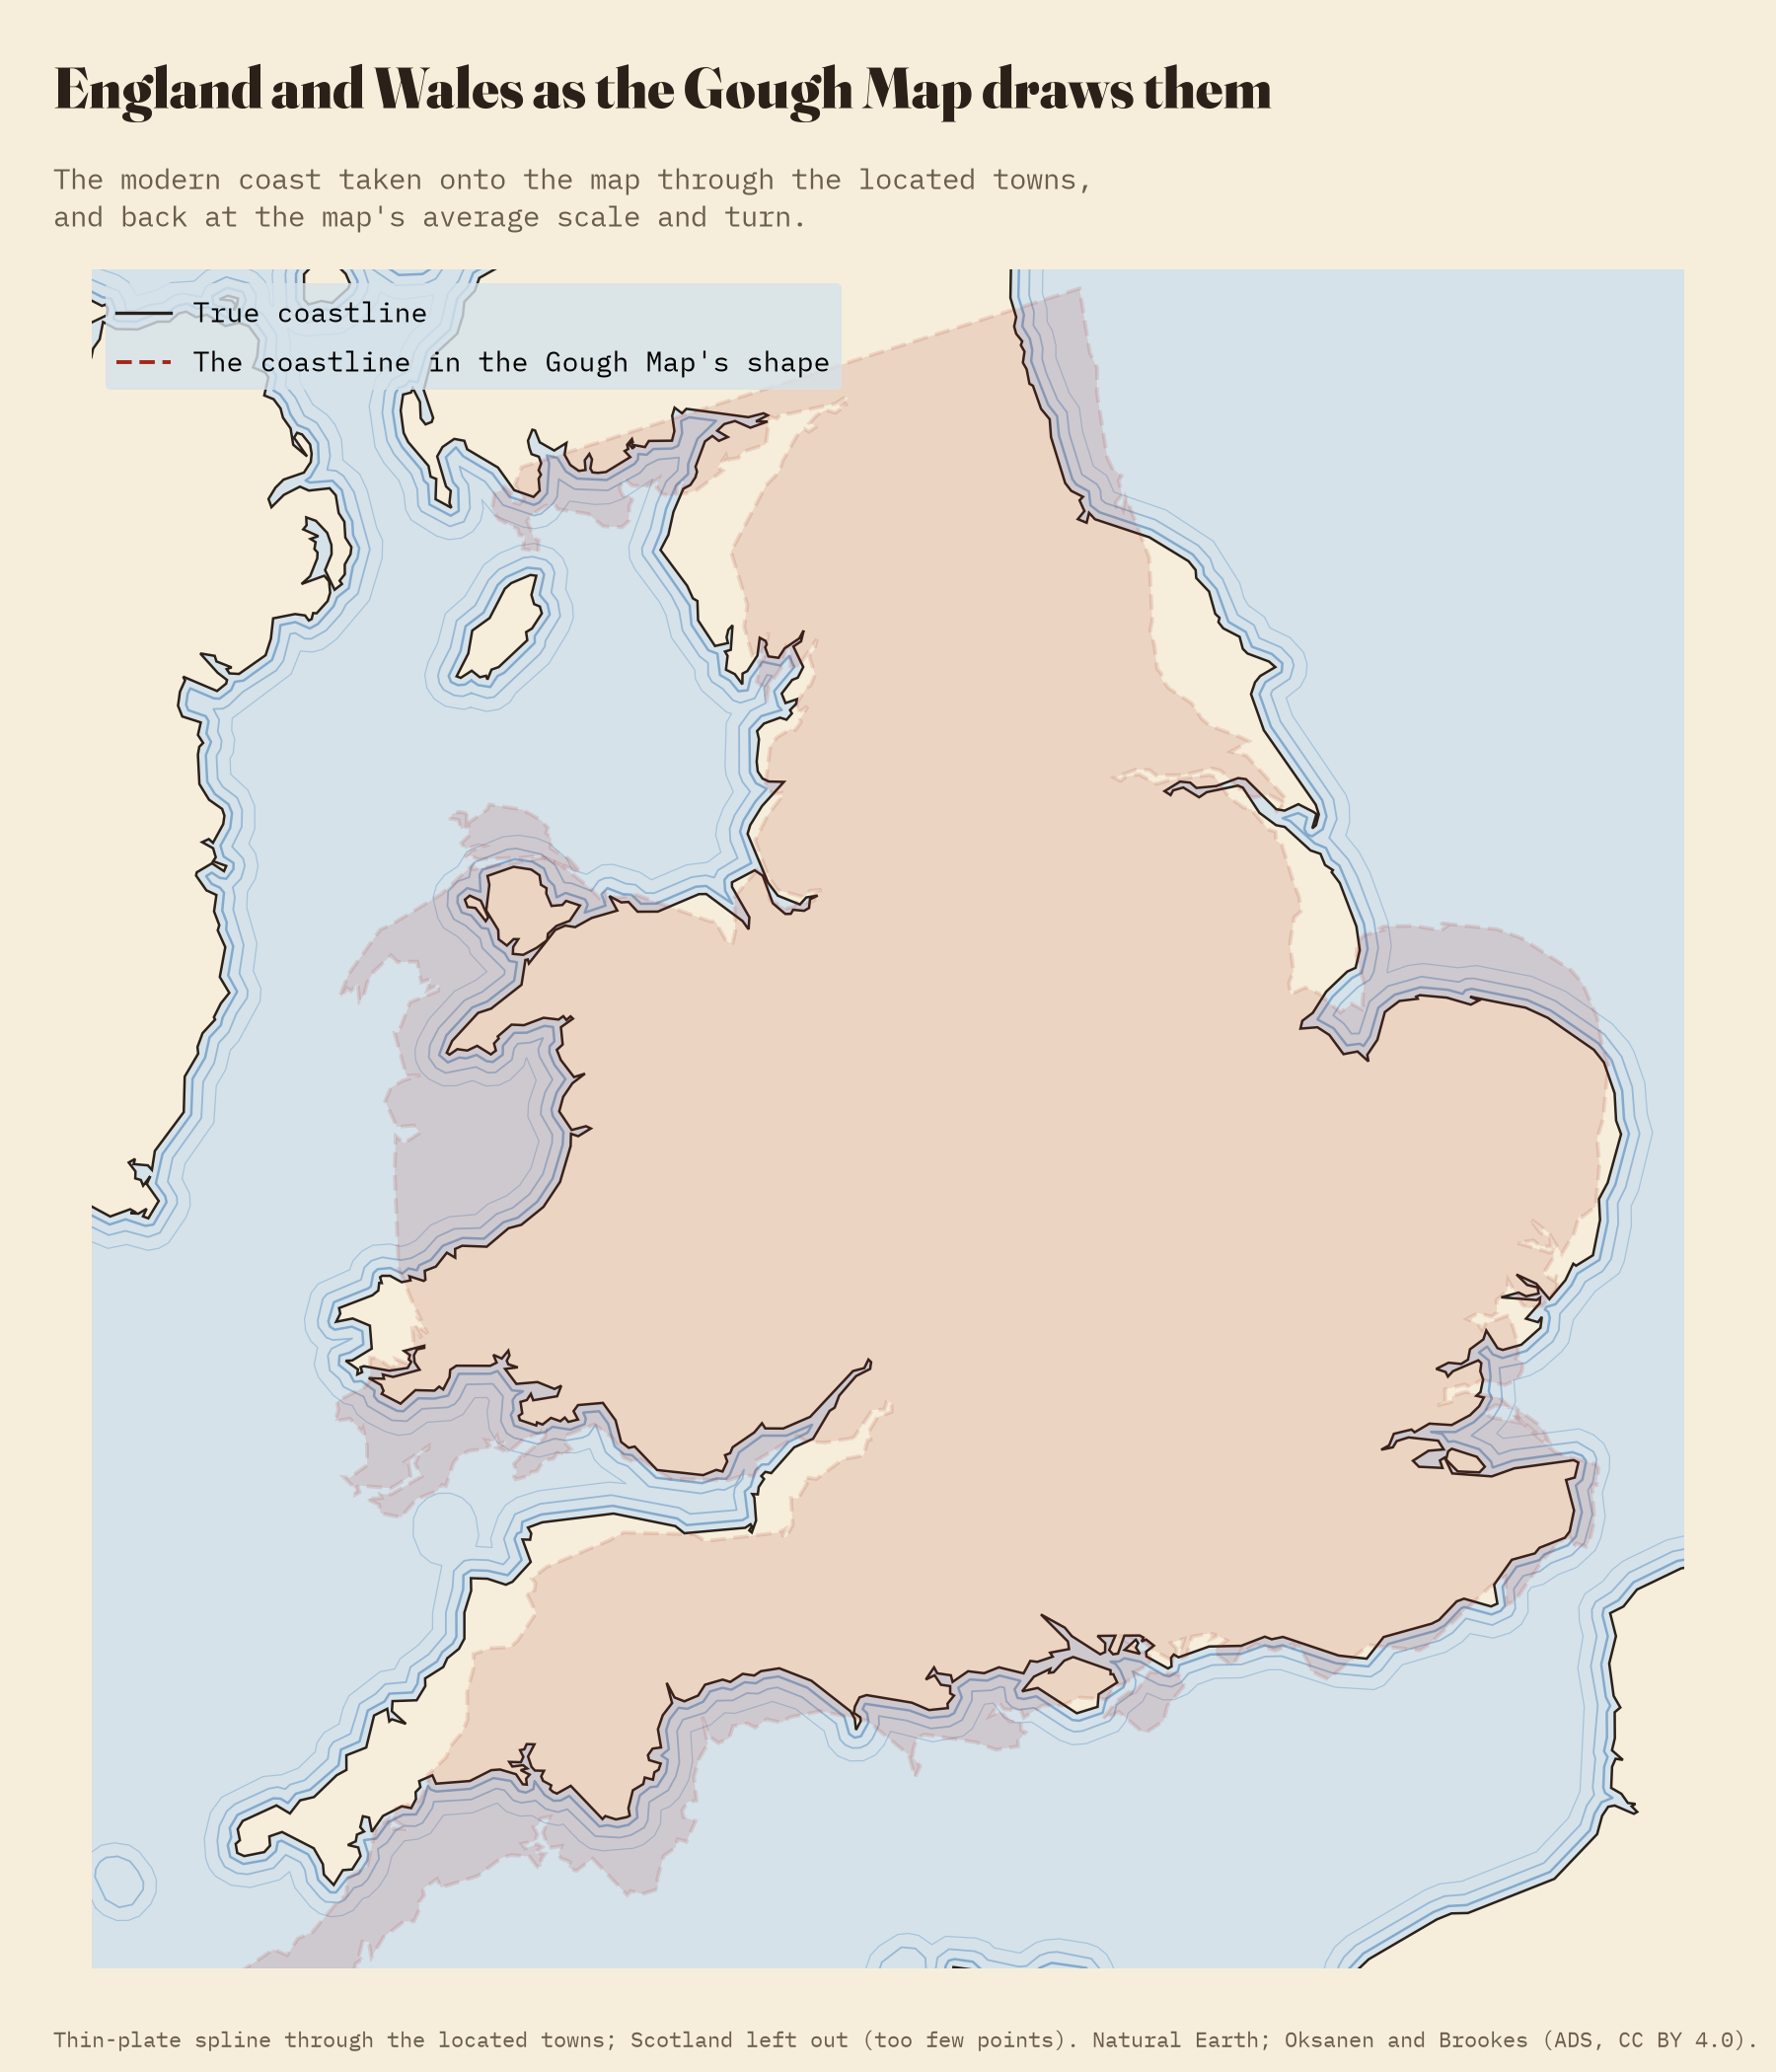
Lay the map over the real island with one scale and one turn, the best any flat copy could do, and it comes out turned 95°: east at the top, leaning a little further. After that, the typical town is 18 km from where it ought to be, and 76% are within 25 km. For a map drawn with no survey and no compass, that is very good.
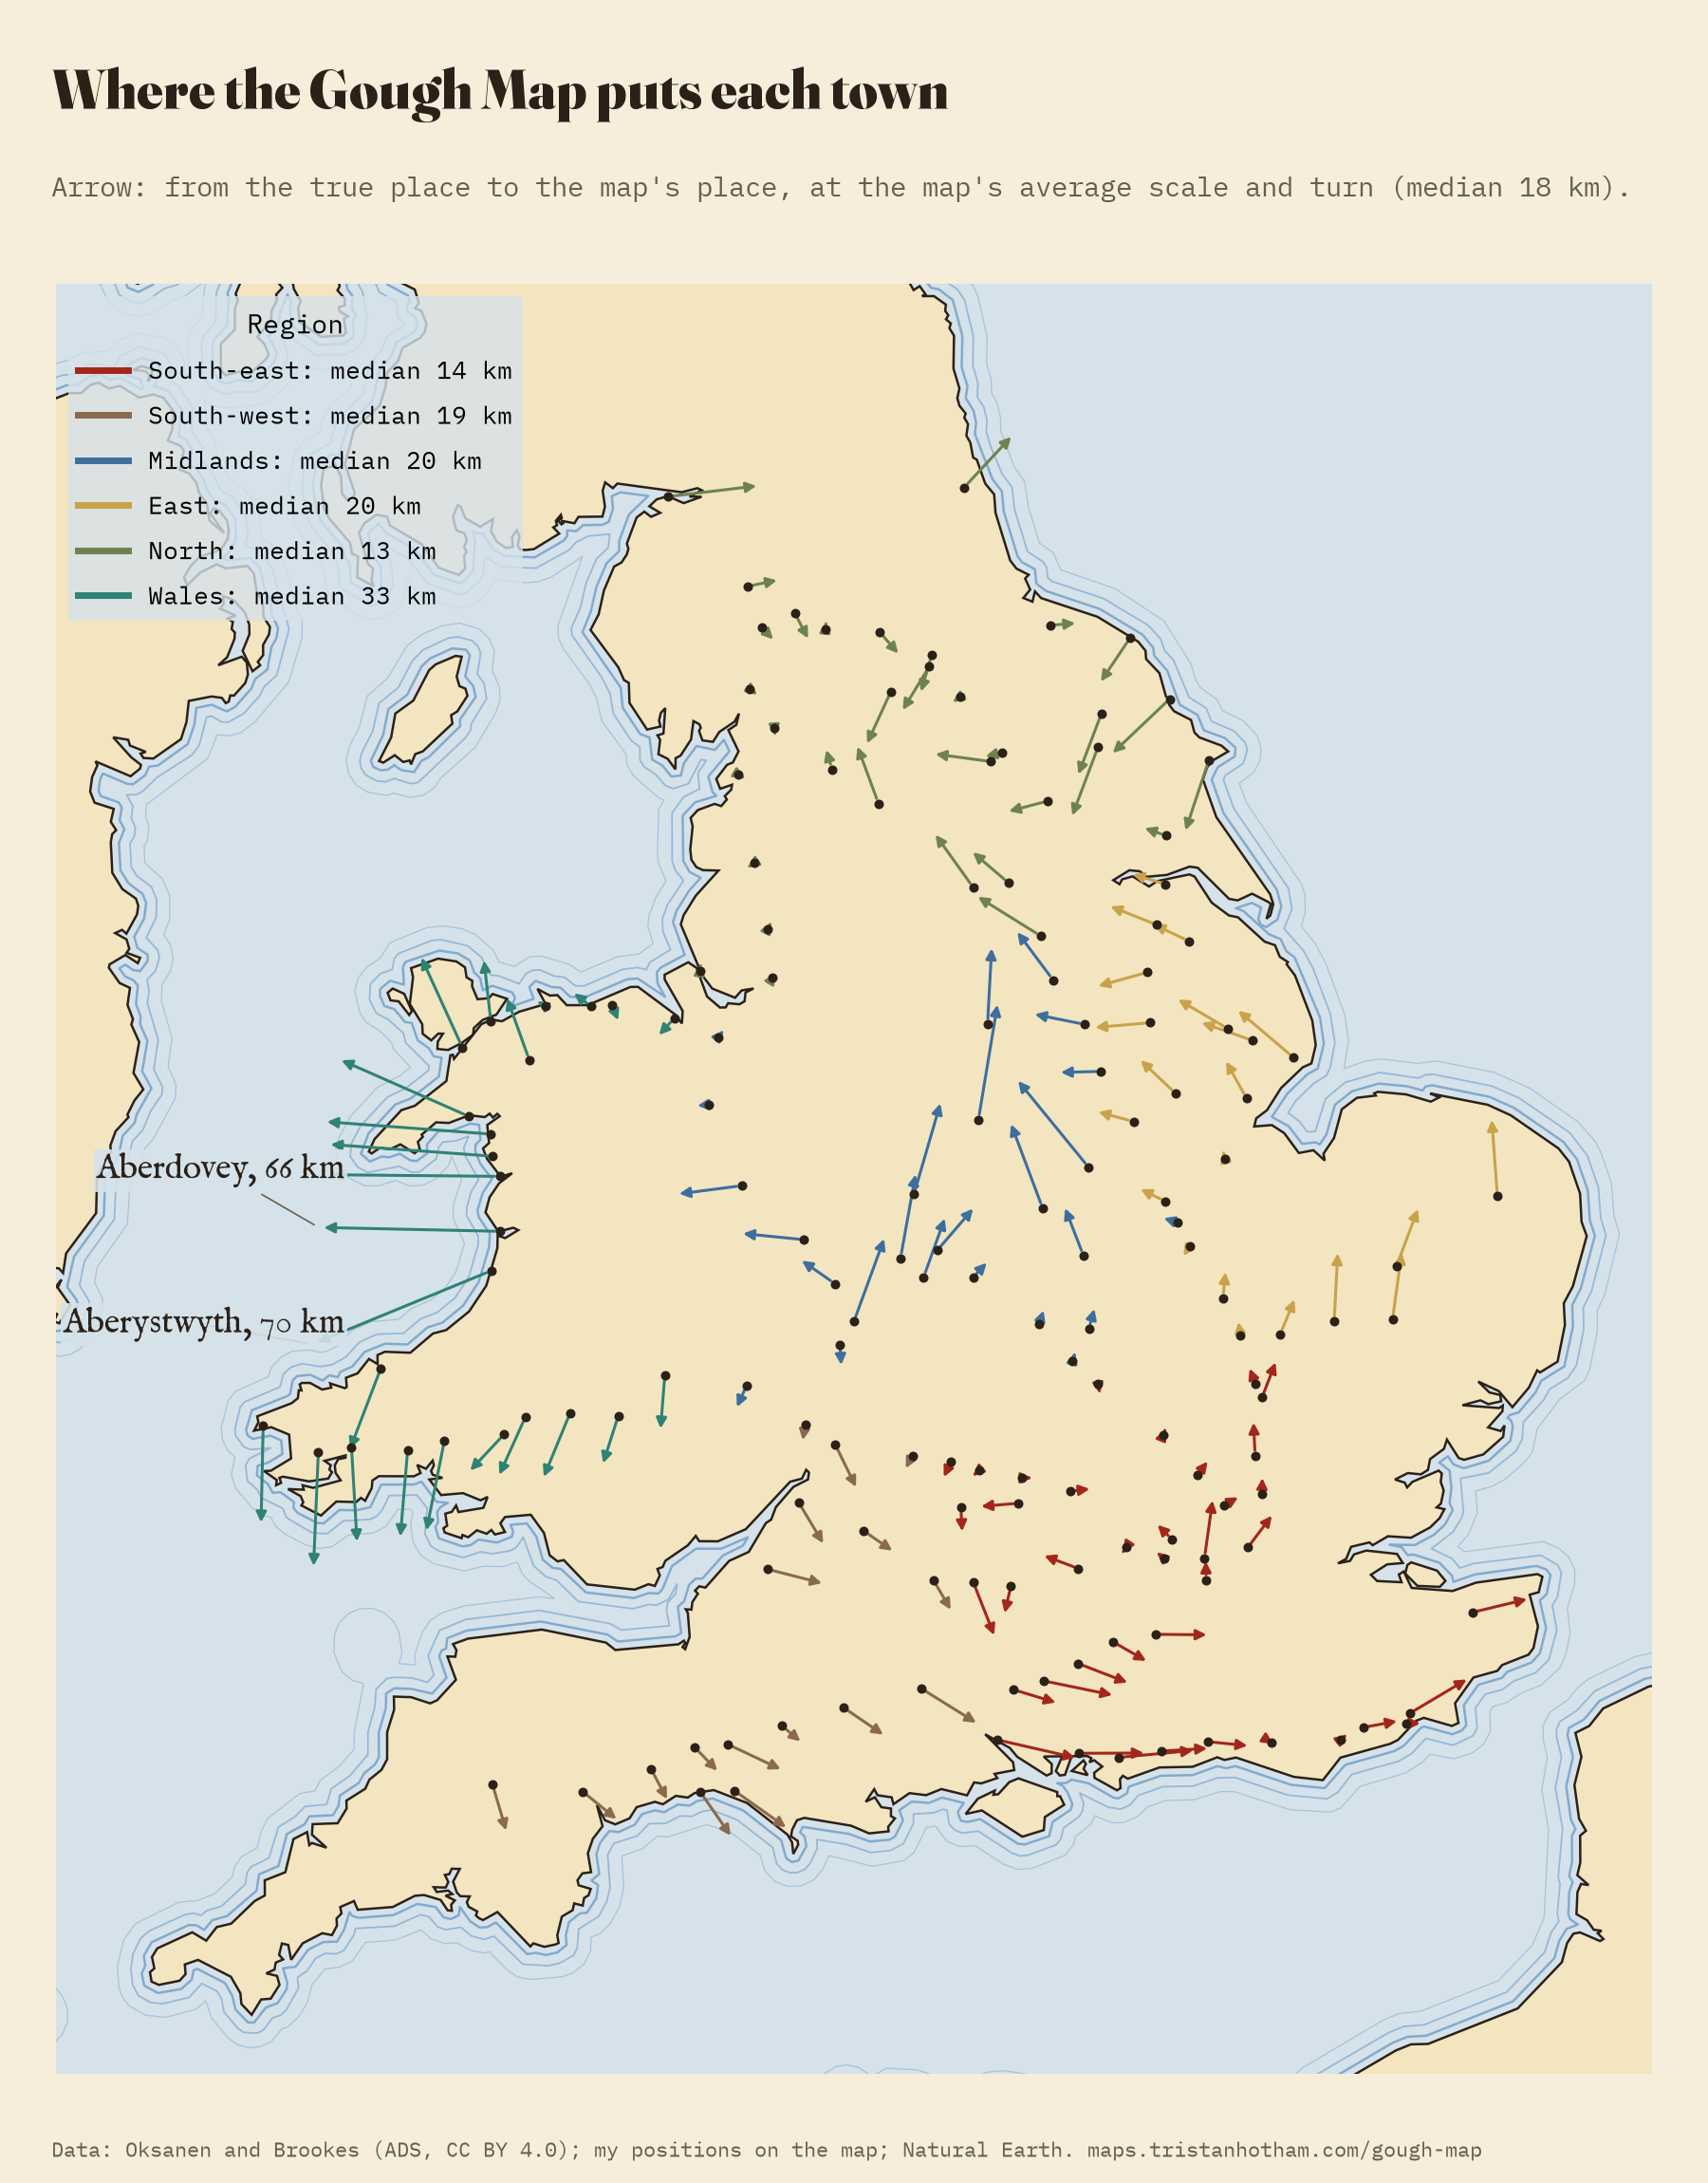
The errors have a pattern. England’s north and south-east are drawn best, with typical errors of 13 and 14 km. Wales is the odd one out: it is drawn at 1.22 times the scale of the rest, as if under a magnifying glass, and its towns are a typical 33 km out. The coast of Cardigan Bay is pulled furthest, with Aberystwyth 70 km from its place. Scotland, with no red lines at all, is squashed: Orkney sits 356 km from Hadrian’s Wall on the map but 450 km in reality.
A mile of 2.08 kilometres
Then the numbers. 169 of the red lines still carry a figure I could use. Following each along the real road that Oksanen and Brookes traced, one written mile comes out at a median 2.08 km of road, about 1.29 of today’s miles. That is no mistake: the map’s mile was an older, longer, customary mile, long before the statute mile of 1593.
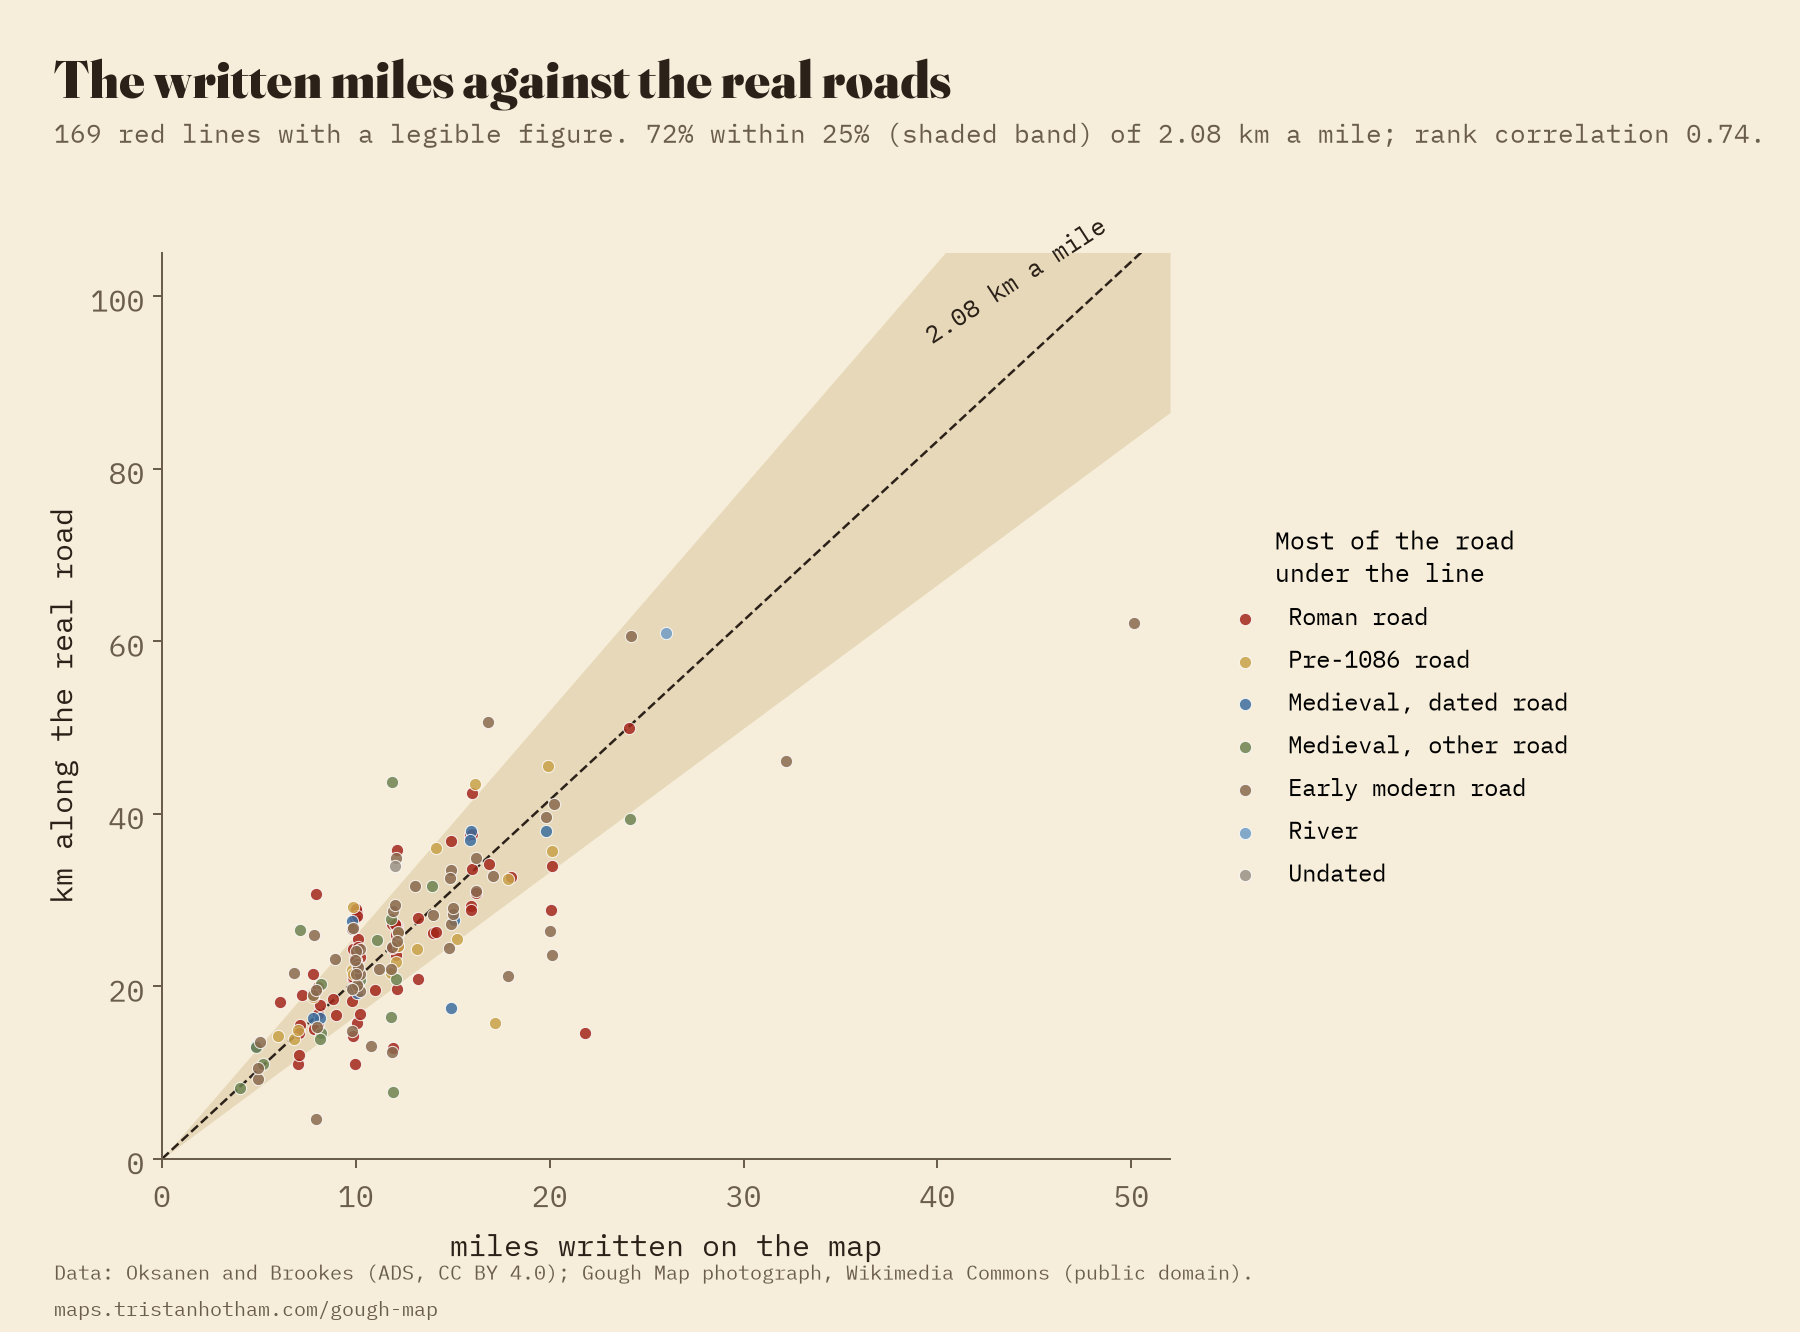
At that rate, 72% of the figures are within 25% of the real road. The misses look like slips of the pen: Rye to Winchelsea is written as 8 miles for 4.7 km of road.
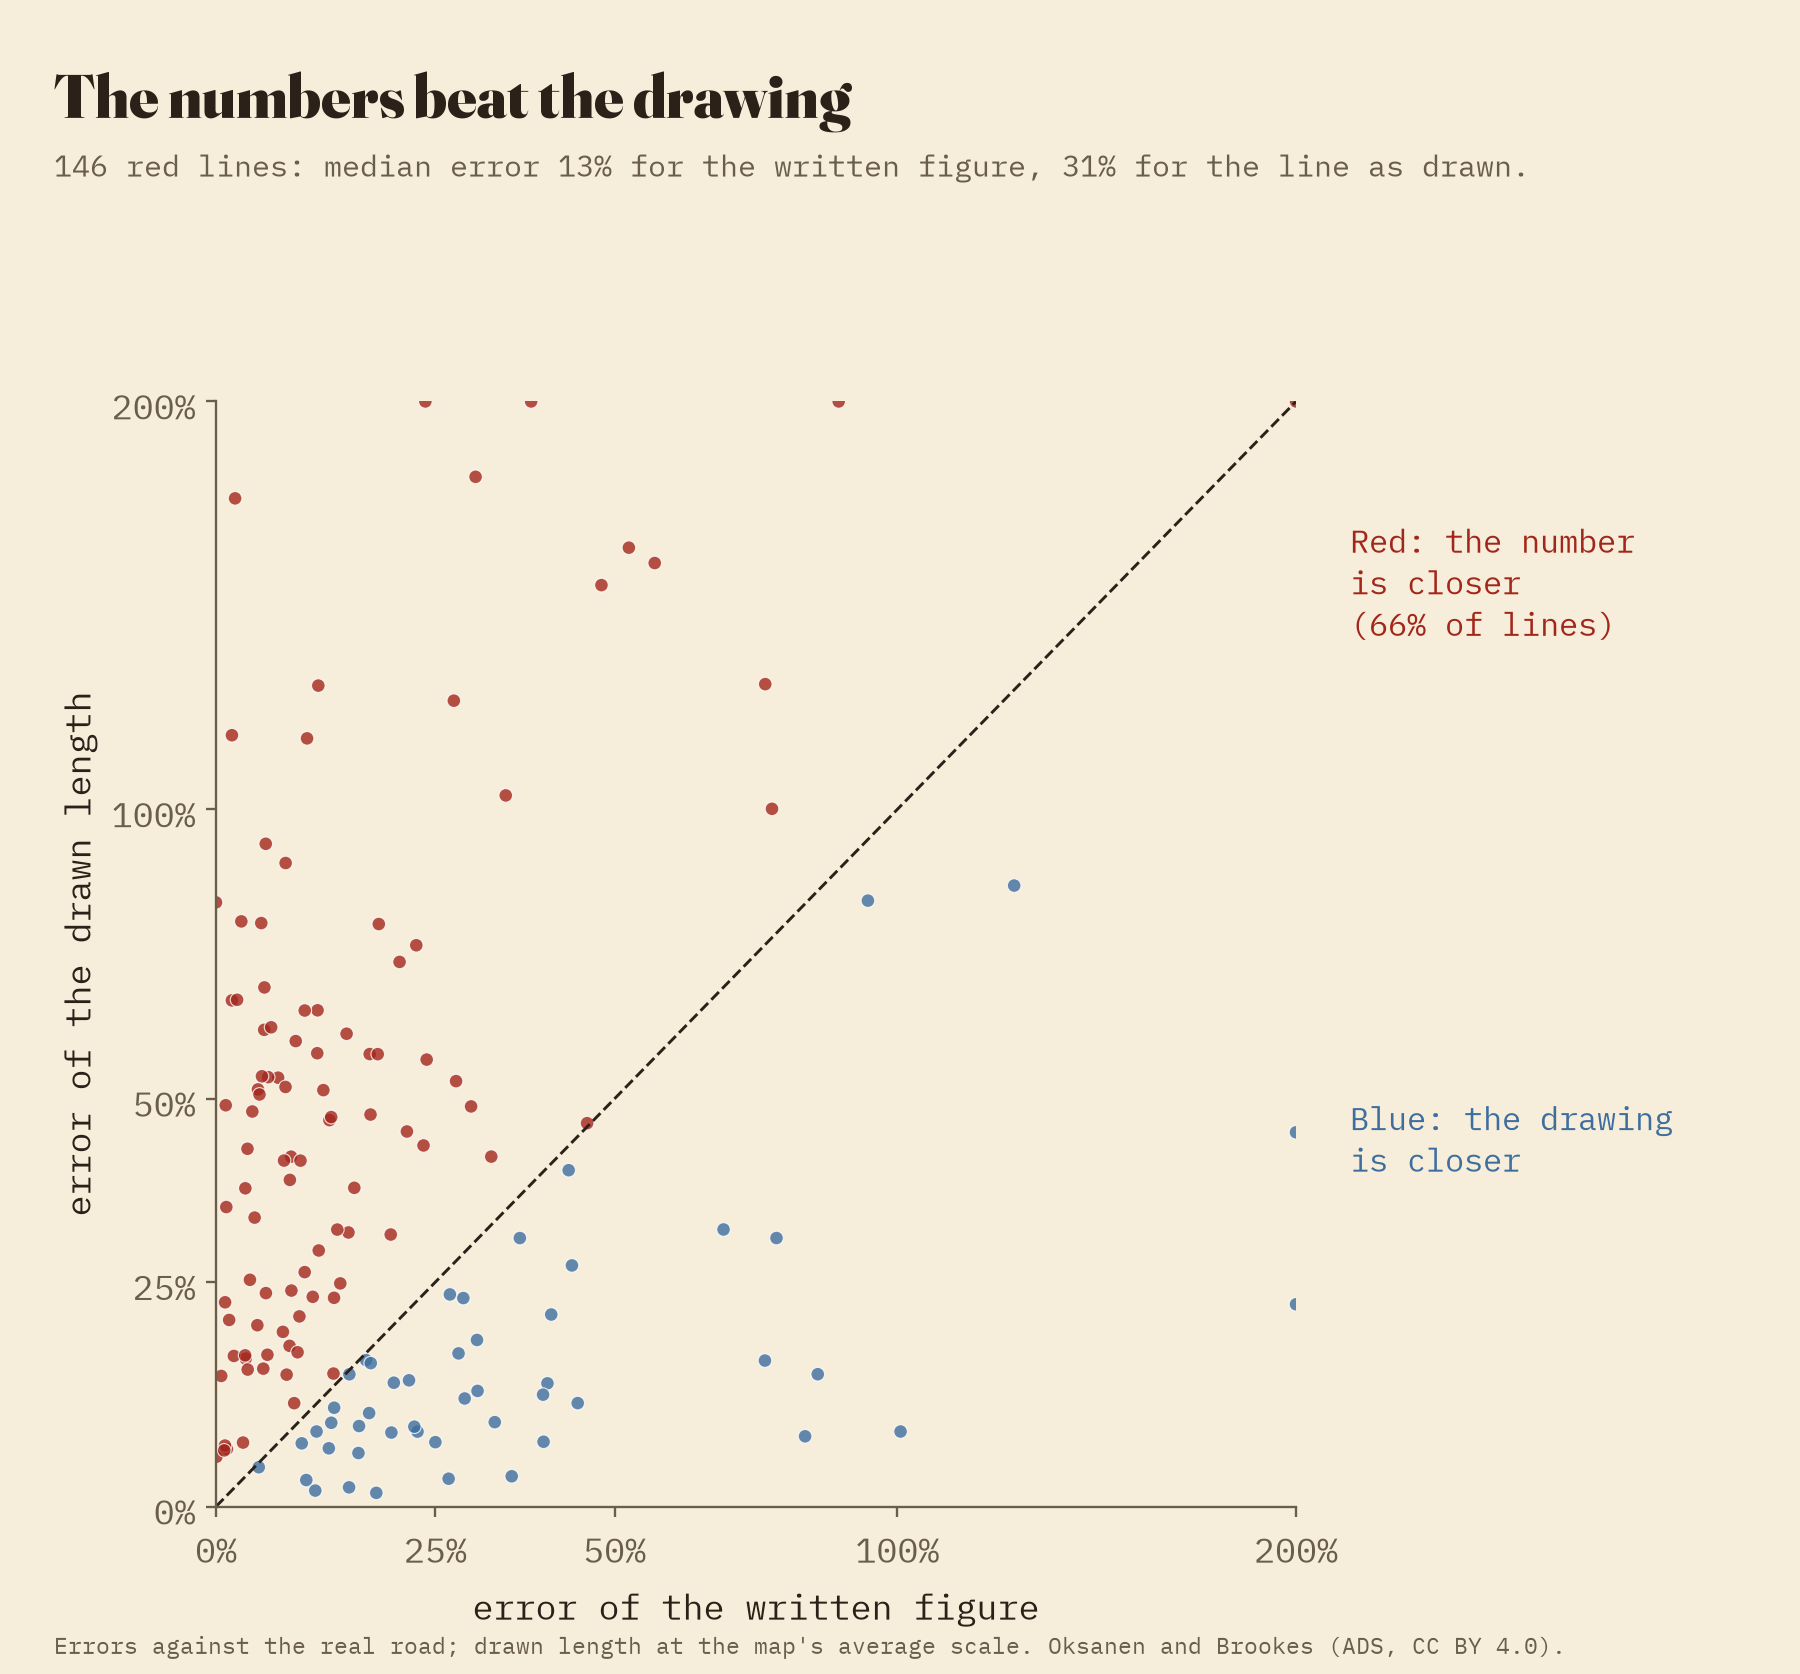
The drawing puts a town tens of kilometres out. The number beside the red line gets the road right.
Here is the strangest part. For 146 red lines I can compare the length of the line as drawn with the number written beside it. The number is wrong by a median 13%, the drawing by 31%, and the number is the better guide on 66% of lines. Whoever compiled the red lines knew the roads as distances, not as shapes.
London to York
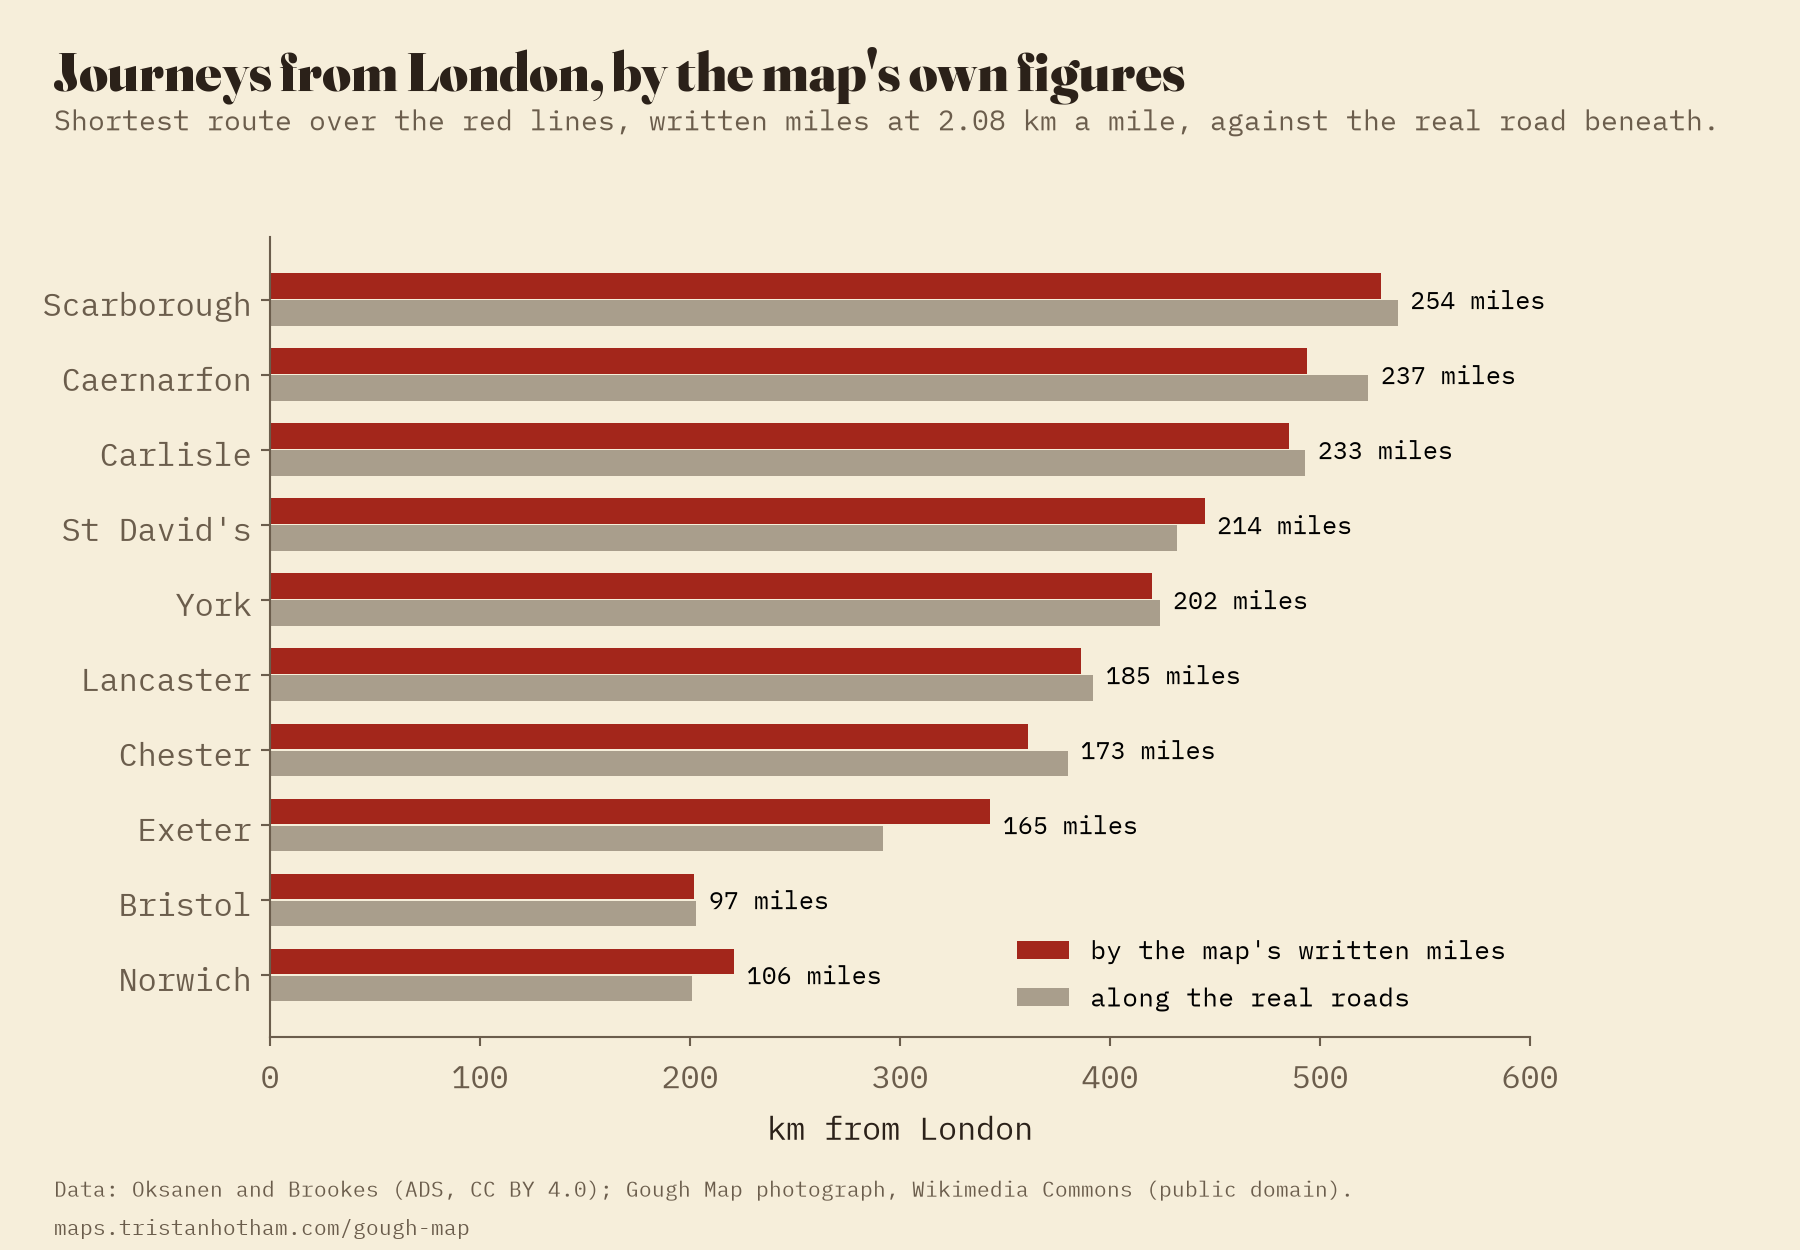
Could a traveller have used it? Adding the figures along the red lines from London, York is 202 miles away: 420 km at the map’s rate, against 424 km along the real roads. Bristol comes to 202 km for 203, Carlisle 485 for 493. Only the road to Exeter is far out, 343 km for 292.
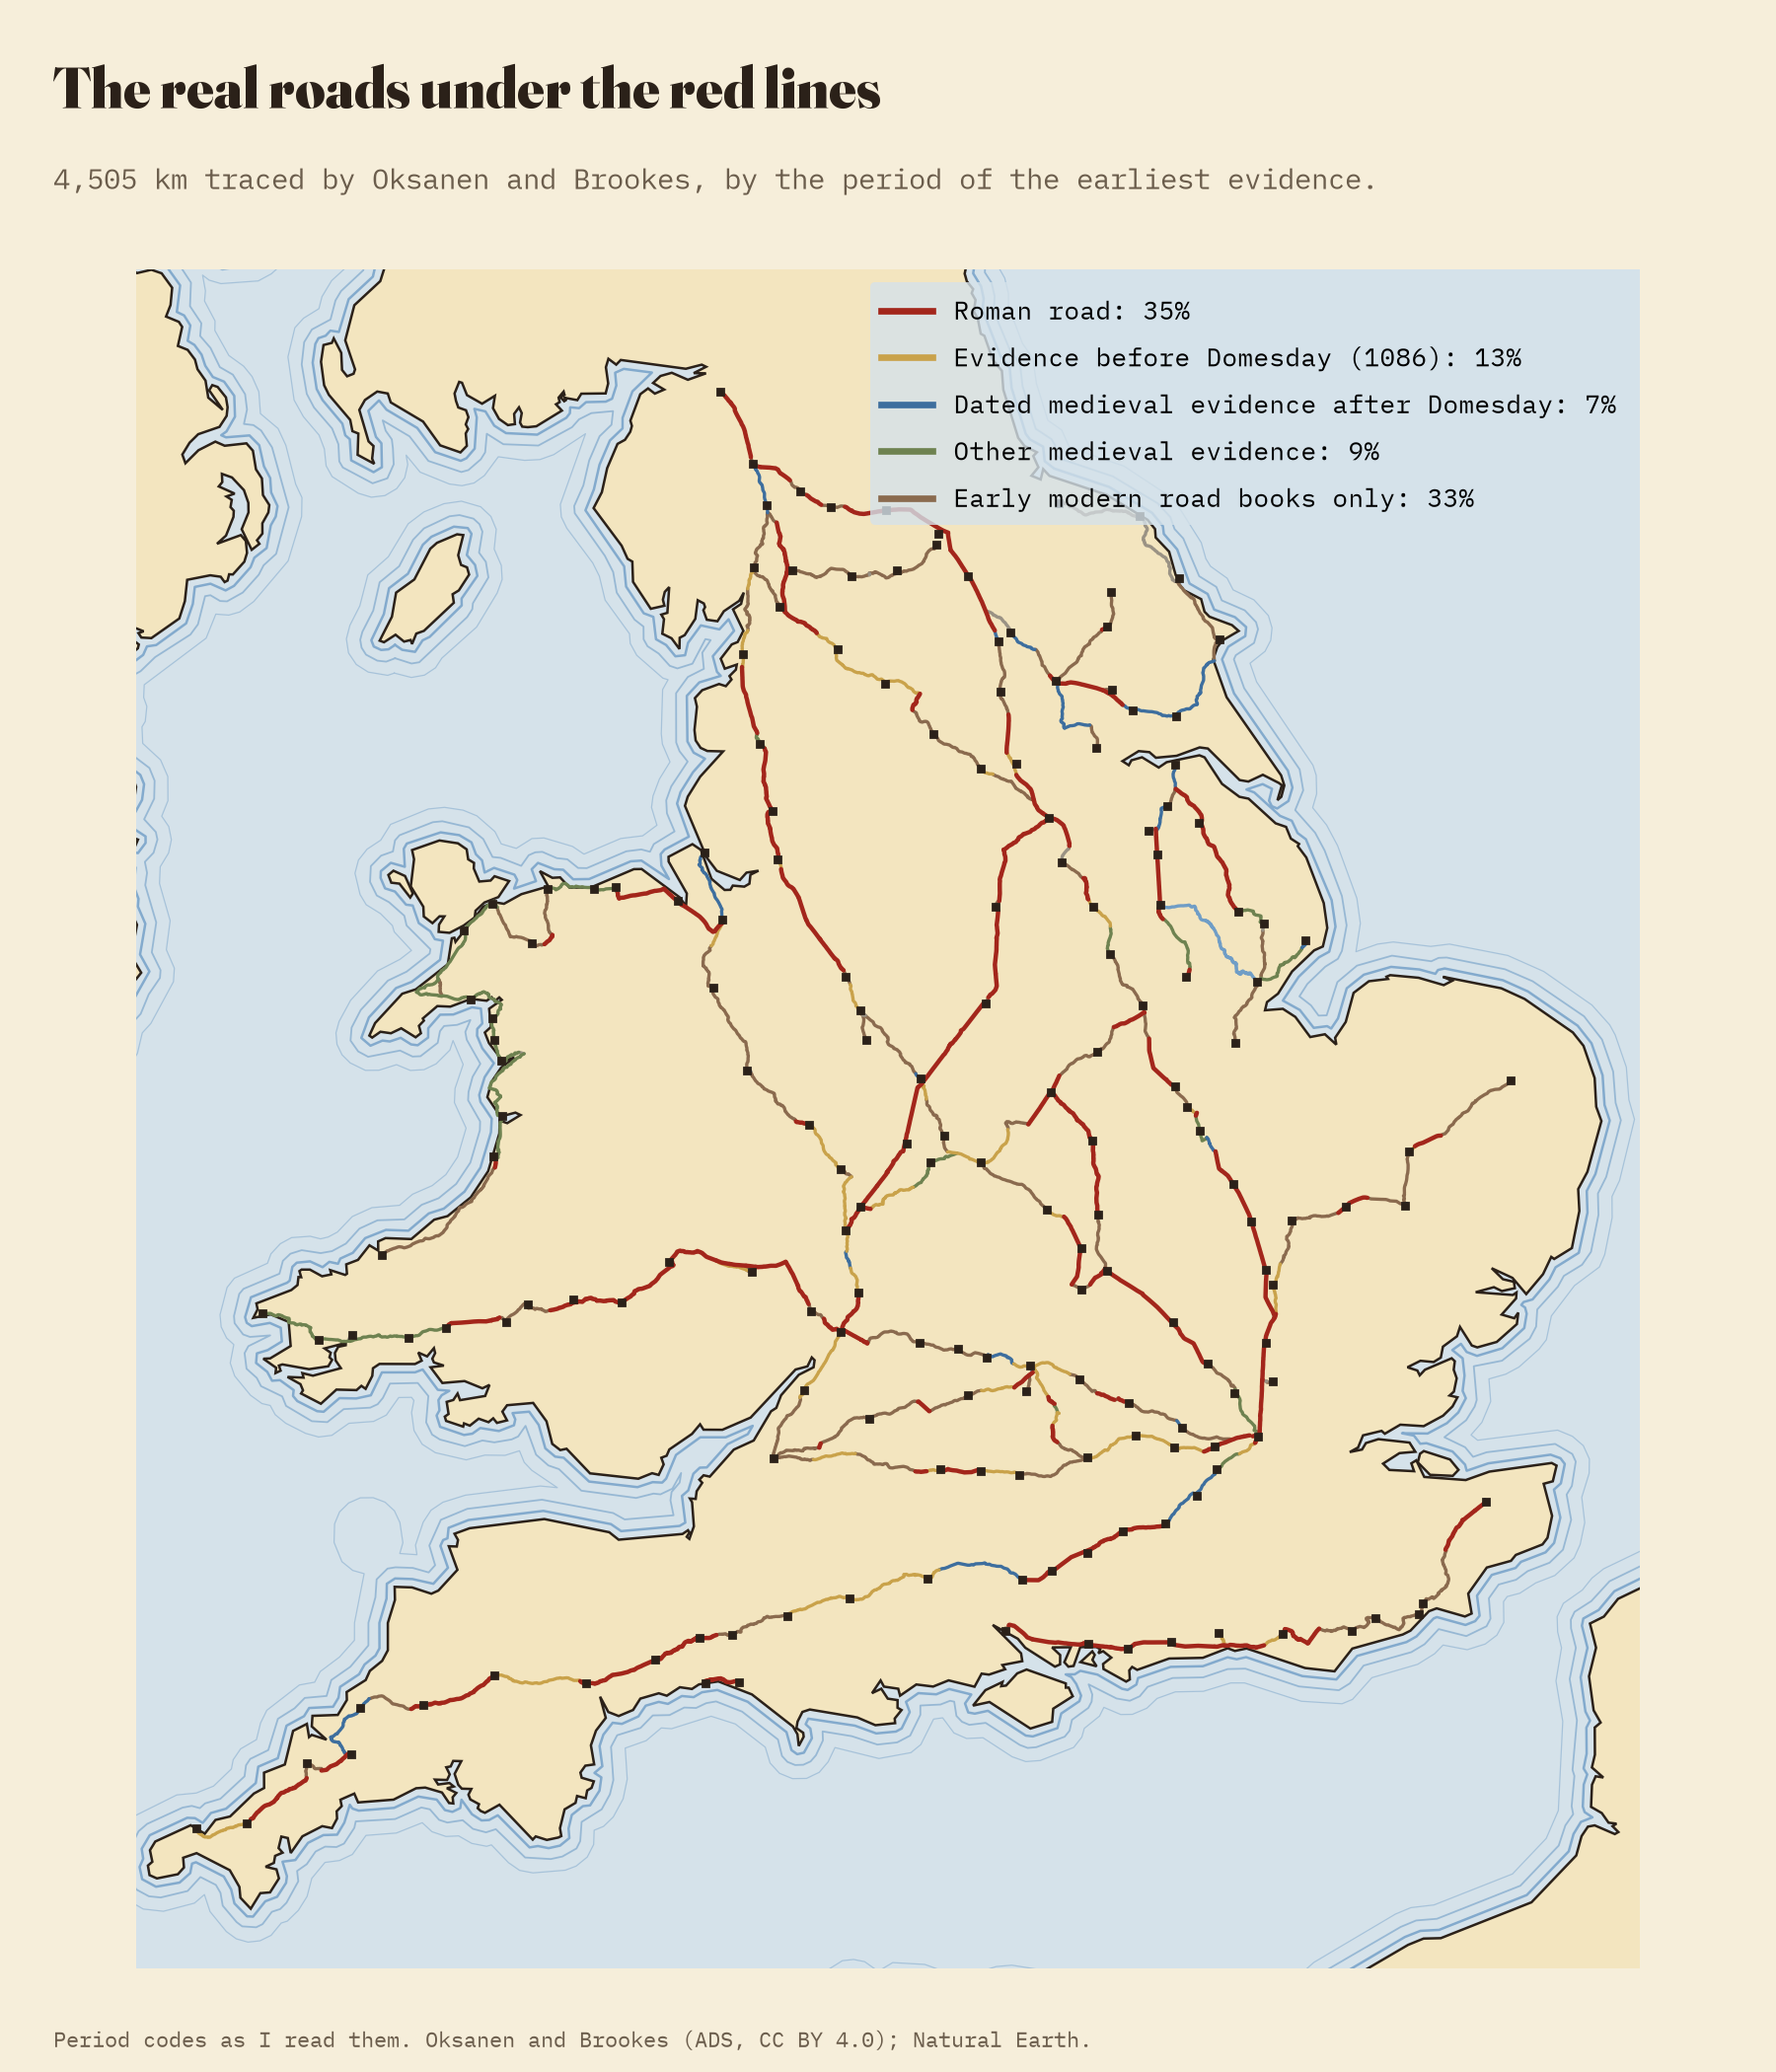
And the roads themselves? Of the 4,505 km of real road under the red lines, 35% is Roman. Another 29% has medieval evidence, some of it older than Domesday Book, and 33% is otherwise known only from the road books of the seventeenth century and later. The age of the road makes no difference to how good the figure is.
How I did this
The red lines, the towns and the traced roads come from Oksanen and Brookes’ database at the Archaeology Data Service (CC BY 4.0). Where each town is drawn on the map I read myself from a 12,224 pixel photograph: 33 by a label I could read, 56 by the right drawing on the right red line, and 68 with real doubt. 22 I could not find, mostly in worn Cornwall. I fitted the towns to their real places with one scale and one turn, and with a smooth bending surface for the grid and the bent island. Road distances follow the traced roads between each pair of towns. The roads’ periods are numeric codes in the database that I read from its notes. The interactive page has both maps side by side, every town and line, and a slider that bends the island into the map’s shape.
Notes and sources
- Oksanen, E. and Brookes, S. (2024) The Routes and Roads of the Gough Map: GIS Database [data-set]. York: Archaeology Data Service [distributor]. https://doi.org/10.5284/1124312 (CC BY 4.0).
- The Gough Map, about 1360, Bodleian Library, MS. Gough Gen. Top. 16. Photograph on Wikimedia Commons, public domain.
- Delano-Smith, C. et al. (2017) New light on the medieval Gough Map of Britain. Imago Mundi 69(1), 1-36. Lilley, K. D., Lloyd, C. D. and Campbell, B. M. S. (2009) Mapping the realm: a new look at the Gough map of Britain (c. 1360). Imago Mundi 61(1), 1-28. Parsons, E. J. S. (1958) The Map of Great Britain circa A.D. 1360 known as the Gough Map: An Introduction to the Facsimile, with “The roads of the Gough Map” by Sir Frank Stenton. Oxford: Bodleian Library and Royal Geographical Society.
- Coastlines: Natural Earth, https://www.naturalearthdata.com/ (accessed 2026; public domain).
- I wrote the text, with drafting and editing assistance from Claude (Anthropic), which also helped prepare the analysis code. I reviewed and checked all text and results.

