
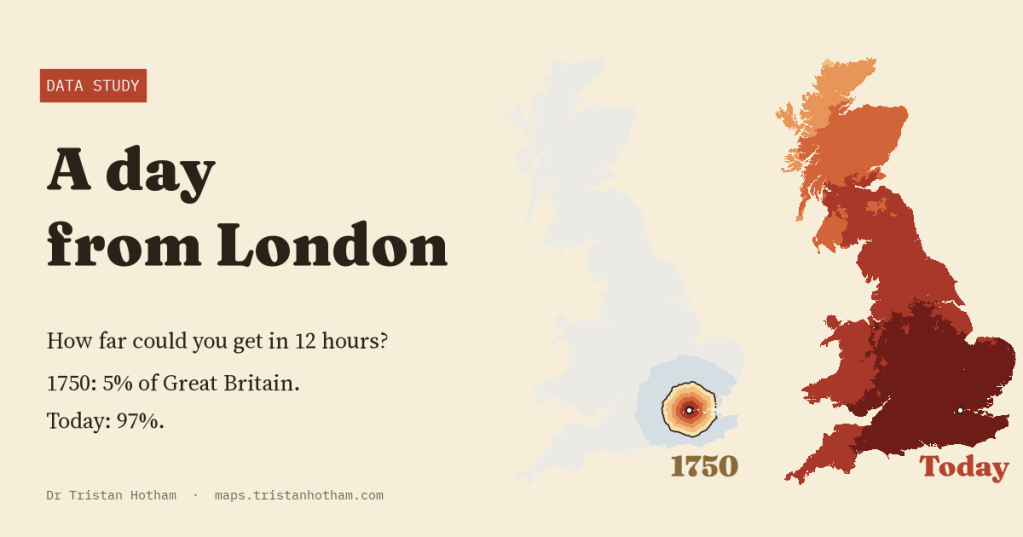
Leave Charing Cross at dawn and travel for twelve hours. How far do you get? In 1750, by stage coach, about 5% of Great Britain was within a day. Today it is 97%. I rebuilt the roads and railways of five eras to draw the edge of that day on a map.
Everyone knows the milestones. In 1754 a coach promised to get you from London to Edinburgh in ten days in summer. In 1837 the Edinburgh mail coach was timed at just over 42 hours. By the early 1900s the Flying Scotsman did it in eight and a quarter hours, and today the fastest train takes four. But a list of journeys between famous places does not show what the whole country looked like from London. Where did a day’s travel end? How much of Britain was inside it?
So I built a model. Britain is cut into 2 km squares, and for each era the squares are joined by the roads and railways of the time: the turnpike roads of 1750 and the 1830s, mapped by historians at Cambridge; the railway lines of 1851; a reconstruction of the network of 1910; and today’s roads and railways. A traveller leaves Charing Cross and takes the quickest way to every square. Then I drew the line where twelve hours run out.
1750: a day is about 69 km
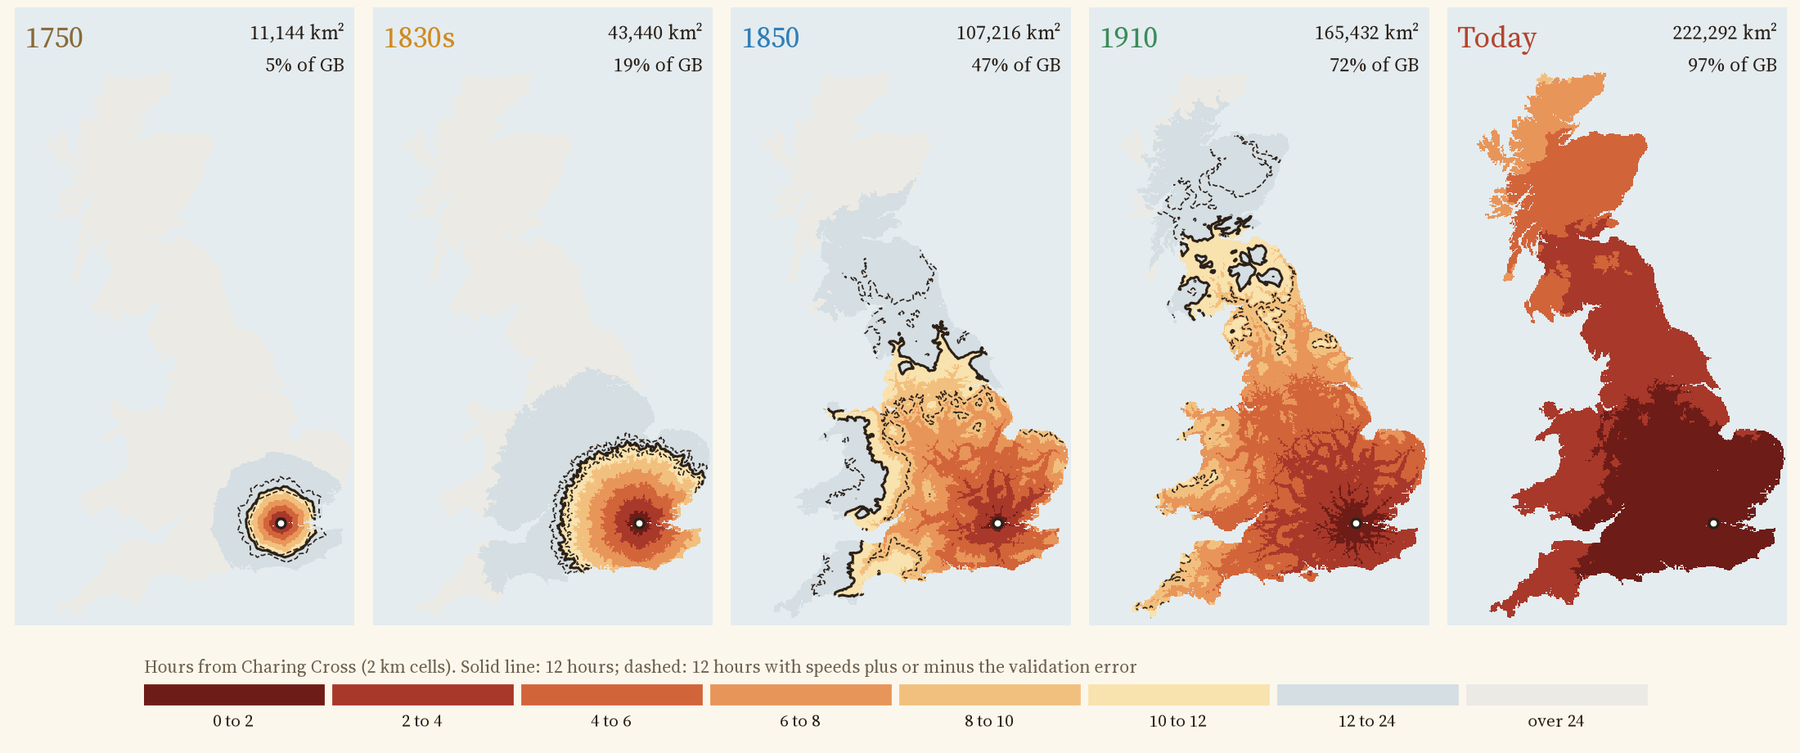
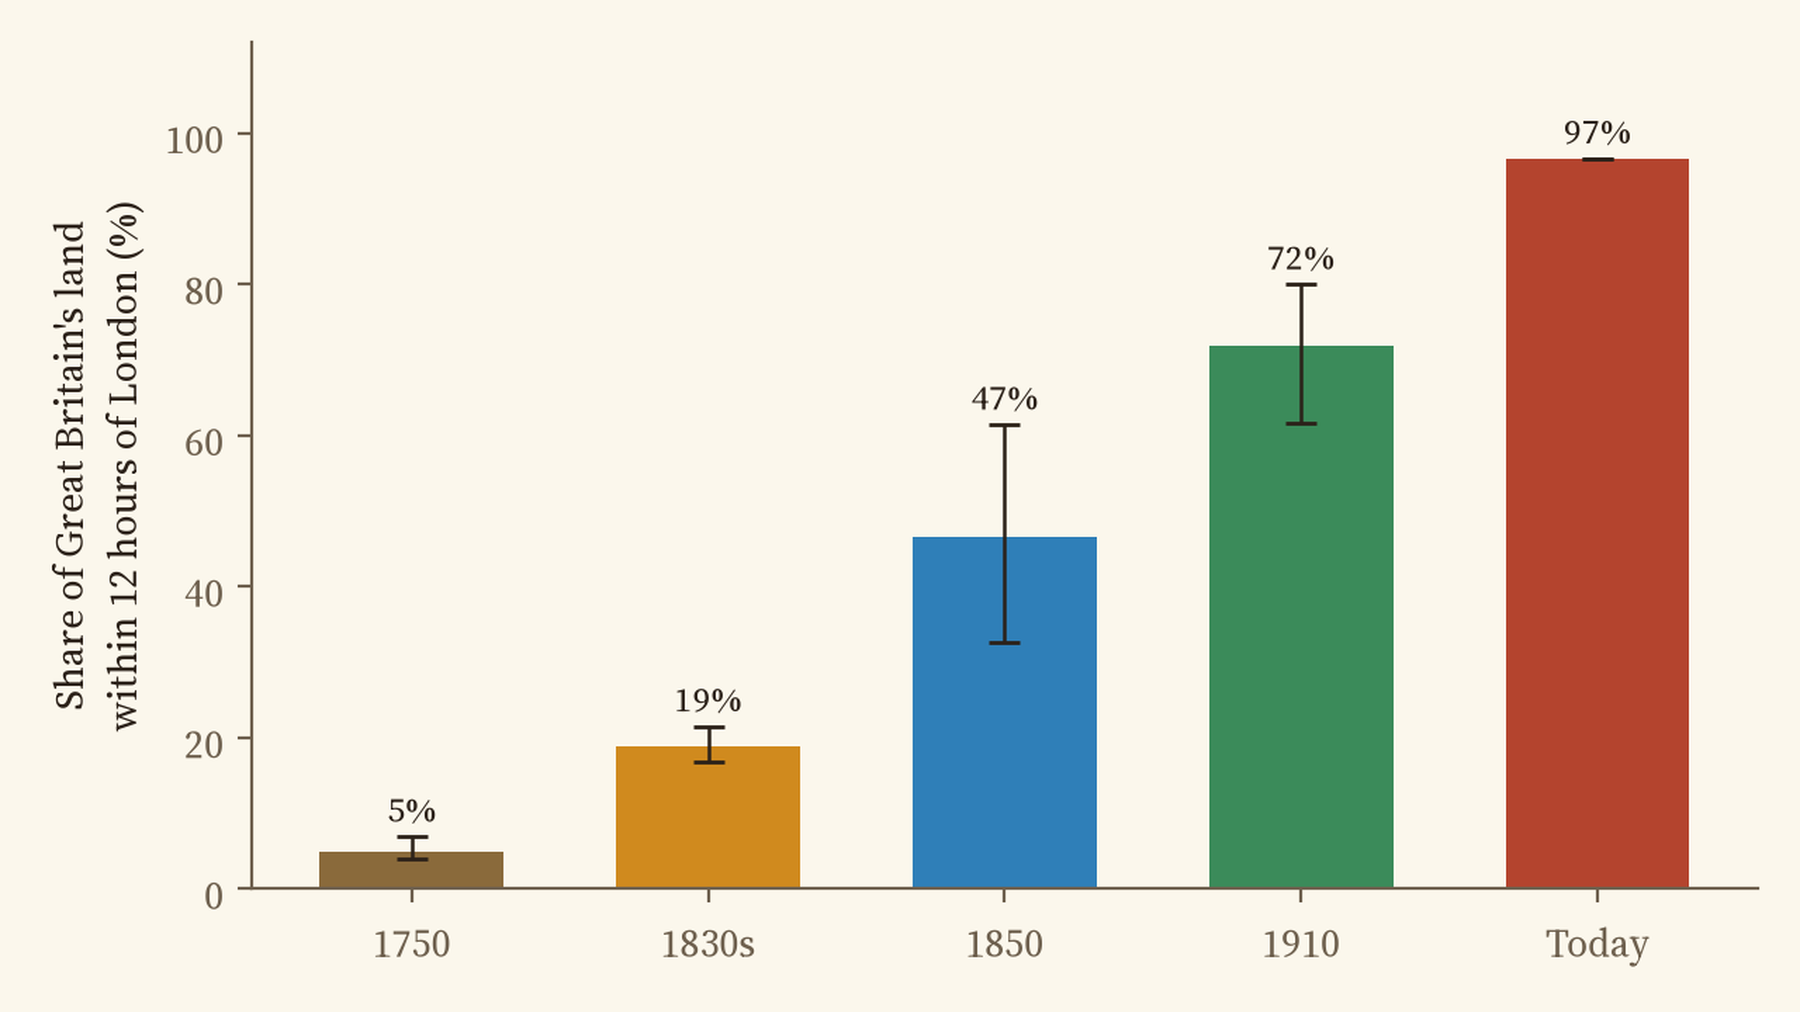
In 1750 a stage coach was slow. Fitted to a dozen dated journeys from the 1740s to the 1760s, the model’s coach managed about 3.6 miles an hour on a turnpike, counting a travelling day as twelve hours. That puts the edge of the first day around 69 km of road from London: Reading, 59 km away, in 11.8 hours. Everything within a day of London covered 11,144 square kilometres, 5% of Great Britain. Edinburgh was 9 travelling days away.
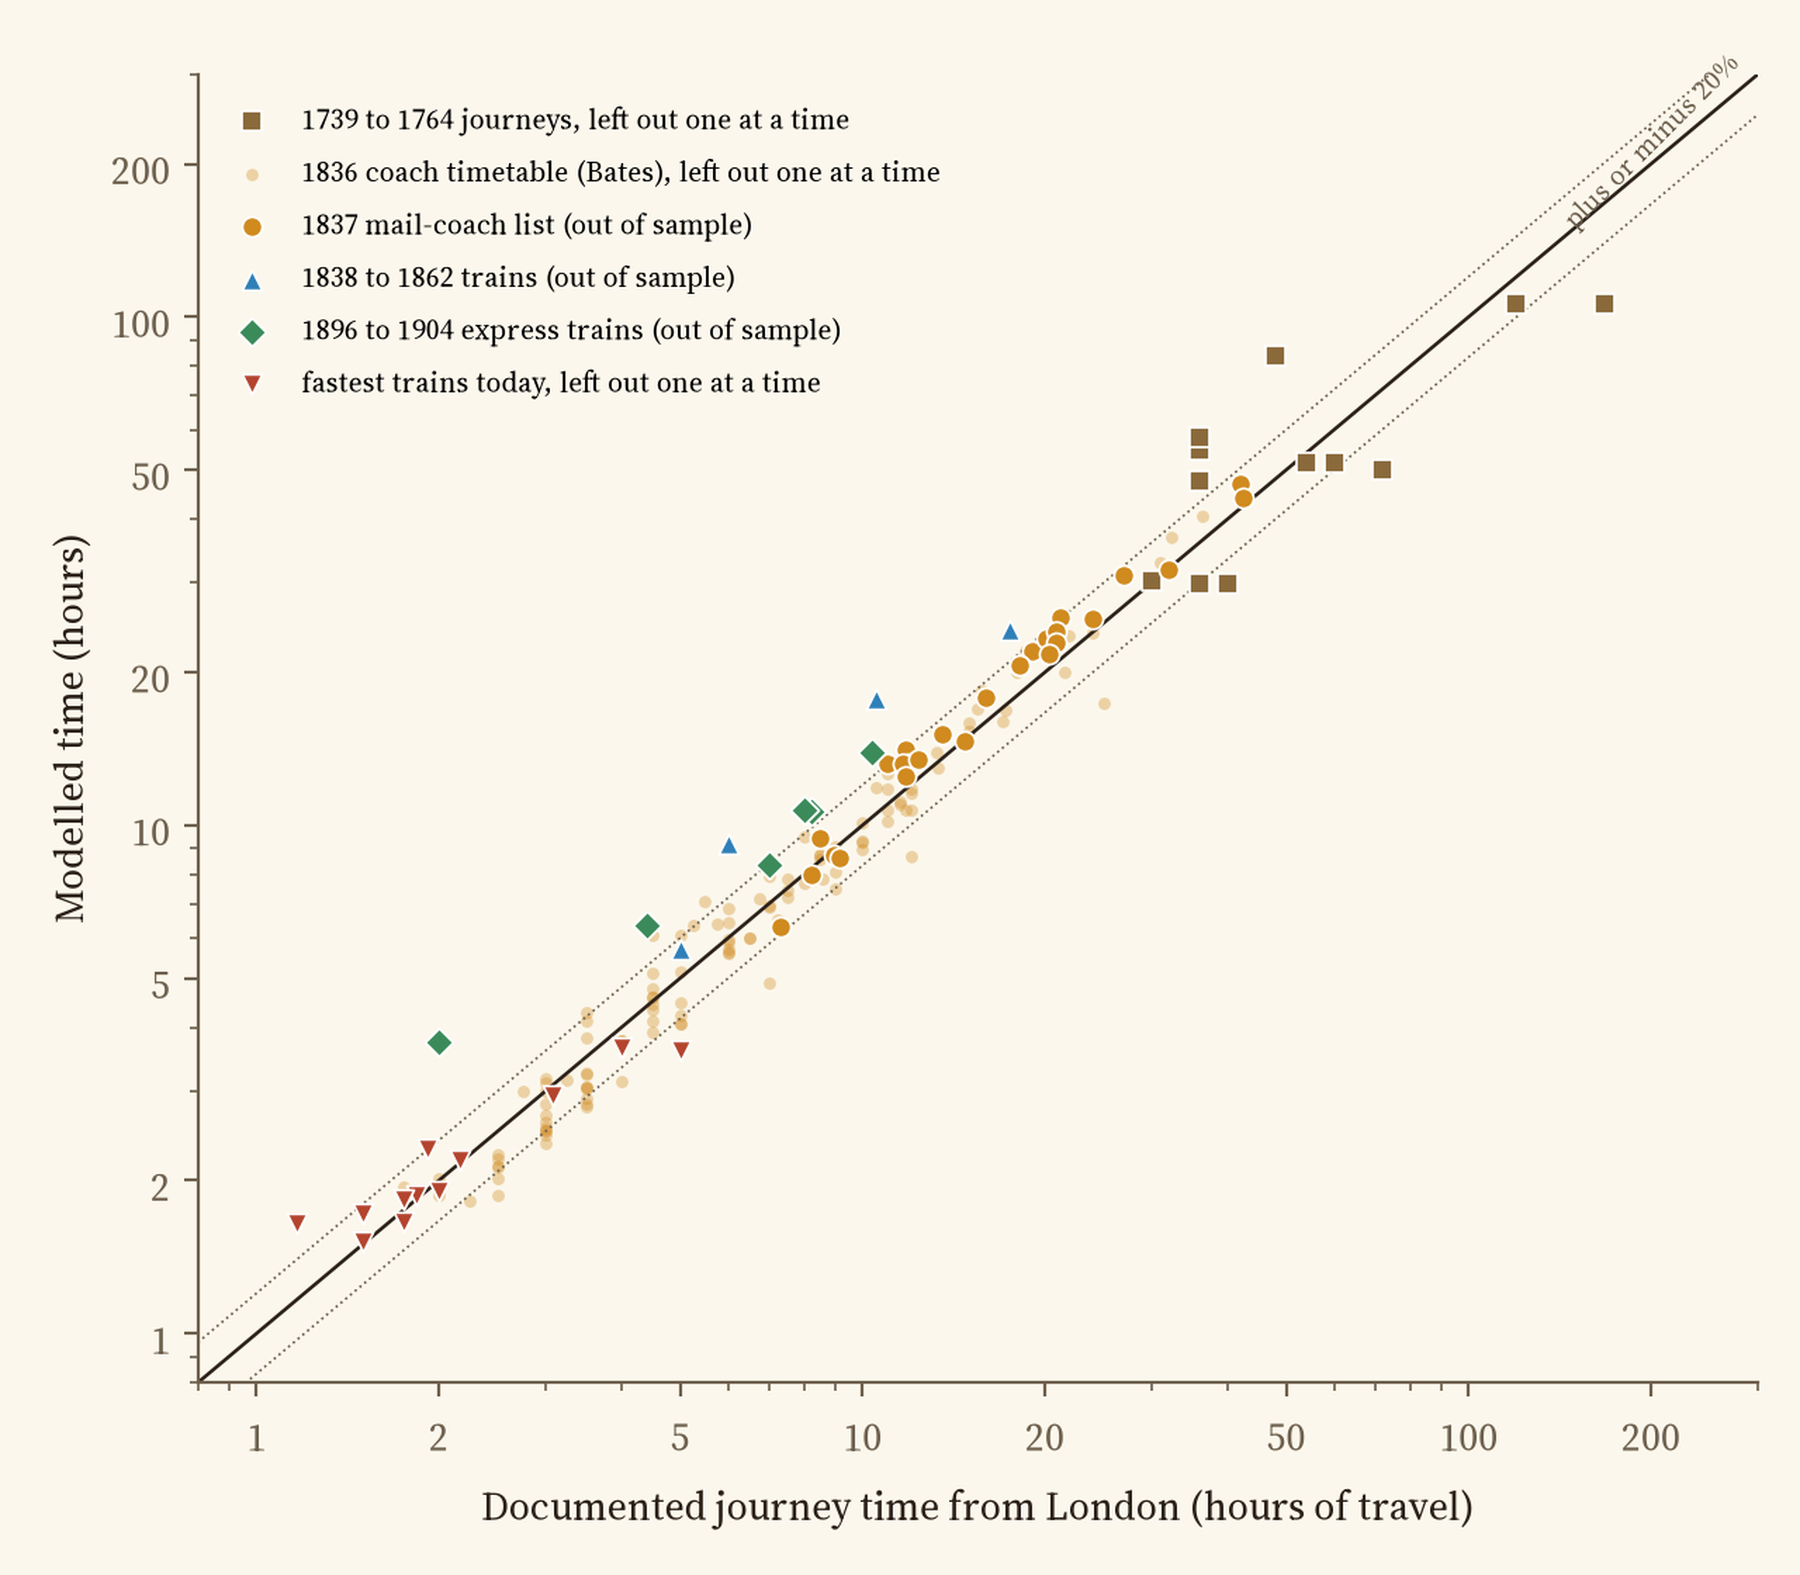
Treat this map as a rough sketch. I could find and cite only twelve dated journeys for this period, and the model misses them by a median of 28% when each one is left out of the fit. Before running anything I wrote down that an error above 25% would count against the model, so by my own test the 1750 model fails.
The 1830s: the coach at full gallop
Eighty years of turnpikes, better coaches and better horses made a big difference. For the 1830s I fitted the coach speed to the timetables of 136 coach services from London in 1836, compiled by Alan Rosevear, Dan Bogart and Leigh Shaw-Taylor. The best fit is 8.4 miles an hour, stops included, close to the 8.7 mph other historians have used. A day now reached 19% of Britain: Leicester, 143 km away, in 11.7 hours.
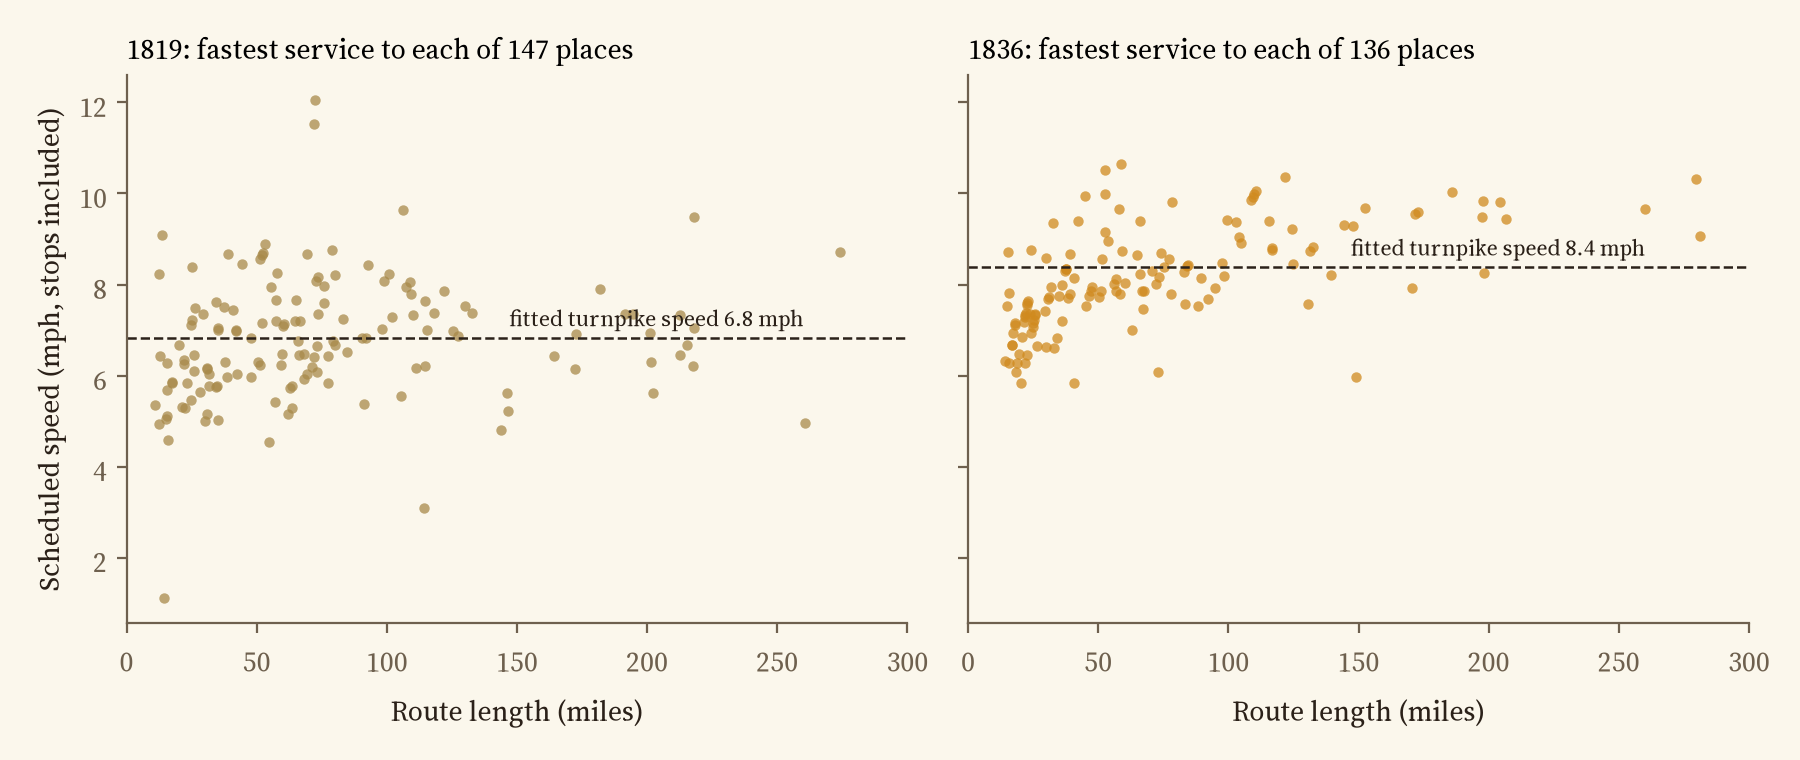
Here the model is on firm ground. Fitted to the 1836 timetables, it predicts the separate list of mail coaches leaving London in 1837 to within a median of 12%.
1850: the railway arrives
By 1851 Britain had about 6,300 miles of railway. Trains in the model run at the average speeds Tim Leunig measured from the timetables of 1850, 26 miles an hour along the track on main lines and less on branches, with half an hour to wait for each train and coaches feeding the stations. The day jumped to 47% of Britain, reaching Holyhead, 366 km away, in 11.2 hours. In about fifteen years the reach of a day from London grew at least 2.5 times.
That 47% is a floor, not a precise figure. The model’s trains are average trains, and against the four fastest journeys of the period I could document it is slower by a median of 46%. A traveller on the best express would have gone further.
In 1750 a day from London covered 5% of Great Britain. Today it covers 97%.
1910 and today
There is no public map of the railway network of 1910, so I rebuilt it from the 1851 lines, today’s lines and the stations that closed after 1910, joining them up where they now sit far from any track. With Leunig’s 1910 speeds, a day reached at least 72% of the island (again a floor: the model is 34% slower than six documented expresses): Greenock, 579 km away, in 11.6 hours. Today, by car or train, it is 97%: every mainland town on the map, and only islands are left outside.
London to Edinburgh
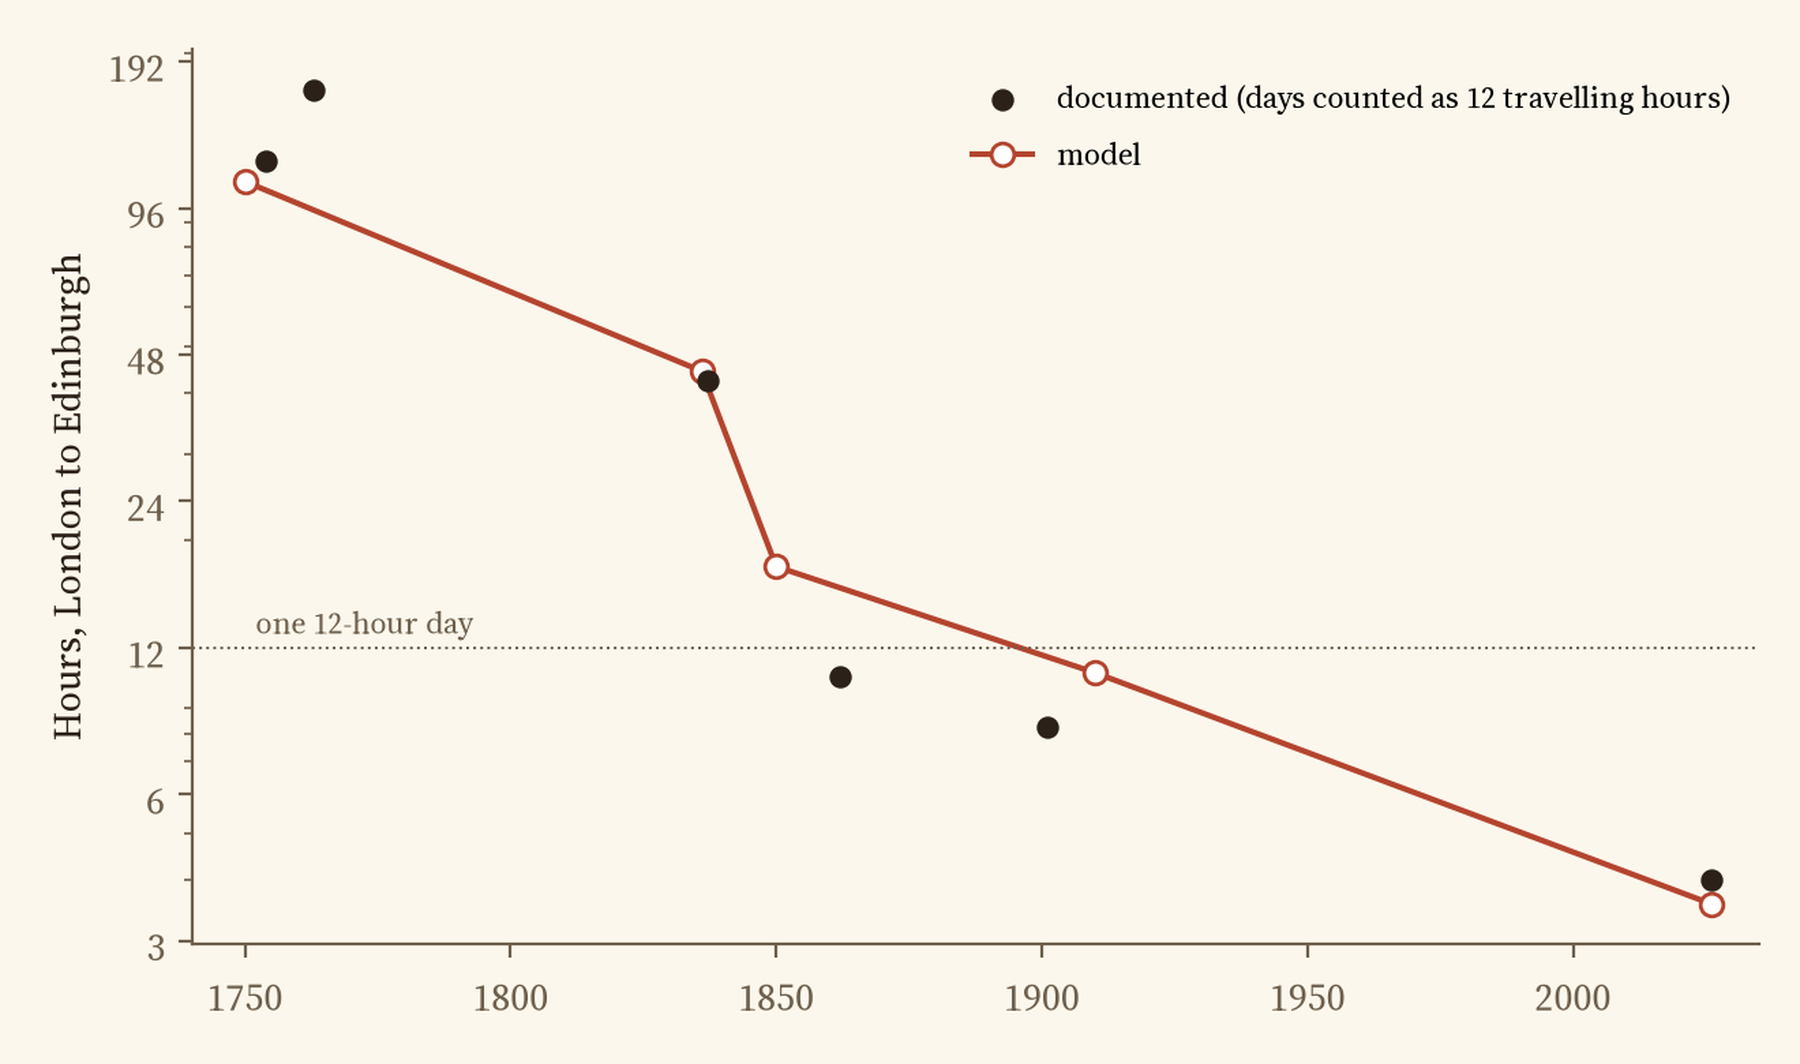
The road north tells the story in one line. In the model, Edinburgh is 109 hours of travel from London in 1750, 44 in the 1830s, 18 in 1850, 10.7 in 1910 and 3.6 today. The documented journeys are 120 hours for the ten days of 1754 (at twelve hours a day), 42 for the 1837 mail, 8.25 for the Flying Scotsman of the early 1900s and 4 for today’s fastest train. Between 1750 and the 1830s the journey shrank by about 45 minutes a year; between the 1830s and 1850, by 115 minutes a year.
How good is it?
Every speed in the model is either fitted to cited journey times or taken from published work, and every era is tested on journeys it did not see. The 1830s coach model holds up well, with a median error of 9% against 136 timetabled services left out one at a time, and 12% against the 1837 mail coaches. 1750 fails the test I set in advance (28% against a 25% limit), so its map is a rough sketch. For the railways the model uses average trains, so it is slower than the famous expresses: the median gap is 46% in 1850 and 34% in 1910, checked on only four and six journeys. So read the 1850 and 1910 maps as lower bounds, not precise figures. Today’s trains are fitted to twelve fastest times and miss them by a median 5%.
How I did this
The roads of 1750 and the 1830s are the turnpike and main road map of England and Wales by Alan Rosevear, Dan Bogart, Leigh Shaw-Taylor and Max Satchell, which records whether each stretch was a turnpike in each decade. Roads that were not turnpikes run at 0.6 of turnpike speed. Scotland is not in that map, so its main roads come from today’s trunk and primary roads. The railways of 1850 are the Cambridge Group’s 1851 rail lines. For 1910 I joined the 1851 lines, today’s railways and straight links between closed stations. Today’s roads and railways come from OpenStreetMap. Away from the roads and railways, the traveller walks at 3 miles an hour. Shortest paths from Charing Cross are found across the whole grid, and the analysis was pre-specified in a written plan before I computed any travel times.
There is a lot this cannot see. There are no timetables, so the model assumes a coach or train is waiting when you arrive, apart from a half-hour allowance. It knows nothing of weather, floods, hills, fares or the price of a horse. The inferred lines of 1910 are straight, and some may join stations that were never connected. The twelve hour day is a choice: an eight hour day or a sixteen hour one moves the line a long way, and the paper reports both.
Notes and sources
- A. Rosevear, D. Bogart, L. Shaw-Taylor and M. Satchell, Turnpike road map for England and Wales 1700 to 1838 (openICPSR 195126); A. Rosevear, D. Bogart and L. Shaw-Taylor, Stagecoach services in England and Wales 1819 and 1836 (openICPSR 195128). Used for derived results only.
- M. Satchell, E. A. Wrigley, L. Shaw-Taylor, X. You and J. Henneberg, 1851 England, Wales and Scotland Rail Lines, UK Data Service ReShare (CC BY 4.0). Closed and open stations from my study of the Beeching cuts. Today’s roads and railways: OpenStreetMap contributors via OpenFreeMap (ODbL).
- Train speeds: T. Leunig, Time is money (Journal of Economic History, 2006). Coaching history: D. Bogart (Explorations in Economic History, 2005); D. Gerhold (Economic History Review, 2014). Journey times from C. G. Harper’s road books, S. Smiles, S. Sidney’s Rides on Railways and the other sources listed in the paper.
- I wrote the text, with drafting and editing assistance from Claude (Anthropic), which also helped prepare the analysis code. I reviewed and checked all text and results.

