
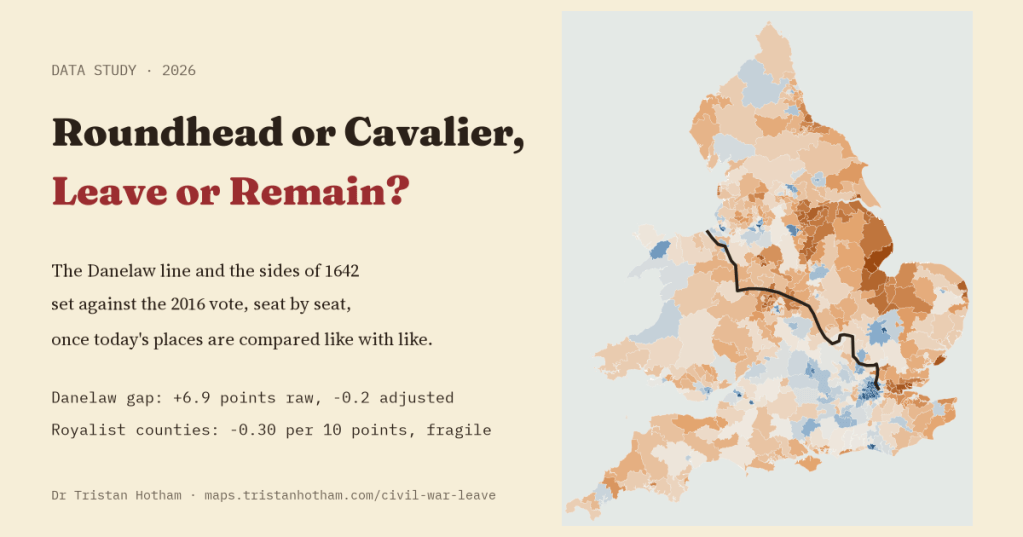
Every so often someone sets the 2016 referendum map beside a map of the Danelaw, or of the counties that sided with the King in the Civil War, and the likeness looks uncanny. I tested both comparisons properly, seat by seat, with the plan written down first. The old lines are real. The likeness, mostly, is not history talking.
I love a map that seems to reveal a hidden pattern, and I distrust them in about equal measure. The referendum map is a good example. Look at it beside a map of the Danelaw, the part of England where Viking rule and then Viking law held sway, and the east and north light up in both. Look at it beside a map of the Civil War, and London and the south east, Parliament’s heartland in the 1640s, seem to line up with Remain. Pictures like these get shared a lot. I wanted to know whether the resemblance survives a fair test.
A fair test means two things. First, comparing like with like: the Danelaw is also the north and east, older, whiter and further from London, and those things are known to go with Leave. Second, deciding how to test it before seeing the answer. So I wrote down the plan, with the exact comparisons, the controls and what would count as a result, before running a single model on the vote. Then I ran it once.
The Danelaw: a real line
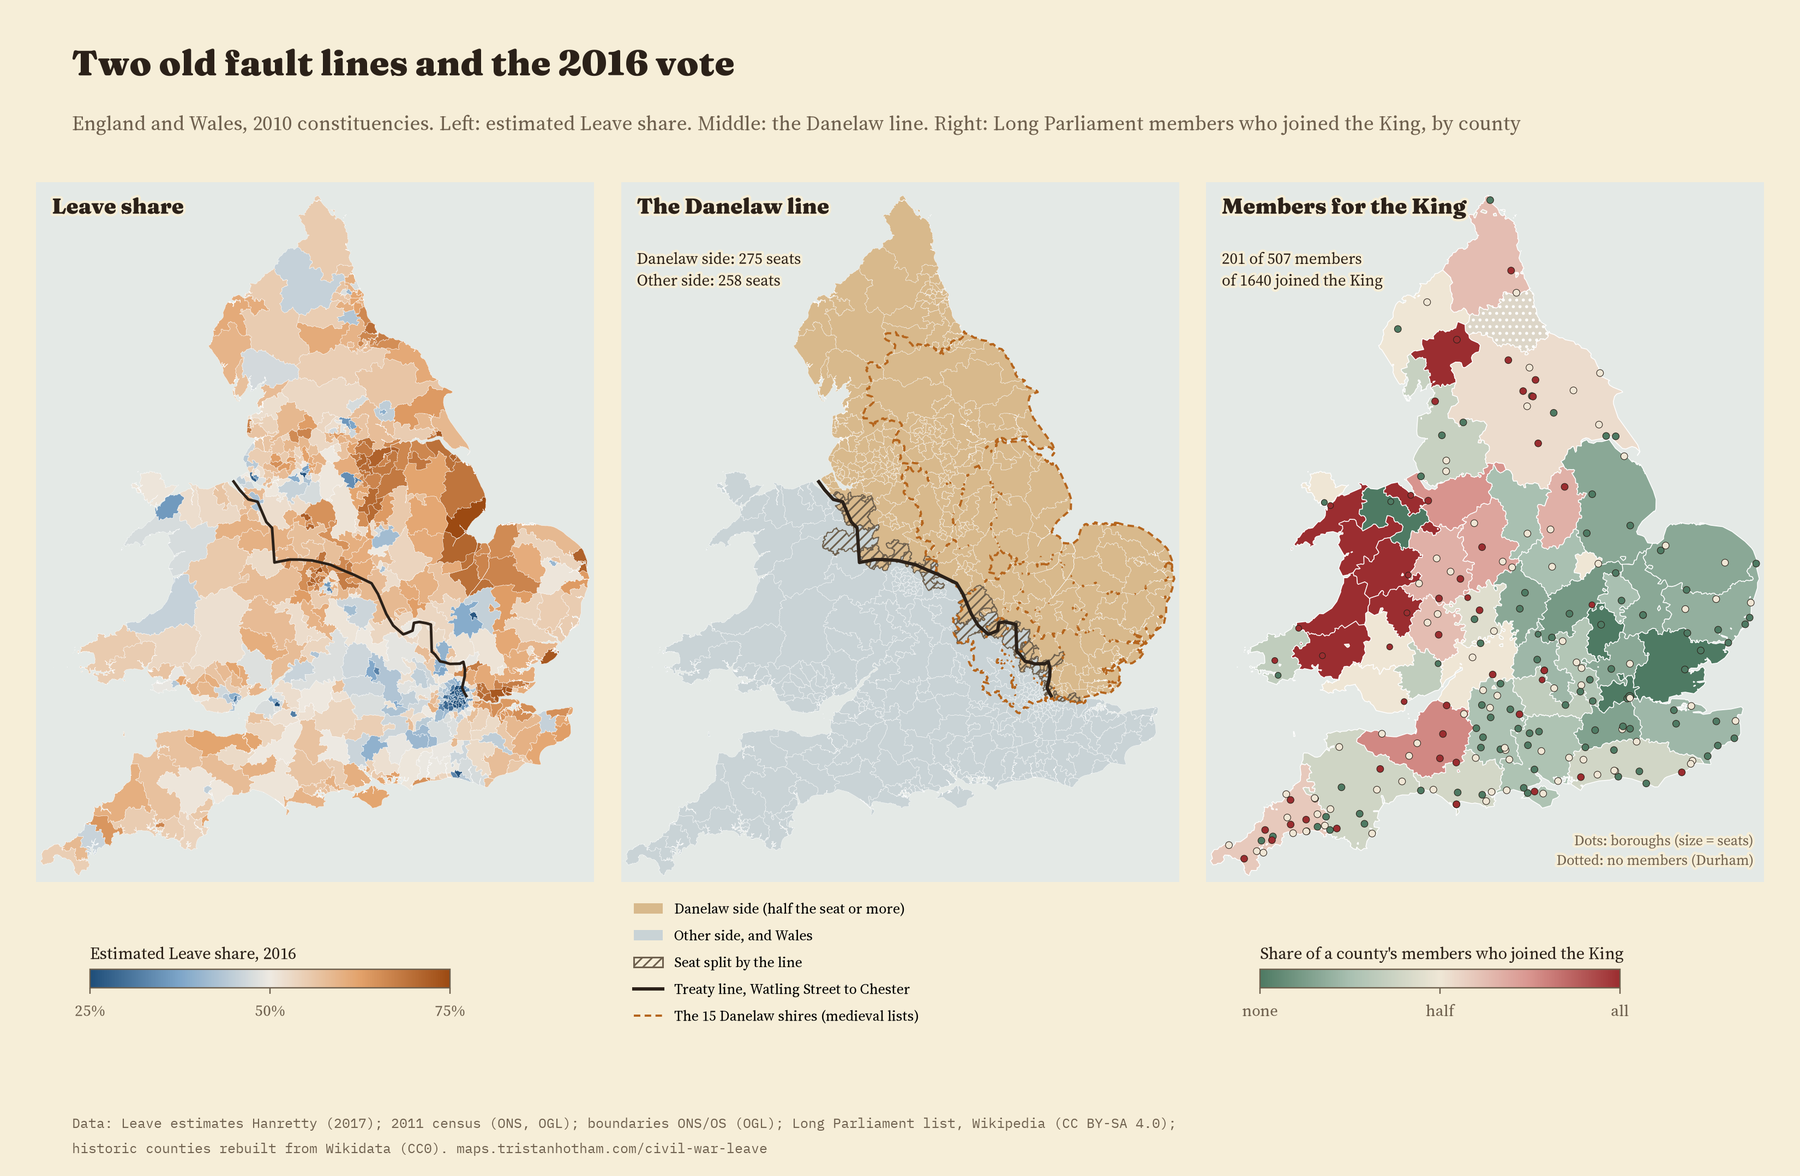
In the 880s Alfred, king of the West Saxons, and the Viking leader Guthrum agreed a boundary. It ran up the Thames, up the River Lea to its source, then straight to Bedford, then up the Ouse to Watling Street, the old Roman road that is now the A5. The treaty says nothing beyond that, but the usual maps carry the line on along Watling Street towards Chester, and so did I. That puts 275 of England’s constituencies on the Danelaw side and 258 on the other.
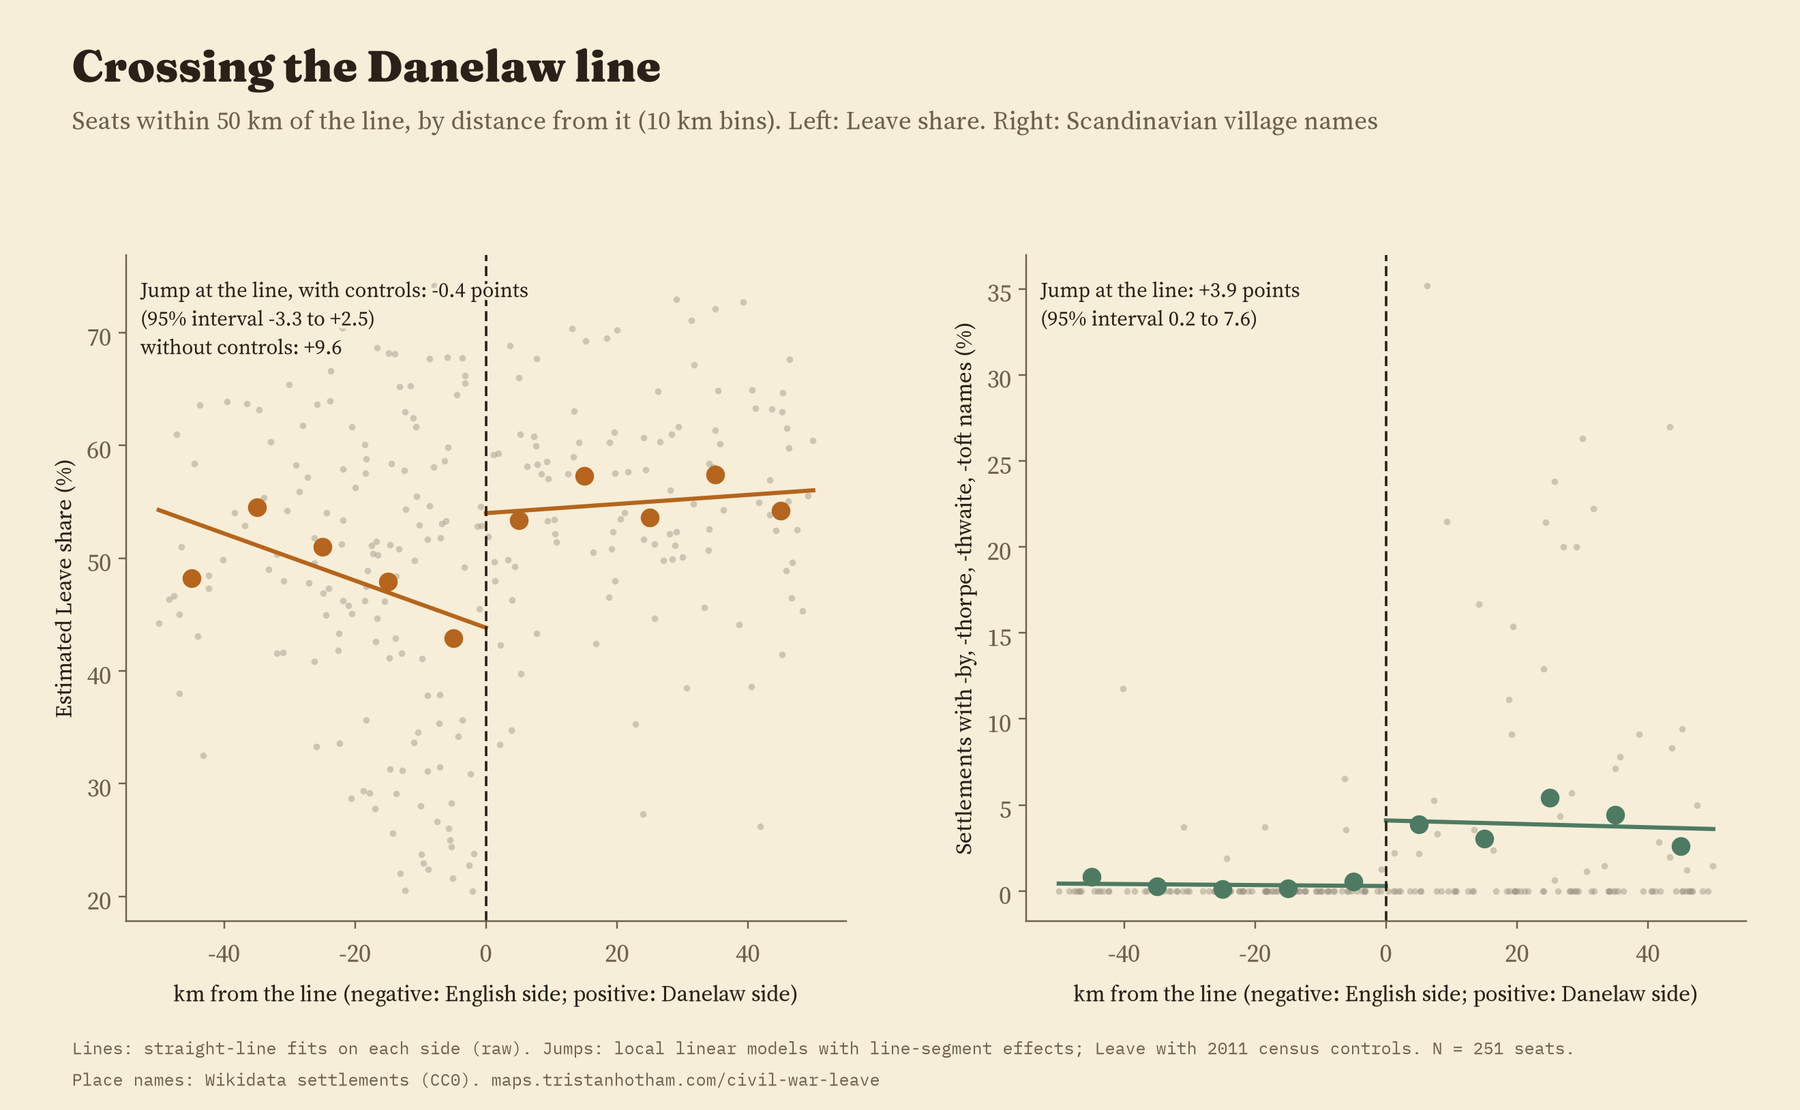
It is not an imaginary line. Village names with Scandinavian endings, the Grimsbys and Scunthorpes, the -bys, -thorpes, -thwaites and -tofts, are almost all on one side of it: 98% of the 1,100 I found in England. Step across the line near Northampton or Leicester and they appear; step back and they all but vanish.
An empty gap
On average, seats on the Danelaw side were estimated to vote Leave by 6.9 points more than seats on the other side, 56.9% against 50.0%. That is the gap behind the map comparisons. But the Danelaw side also had on average 10 points more White British residents and 6.5 points fewer people with a degree, two of the characteristics that studies of the vote have most often linked with Leave.
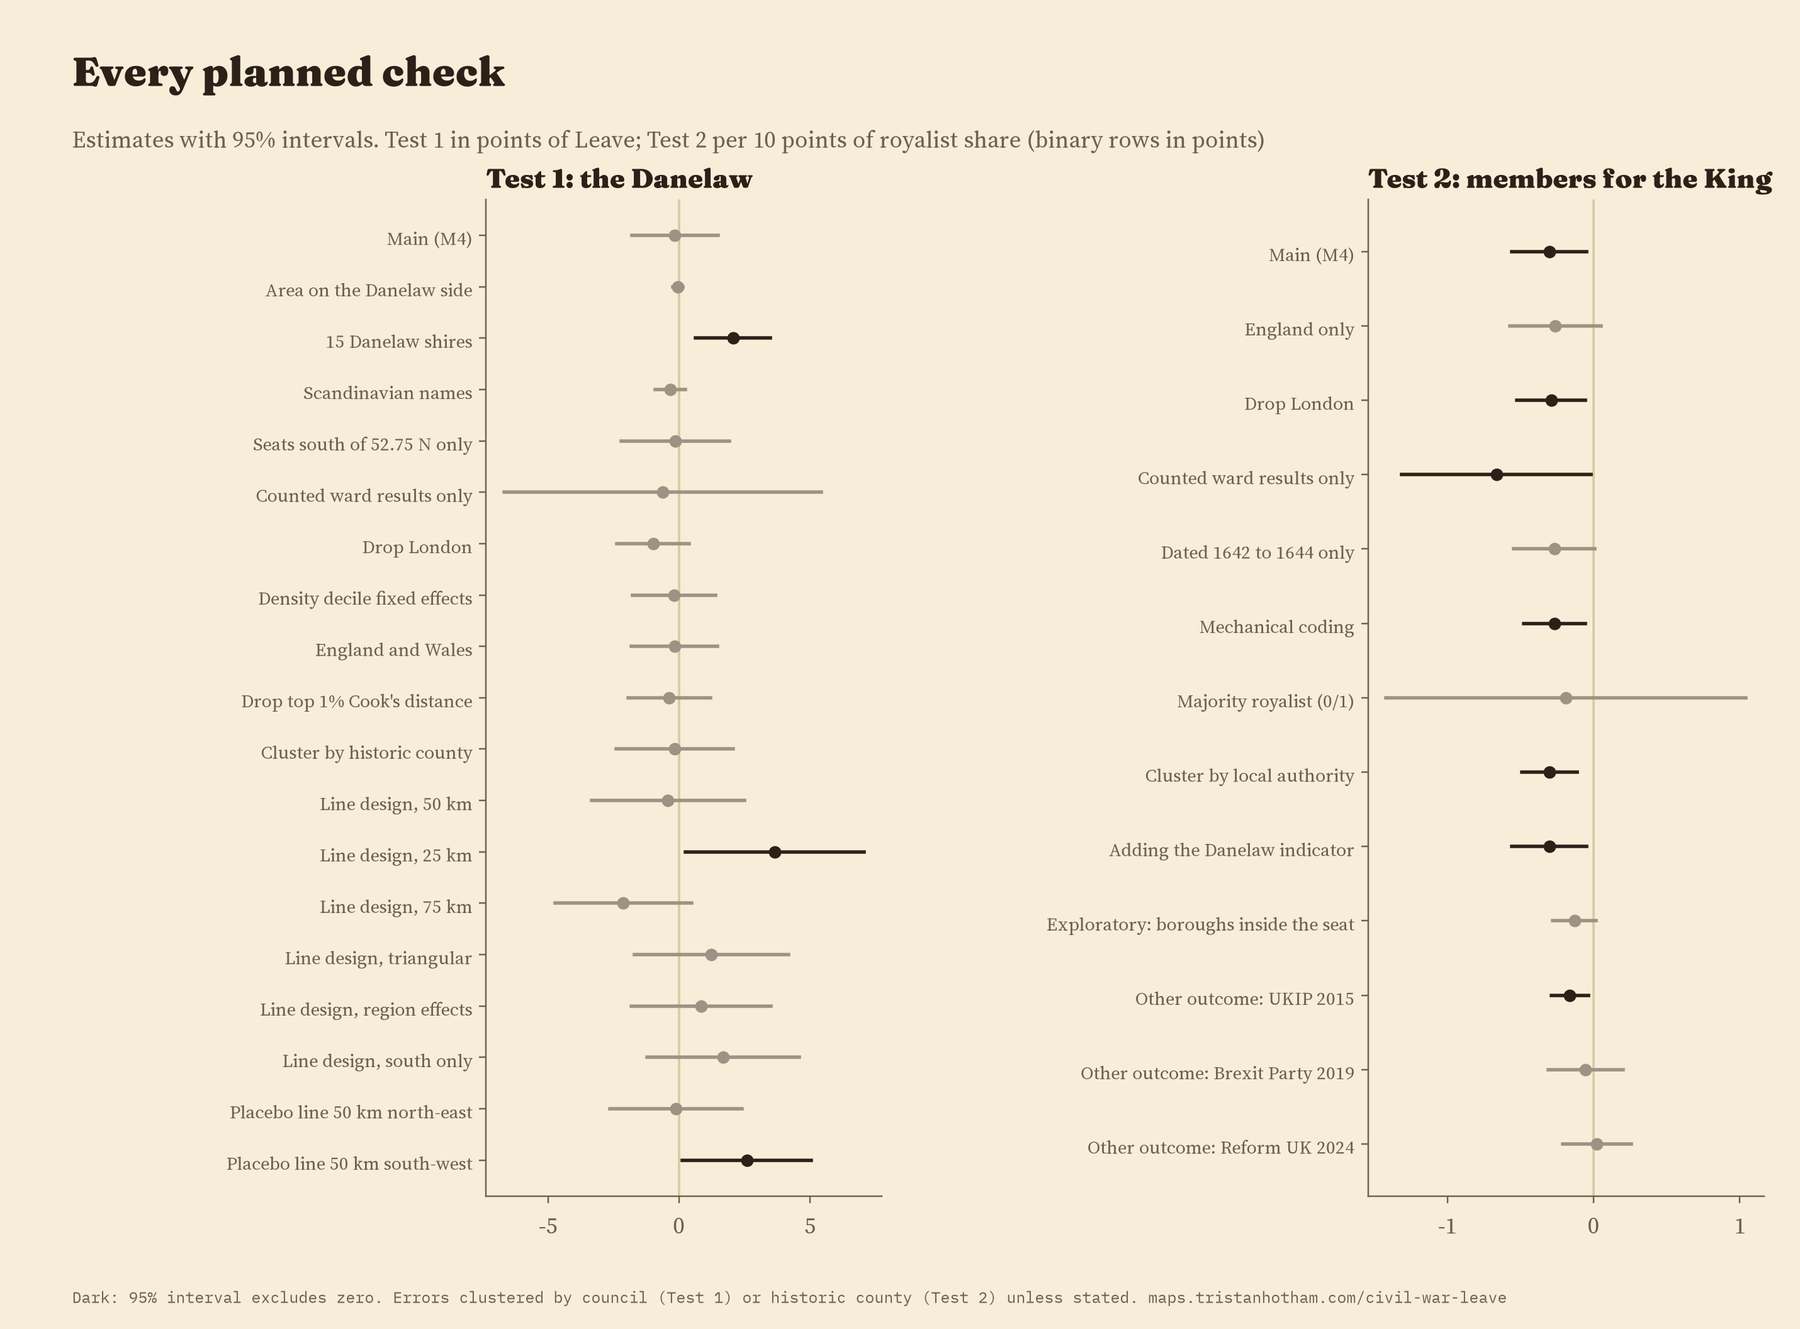
So I compared each seat with others in the same region with a similar population density, distance to a city and 2011 census profile. Once like is compared with like, the Danelaw gap is -0.16 points, with a 95% interval from -1.8 to 1.5. Most of the drop comes in the final step, when the census profile of the people who live there now is added.
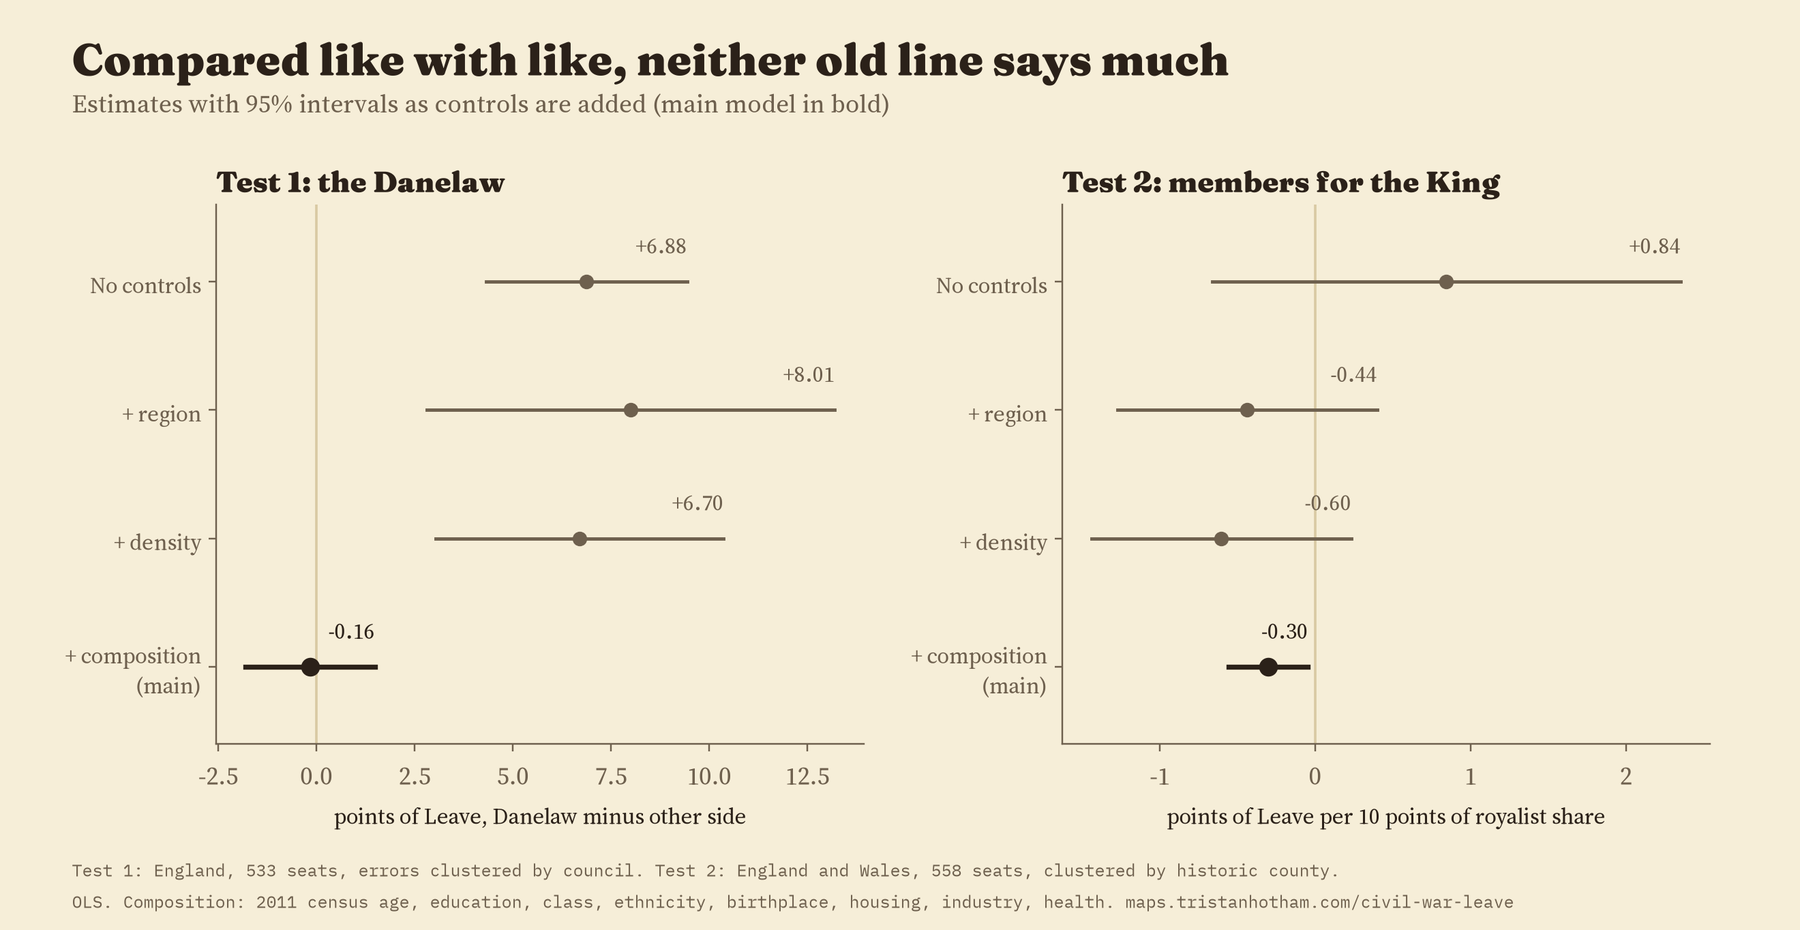
The line still shows in the village names. It does not show in the vote, once like is compared with like.
Another way to test a border is to stand right on it and compare the seats just either side. That gives a jump of -0.4 points with the census controls. But this test turned out to be shaky: the answer changed with how wide a strip I used, and a fake line drawn 50 km to the south west, where no border ever ran, showed a jump of 2.6 points of its own. The real line runs along the edge of London and the Midland cities, so the two sides differ today in density and education, and a border test cannot separate that from history. The village names, by contrast, jump at the line by 3.9 points.
King or Parliament
The Civil War is harder to map, because who held what changed month by month. I did not have a clean map of 1643 as data, so I used people instead. The Long Parliament was elected in 1640. When war came, members who went over to the King were “disabled” from sitting. Going through the list of members elected in 1640, I counted 201 of the 507 seats whose members joined the King, with a few decisions by hand, such as members killed fighting for the King before they could be disabled. In Wales it came to 17 of 24, matching a published count.
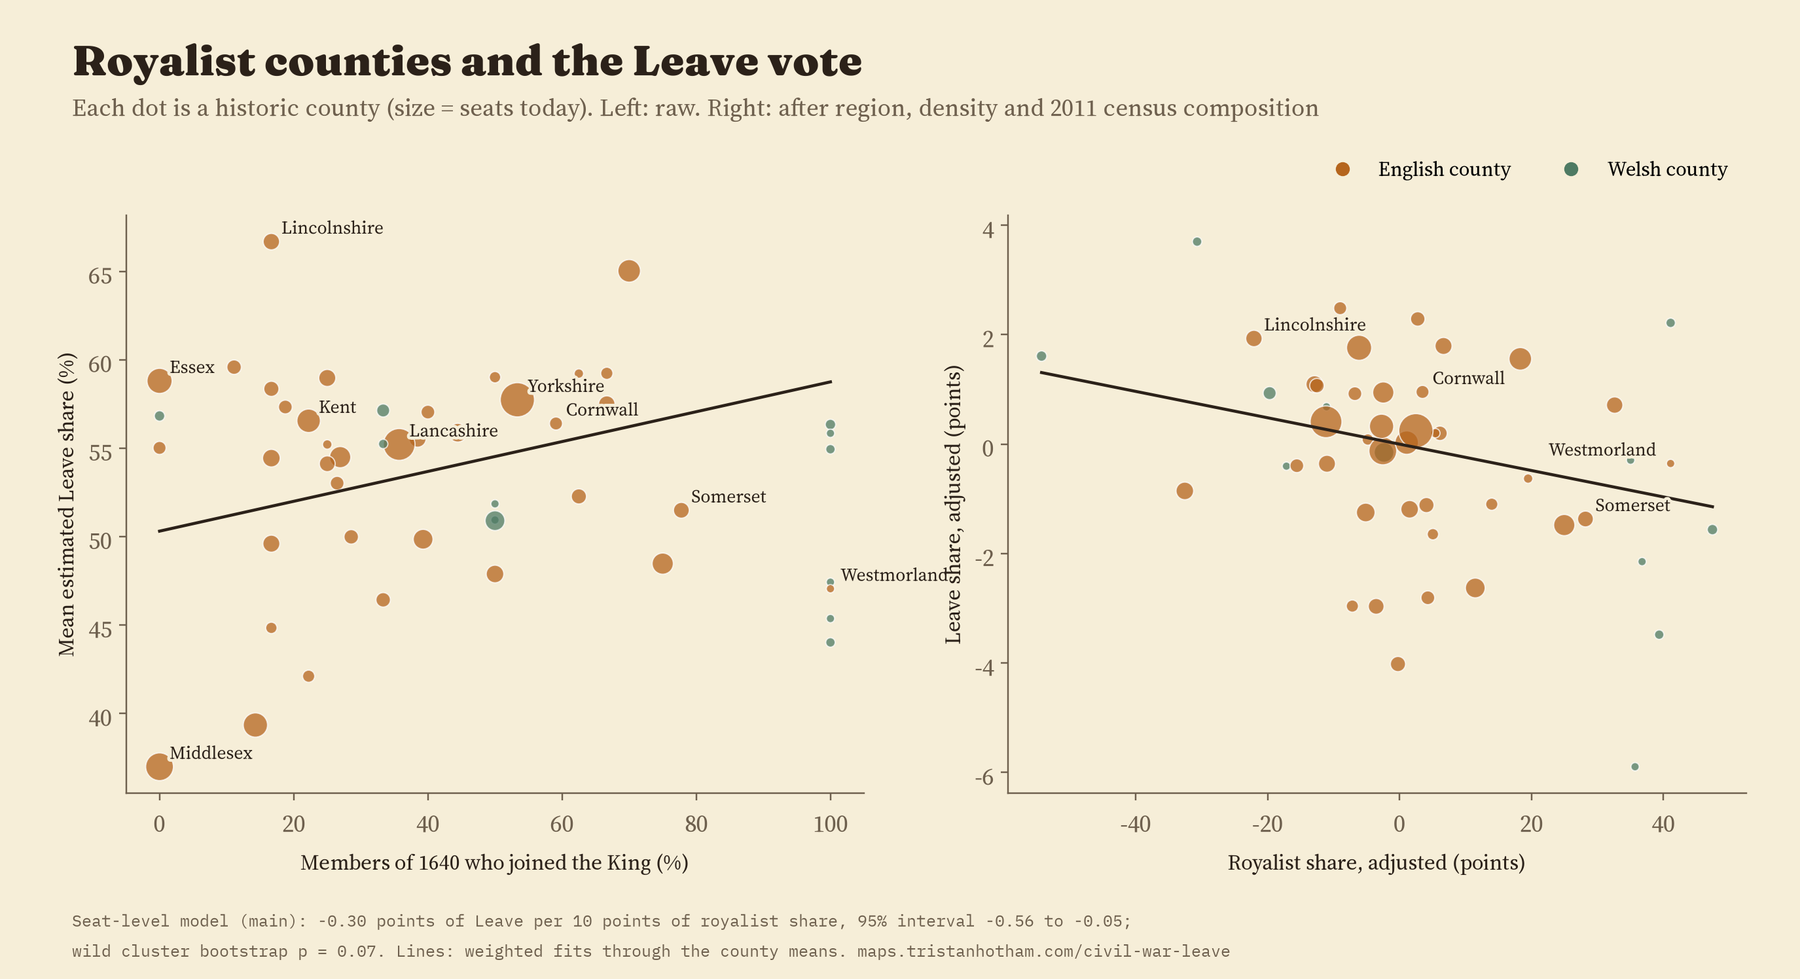
Each historic county then gets the share of its members who joined the King: none at all in Bedfordshire, Denbighshire, Essex and Middlesex, every one of them in seven Welsh counties and Westmorland. Cornwall was at 59%, Somerset 78%, Yorkshire 53% and Kent 22%.
Without any controls, seats in more royalist counties were very slightly more Leave, but not clearly so. Comparing like with like, the sign turns: -0.30 points of Leave for every 10 points more royalist a county’s members were, or about 0.7 points for a typical difference between counties. That is small. It is also fragile. With a test suited to having only 49 counties, the p value is 0.07, and it fades for England on its own, when I count only disablements from 1642 to 1644, and when I simply split counties into mostly royalist or not. If it means anything, the Cavalier counties leaned a hair towards Remain, the opposite of the popular story. I would not lean on it.
What held up and what did not
I planned 10 other checks for the Danelaw, from using only the best attested part of the line to dropping London. Only one shows a gap: the fifteen shires that medieval law lists put under Danish law, which include Buckinghamshire and Middlesex and leave out Lancashire and the far north, show 2.1 points. A different Danelaw gives a different answer, which tells you how much these map comparisons depend on where the line is drawn. For the Civil War, 5 of 8 checks keep a small negative estimate whose interval excludes zero; in the other three the estimate is still slightly negative but the interval crosses zero.
How I did this
The Leave share for each 2010 constituency is Chris Hanretty’s estimate, and the census profile is from 2011, the same data I used in Did Beeching’s cuts make places vote Leave?. I drew the Danelaw line point by point along the Lea, the Ouse, Watling Street and the Roman road to Chester, and coded each seat by which side most of its area falls on. The village names come from Wikidata. The Civil War coding comes from the Wikipedia list of members elected in 1640, read row by row, with every hand decision written down in the code. Historic counties are the ones I rebuilt for Fencing the commons. The main comparison is a regression with region, density, distance to a city and eleven census measures, with uncertainty that allows for seats in the same council or county being alike.
What this cannot say: these are comparisons across places, not causes. Members of Parliament were gentry, not the people, so a county’s members are not a map of who held the ground. The Danelaw line beyond Watling Street is a convention of modern maps, and it may have lasted only a few years. And comparing like with like on today’s census asks only whether the old lines add something beyond what places are now. If history helped decide who lives where, that part sits inside the comparison, and this design cannot pull it out.
Notes and sources
- Leave estimates: C. Hanretty (2017), Areal interpolation and the UK’s referendum on EU membership, Journal of Elections, Public Opinion and Parties. 2011 census by constituency (ONS and NRS, Open Government Licence v3.0) via the parlitools package. Constituency boundaries: ONS and OS (OGL).
- Wikipedia contributors, “List of MPs elected to the English Parliament in 1640 (November)”, CC BY-SA 4.0. Settlements and their names: Wikidata (CC0). Historic counties from Fencing the commons (Hotham 2026).
- Further reading: D. Brunton and D. H. Pennington, Members of the Long Parliament (1954); A. H. Dodd, Studies in Stuart Wales (1952); D. N. Dumville, Wessex and England from Alfred to Edgar (1992); R. H. C. Davis, “Alfred and Guthrum’s frontier”, English Historical Review (1982); S. O. Becker, T. Fetzer and D. Novy, “Who voted for Brexit?”, Economic Policy (2017).
- I wrote the text, with drafting and editing assistance from Claude (Anthropic), which also helped prepare the analysis code. I reviewed and checked all text and results.

