
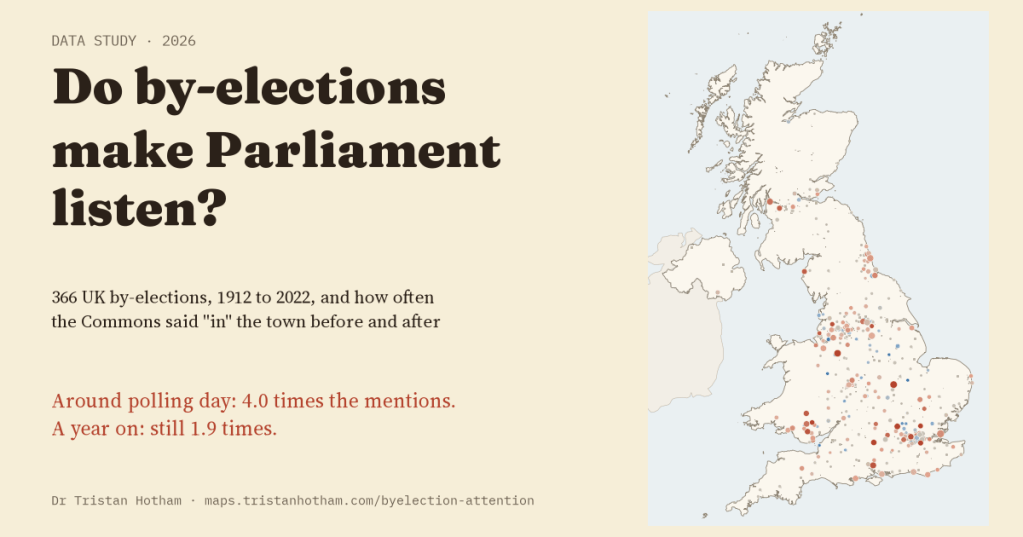
A by-election puts one town on the national news for a few weeks. I wanted to know whether Parliament keeps listening once the cameras leave. Following 366 UK by-elections from 1912 to 2022 through a century of Hansard, the answer is yes, for about two years, and only since the Second World War.
By-elections are strange, lovely things. A member dies or resigns, and for a month or two a place most of the country never thinks about, Orpington, Crewe, Eastleigh, becomes the centre of British politics. The parties pour in, the national papers follow, and the result is often read as a verdict on the government. A lot has been written about what by-elections tell us about voters. I wanted to turn it round: what does a by-election do to Parliament?
To find out, I took every UK by-election since 1909 from Wikipedia’s lists, 1,339 of them, and counted how often MPs said “in” the town named in the seat, month by month, in Commons debates. “In Crewe”, “in Corby”, “in Orpington”. Then I compared each by-election town with five similar towns that had no by-election, in the very same months.
The town gets its turn
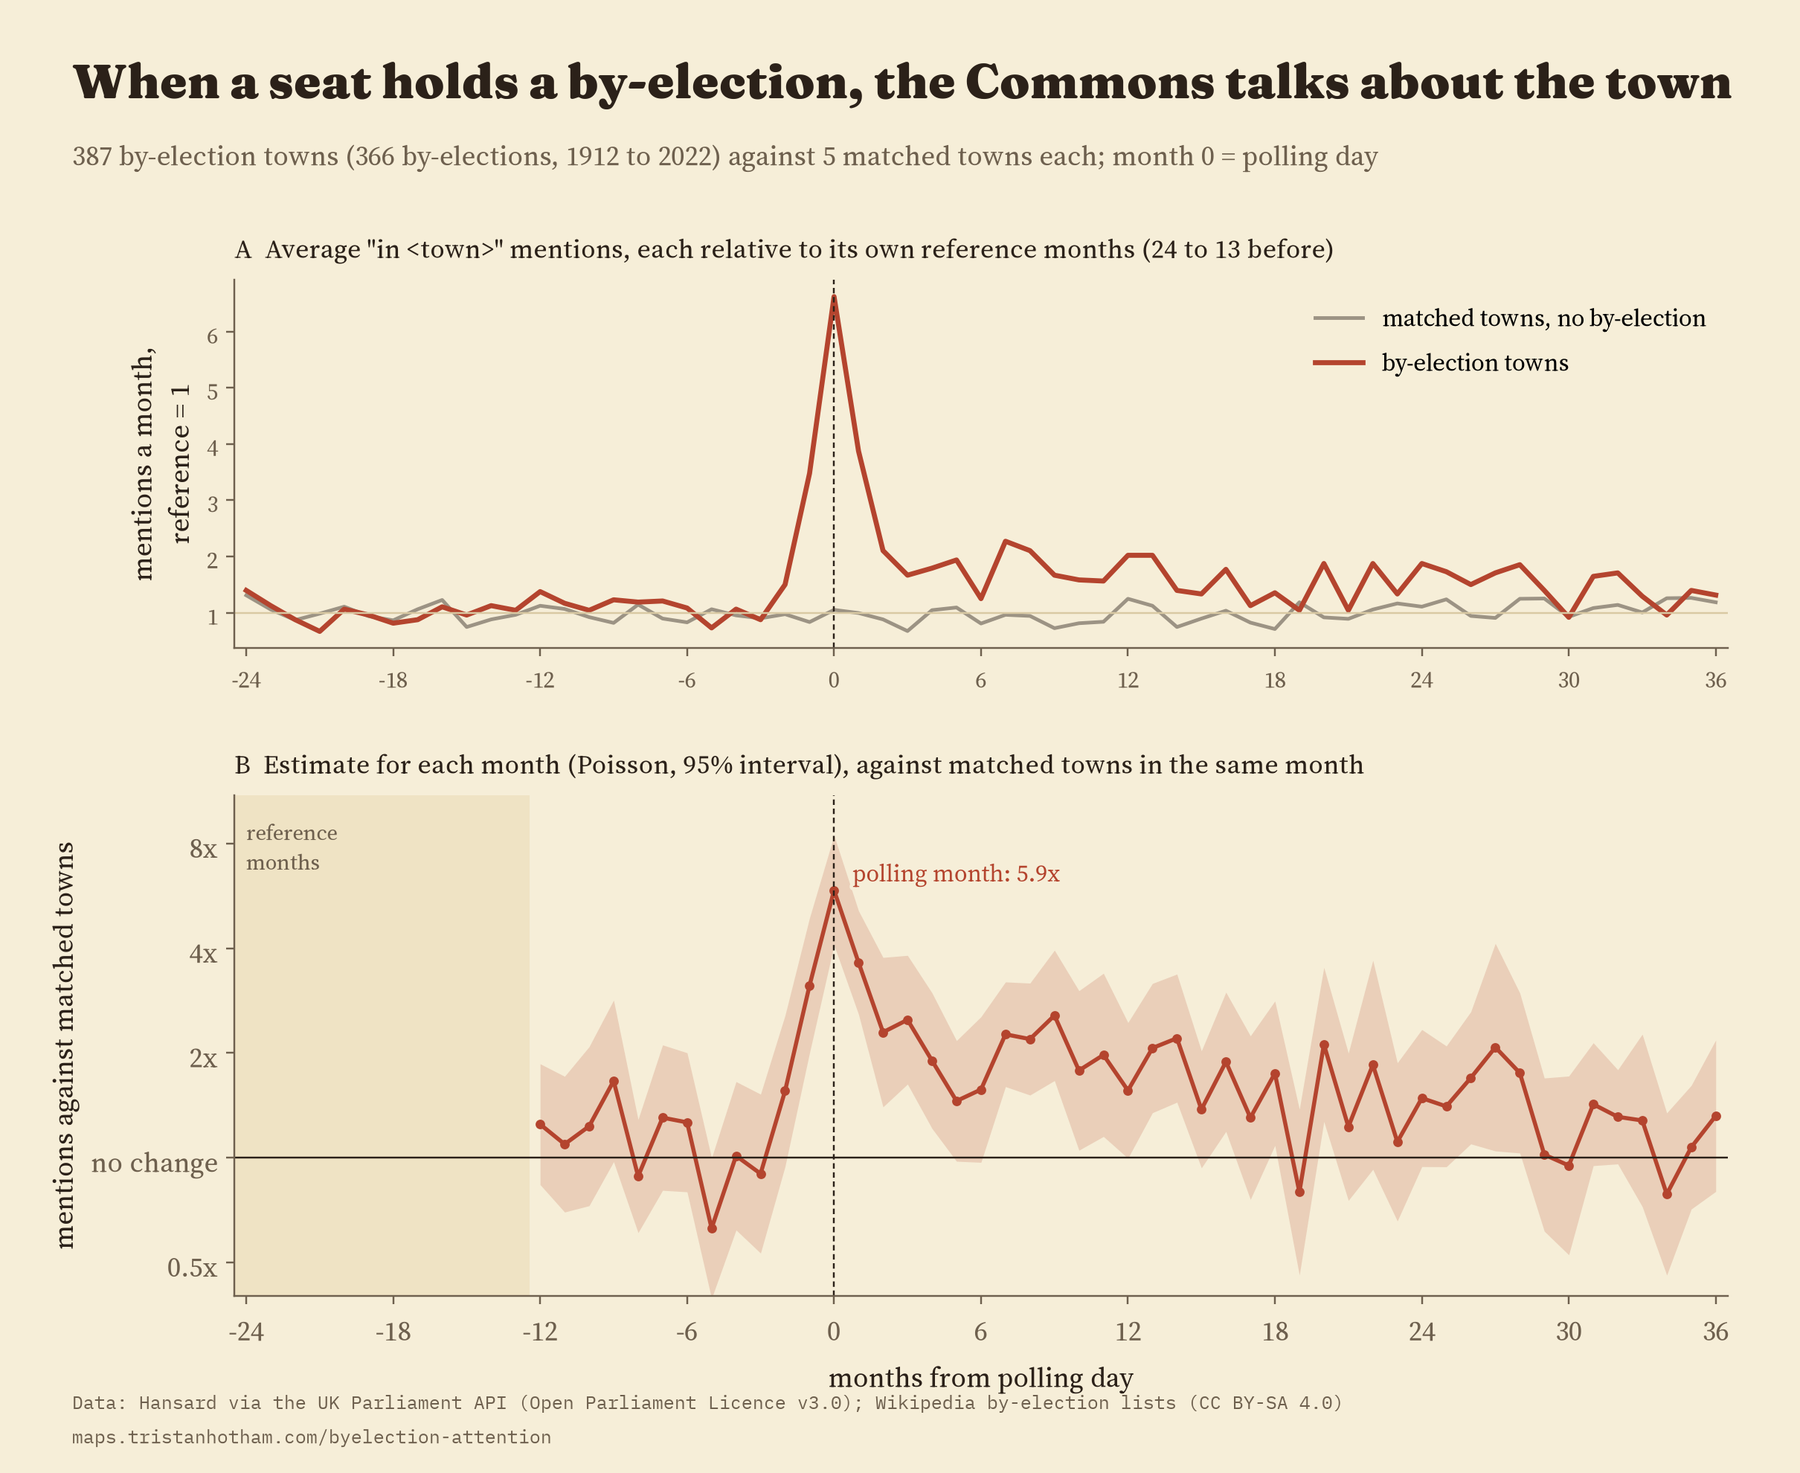
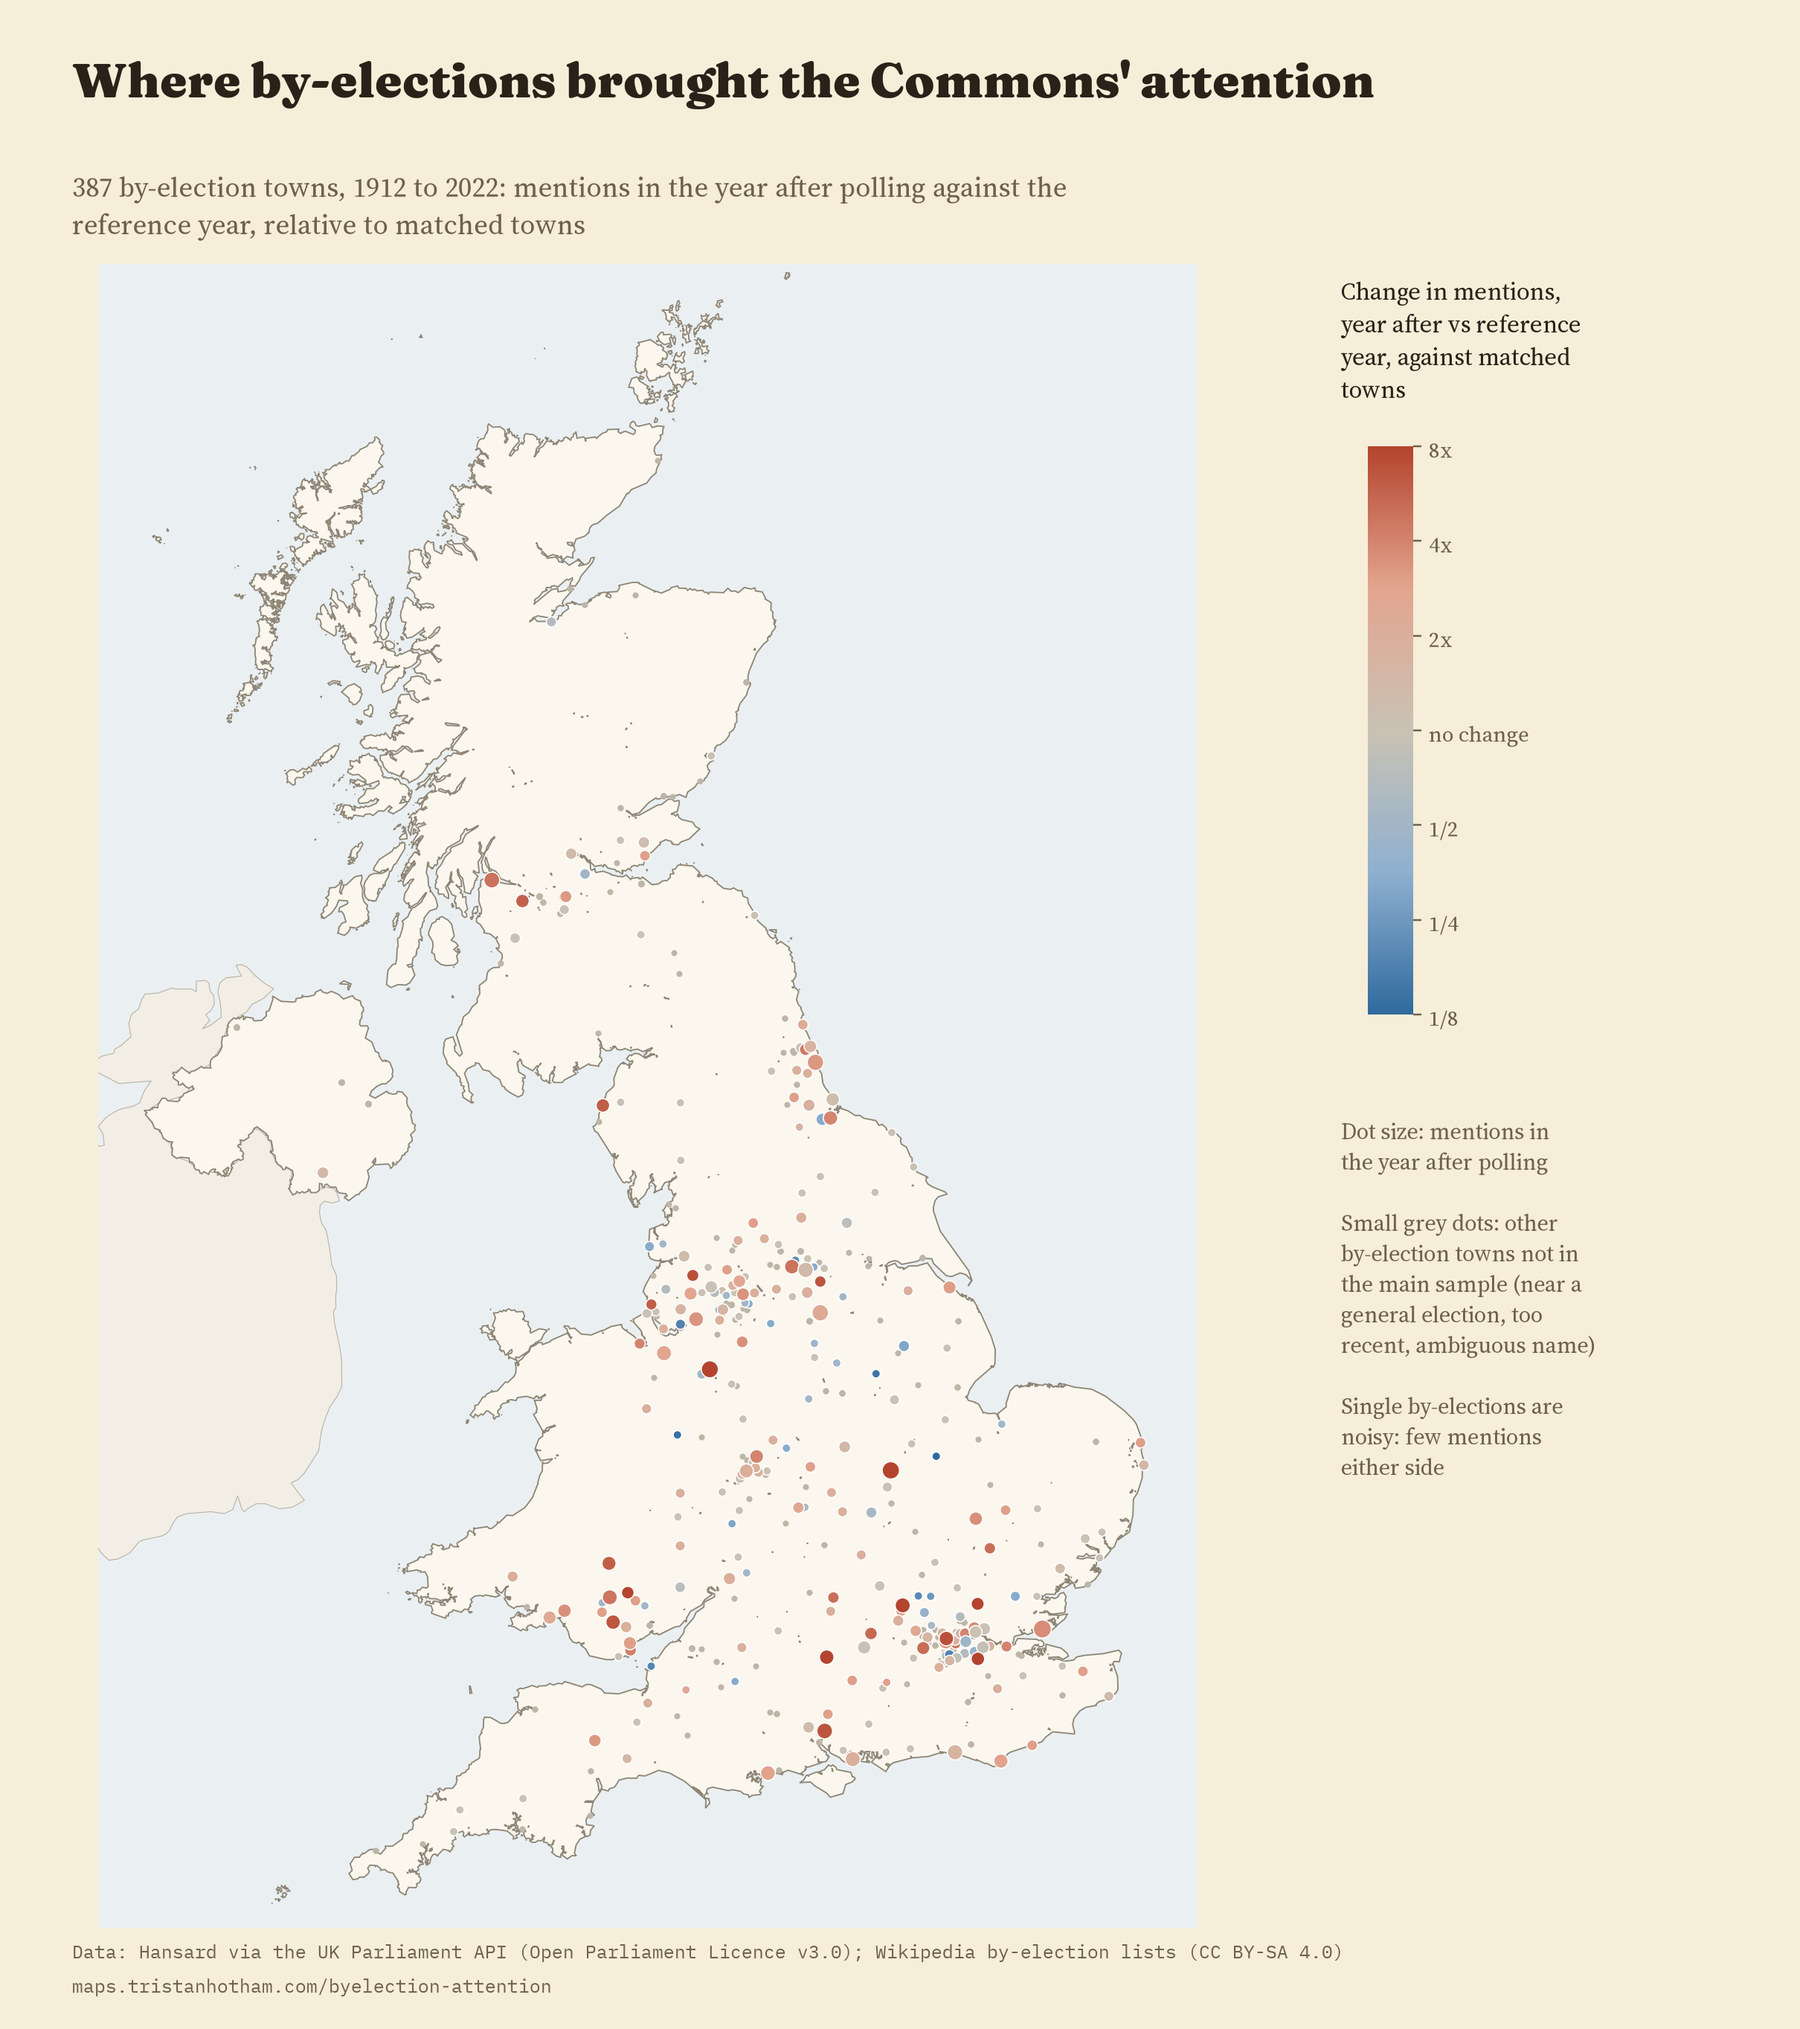
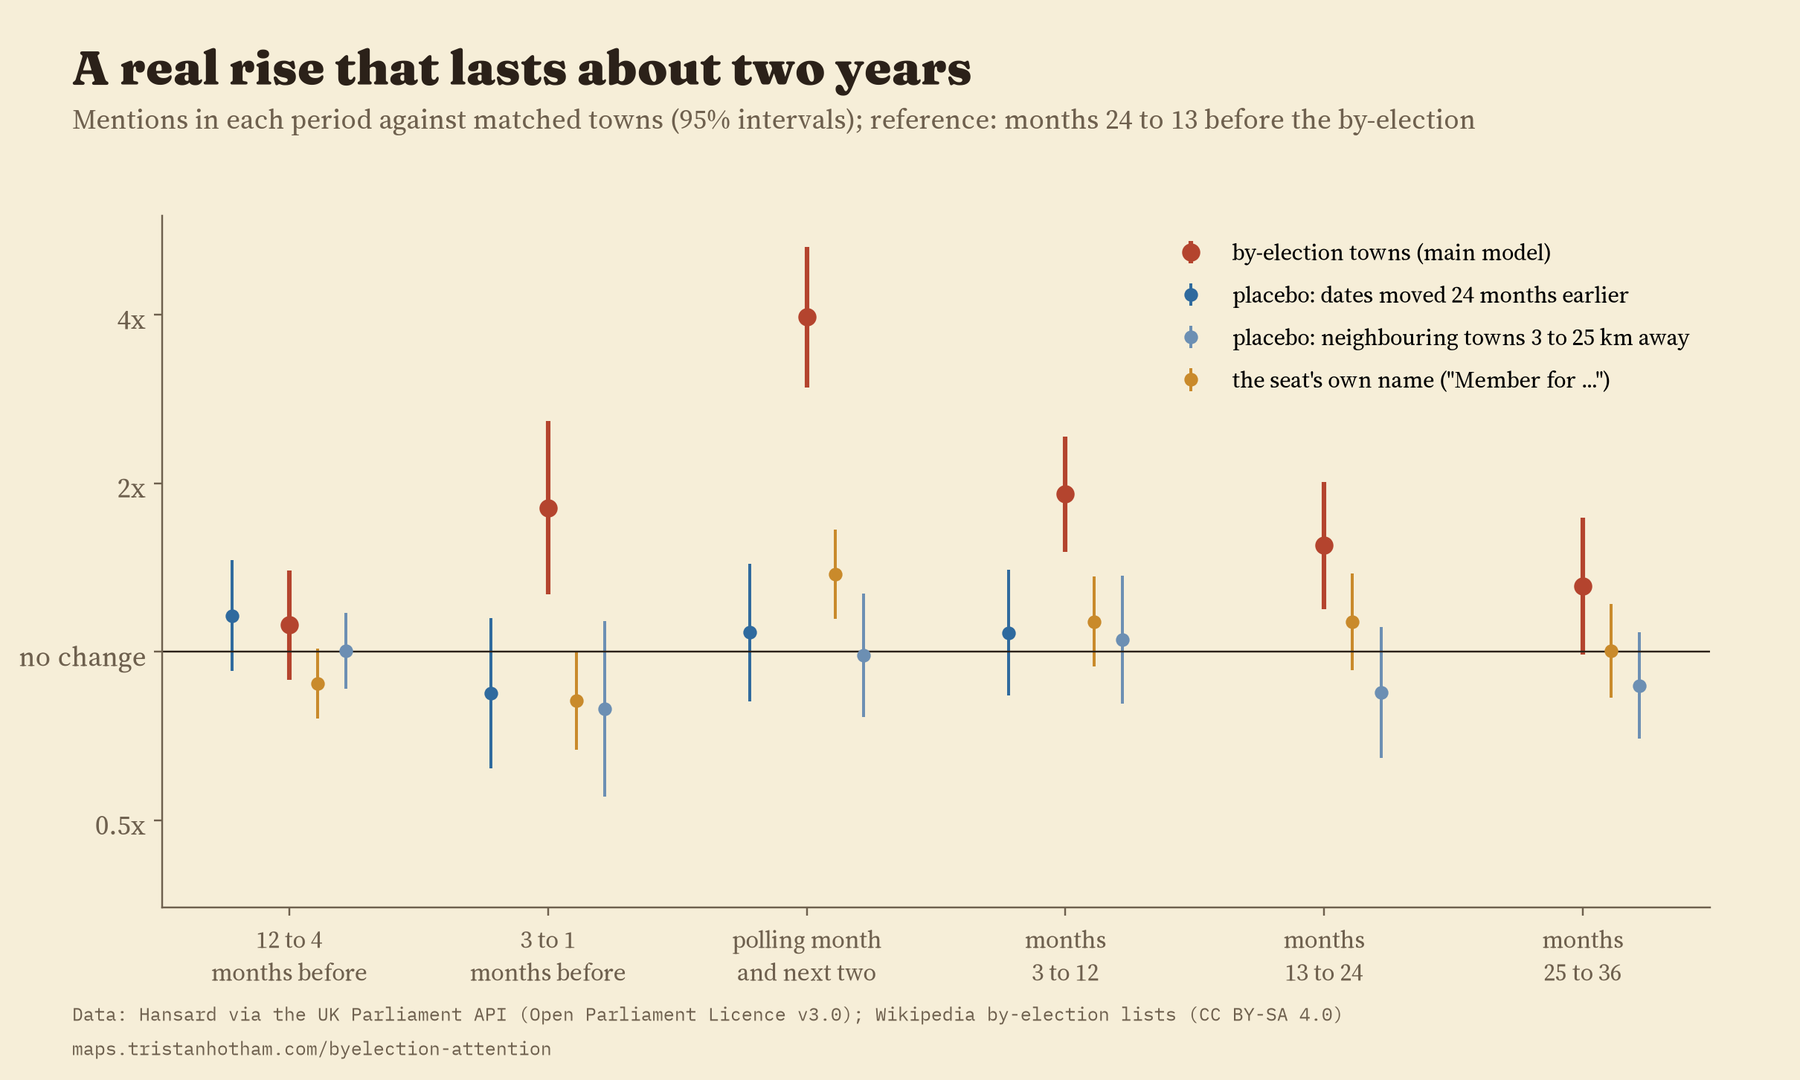
Most towns are not mentioned often. Before their by-elections, the 387 towns in my analysis came up about 1.5 times a year on average. In the month of polling that jumps sharply, and across the polling month and the two after, a by-election town was mentioned 4.0 times as often as its matched towns. The rise starts in the three months before polling day, when the seat is empty and the campaign is running.
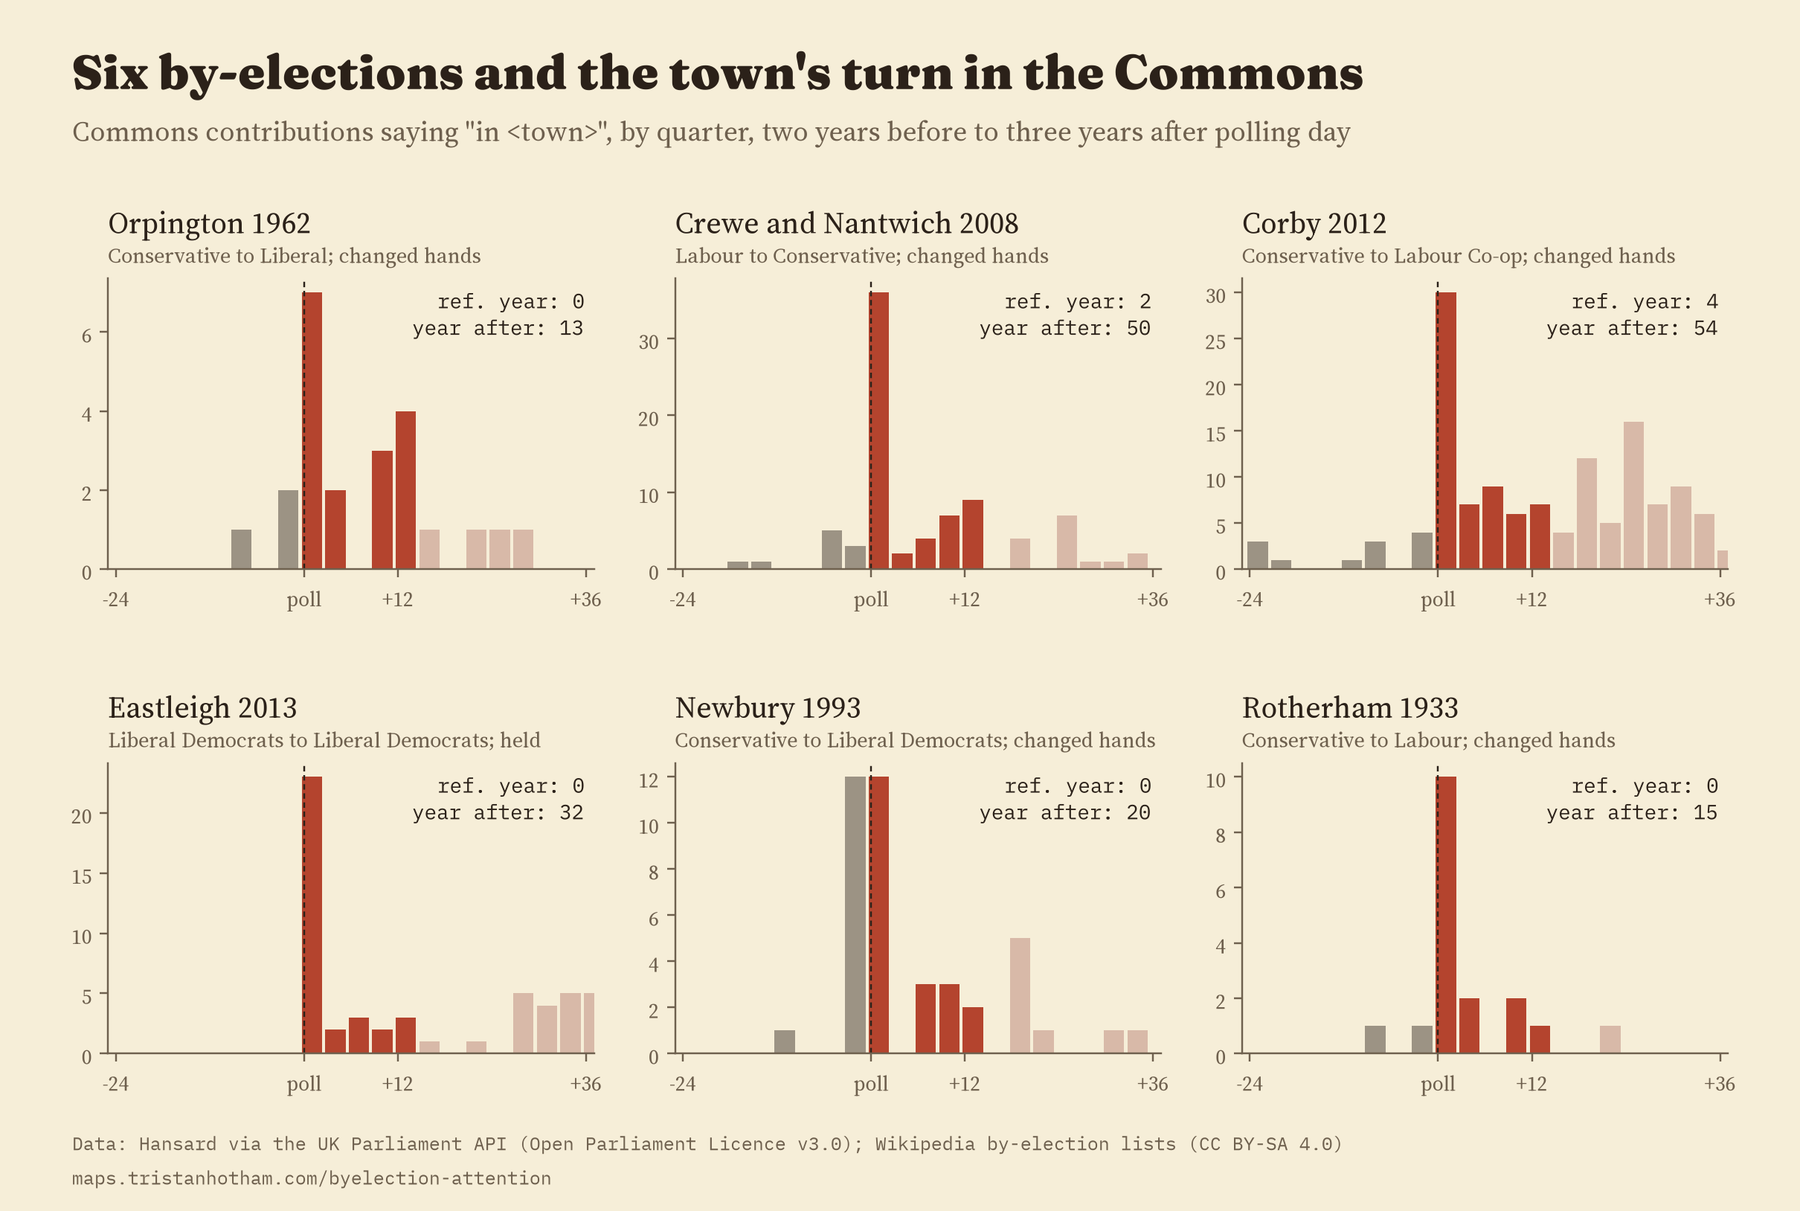
Single towns tell the same story, if more noisily. Orpington was mentioned 0 times in the year I use as a baseline, two years before the Liberals won it in 1962, and 13 times in the polling month and the twelve after. Crewe went from 2 to 50 around the Conservative gain of Crewe and Nantwich in 2008, and Corby from 4 to 54 in 2012.
Two years, not three
The attention outlasts the campaign. Three to twelve months after polling, by-election towns were still mentioned 1.9 times as often as their matched towns, and in the second year 1.6 times. By the third year the gap (1.3 times) can no longer be told apart from no difference at all, and it holds up in only 7 of the 18 checks I ran. Two years is about what you get.
A by-election buys a town about two years of extra attention in the Commons.
Shocks fade faster
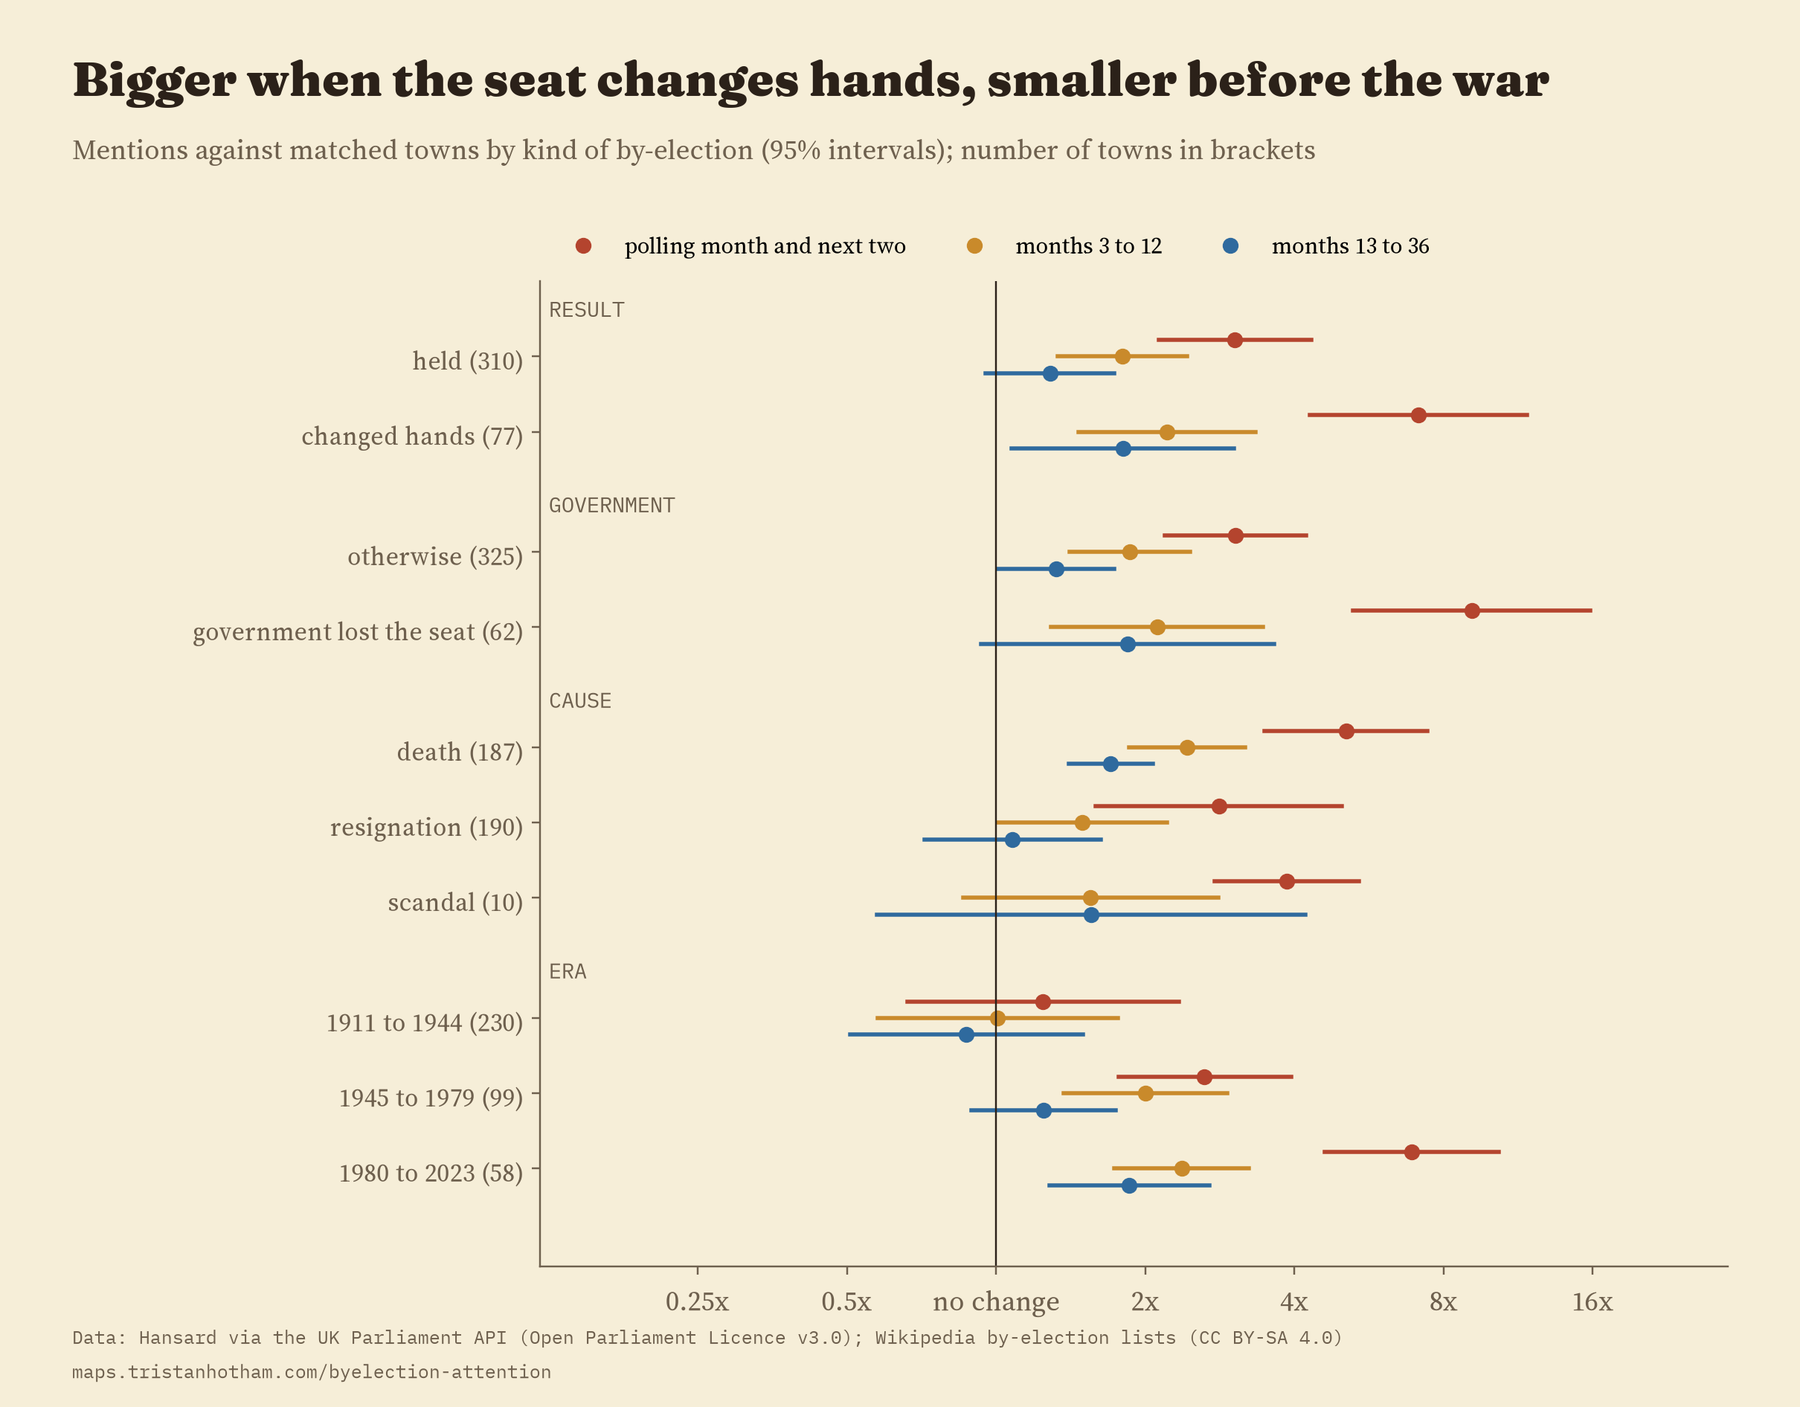
When the seat changed hands, the first jump was bigger: 7.1 times the matched towns against 3.0 times where the seat was held. Where the government lost the seat it was 9.1 times. But that extra excitement fades within months. A year on, the difference between towns whose seat changed hands and towns whose seat was held was no longer clear. Whether the government or the opposition had held the seat made no clear difference at all.
The cause mattered more for the long run. After a member died, the town’s extra attention was larger and lasted longer (2.4 times in months 3 to 12) than after a resignation (1.5 times). There are too few scandals, 10 towns, to say anything useful about them.
Before 1945, no clear rise
This was the surprise. For the 230 towns with by-elections from 1911 to 1944 there is no clear sign of a rise, even around polling day. From 1945 to 1979 the first jump is 2.6 times, and from 1980 to 2023 it is 6.9 times. One explanation is that MPs have come to talk much more about their own patch, which is what historians of the constituency role of MPs describe. Another is that the way debates were recorded and searched has changed. The counts alone cannot tell these apart.
Where it should not appear, it does not
I checked the method where nothing should happen. Moving every by-election two years earlier gives nothing. Neighbouring towns three to 25 km away, not in the seat’s name, show nothing either. And the seat’s own name, which you might expect to jump when a new member is introduced as “the hon. Member for” the seat, rises only a little (1.38 times) and only around polling day, so the main result is not that formula. Across 18 other versions of the analysis the first-year rise held every time but one.
How I did this
The by-elections come from the six Wikipedia lists of UK by-elections, parsed row by row: seat, date, the members and parties before and after, whether the seat changed hands, and the cause. The Commons counts come from Hansard’s search, month by month, using the town names, points and ambiguity checks from my earlier study Mentioned in the House. Ambiguous names like Newport, Durham or Boston are left out. So are by-elections within a year of a general election, towns with another by-election close by in time, towns split between three or more seats like Glasgow or Birmingham, and members re-elected after taking office. That leaves 387 towns from 366 by-elections. Each was matched with five towns in the same nation with similar mentions and population beforehand and no by-election of their own. I wrote the analysis plan down before running any model.
This is not an experiment. A death, a resignation or a scandal is news in itself, so what I measure is the whole episode, from empty seat to new member, not the effect of the vote alone. “In” plus a town’s name is only one way of mentioning a place, and county seats count only through the towns in their names. The counts also cannot say who was speaking. My guess is that a lot of it is the new member talking about home, but that is a guess.
Notes and sources
- Hansard, House of Commons, monthly counts from the UK Parliament Hansard API. Contains Parliamentary information licensed under the Open Parliament Licence v3.0.
- Wikipedia contributors, “List of United Kingdom by-elections” (six pages, 1900 to the present), CC BY-SA 4.0; checked against Wikidata (CC0).
- Town names and ambiguity checks from Mentioned in the House (Hotham 2026); seat points and general election dates from Who Won Here? (Hotham 2026). Base map: OpenFreeMap, OpenStreetMap contributors (ODbL).
- Further reading: C. Cook and J. Ramsden (eds), By-Elections in British Politics (1997); P. Norris, British By-Elections: The Volatile Electorate (1990); P. Norton and D. Wood, Back from Westminster (1993).
- I wrote the text, with drafting and editing assistance from Claude (Anthropic), which also helped prepare the analysis code. I reviewed and checked all text and results.

