
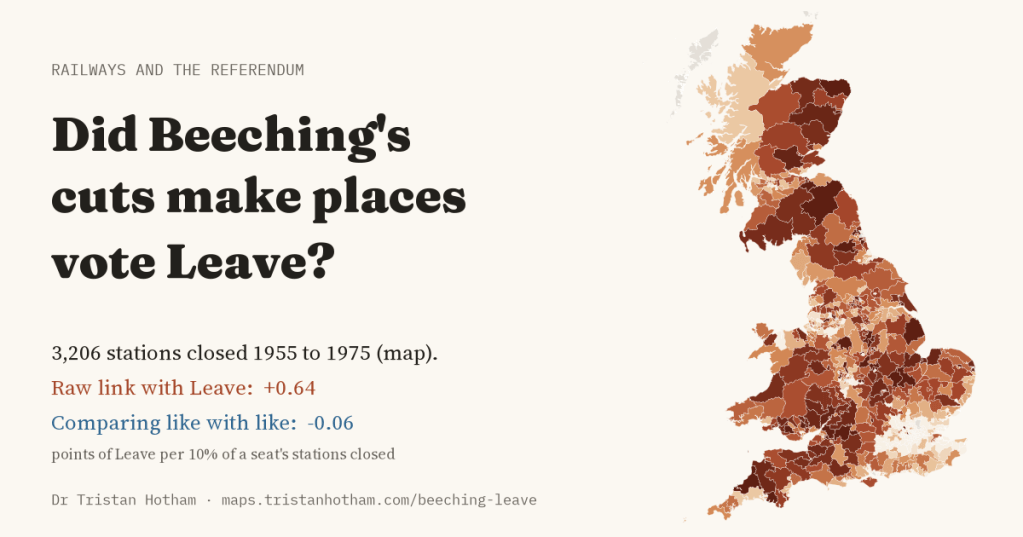
Between 1955 and 1975 Britain closed thousands of railway stations, most of them in the years after the Beeching report. Half a century later the places that lost their trains voted to leave the European Union. I wanted to know whether one had anything to do with the other.
There is a story about the 2016 referendum that almost everyone has heard. The places that voted Leave were the places that had been left behind: small towns, old industrial districts and the countryside, places that had watched their jobs, shops and services drain away while the cities did well. Academics call them “the places that don’t matter”. If you want a single, concrete symbol of that kind of loss, it is hard to beat the closed railway station, with its platform grown over and its line turned into a footpath.
So I took every station in Great Britain that was open in 1955, put each one into its parliamentary constituency, and worked out how much of its railway each seat lost by 1975. Then I set that against the Leave vote. Before I looked at any results I wrote down exactly which comparisons I would make and what would count as an answer, so that I could not go fishing for one.
Two maps that look alike
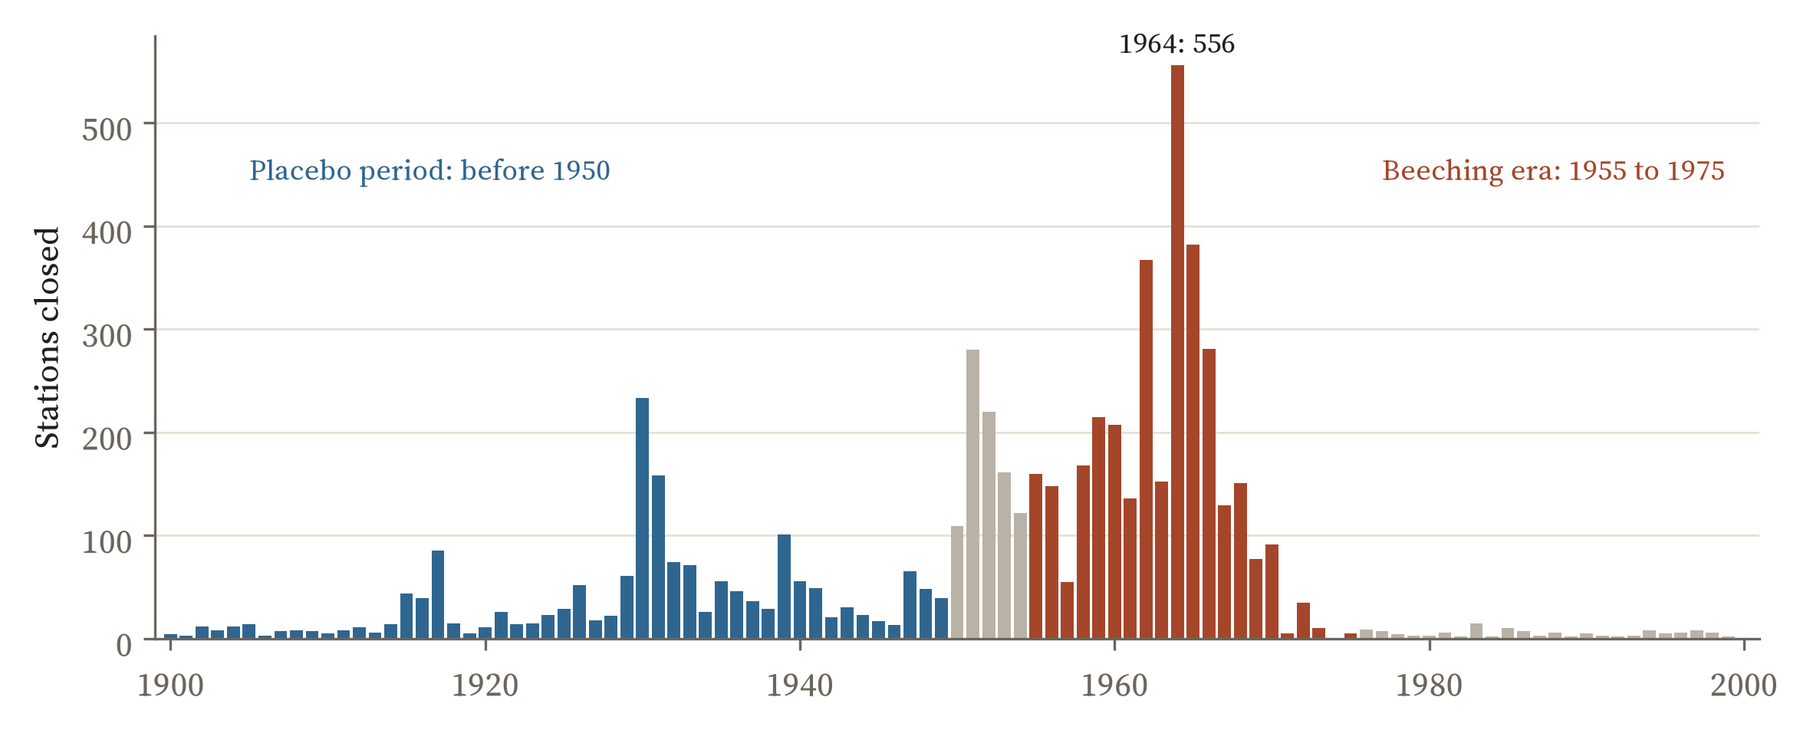
Of the 5,616 stations open in 1955 in the seats I could measure, 3,206 had closed by 1975. The worst year was 1964, the year after the Beeching report, with 556 closures. The cuts fell on rural Scotland, Wales, the South West, Lincolnshire and East Anglia, and on the small towns of the Midlands and the North. 52 constituencies lost every station they had. London and the commuter belt kept most of theirs.
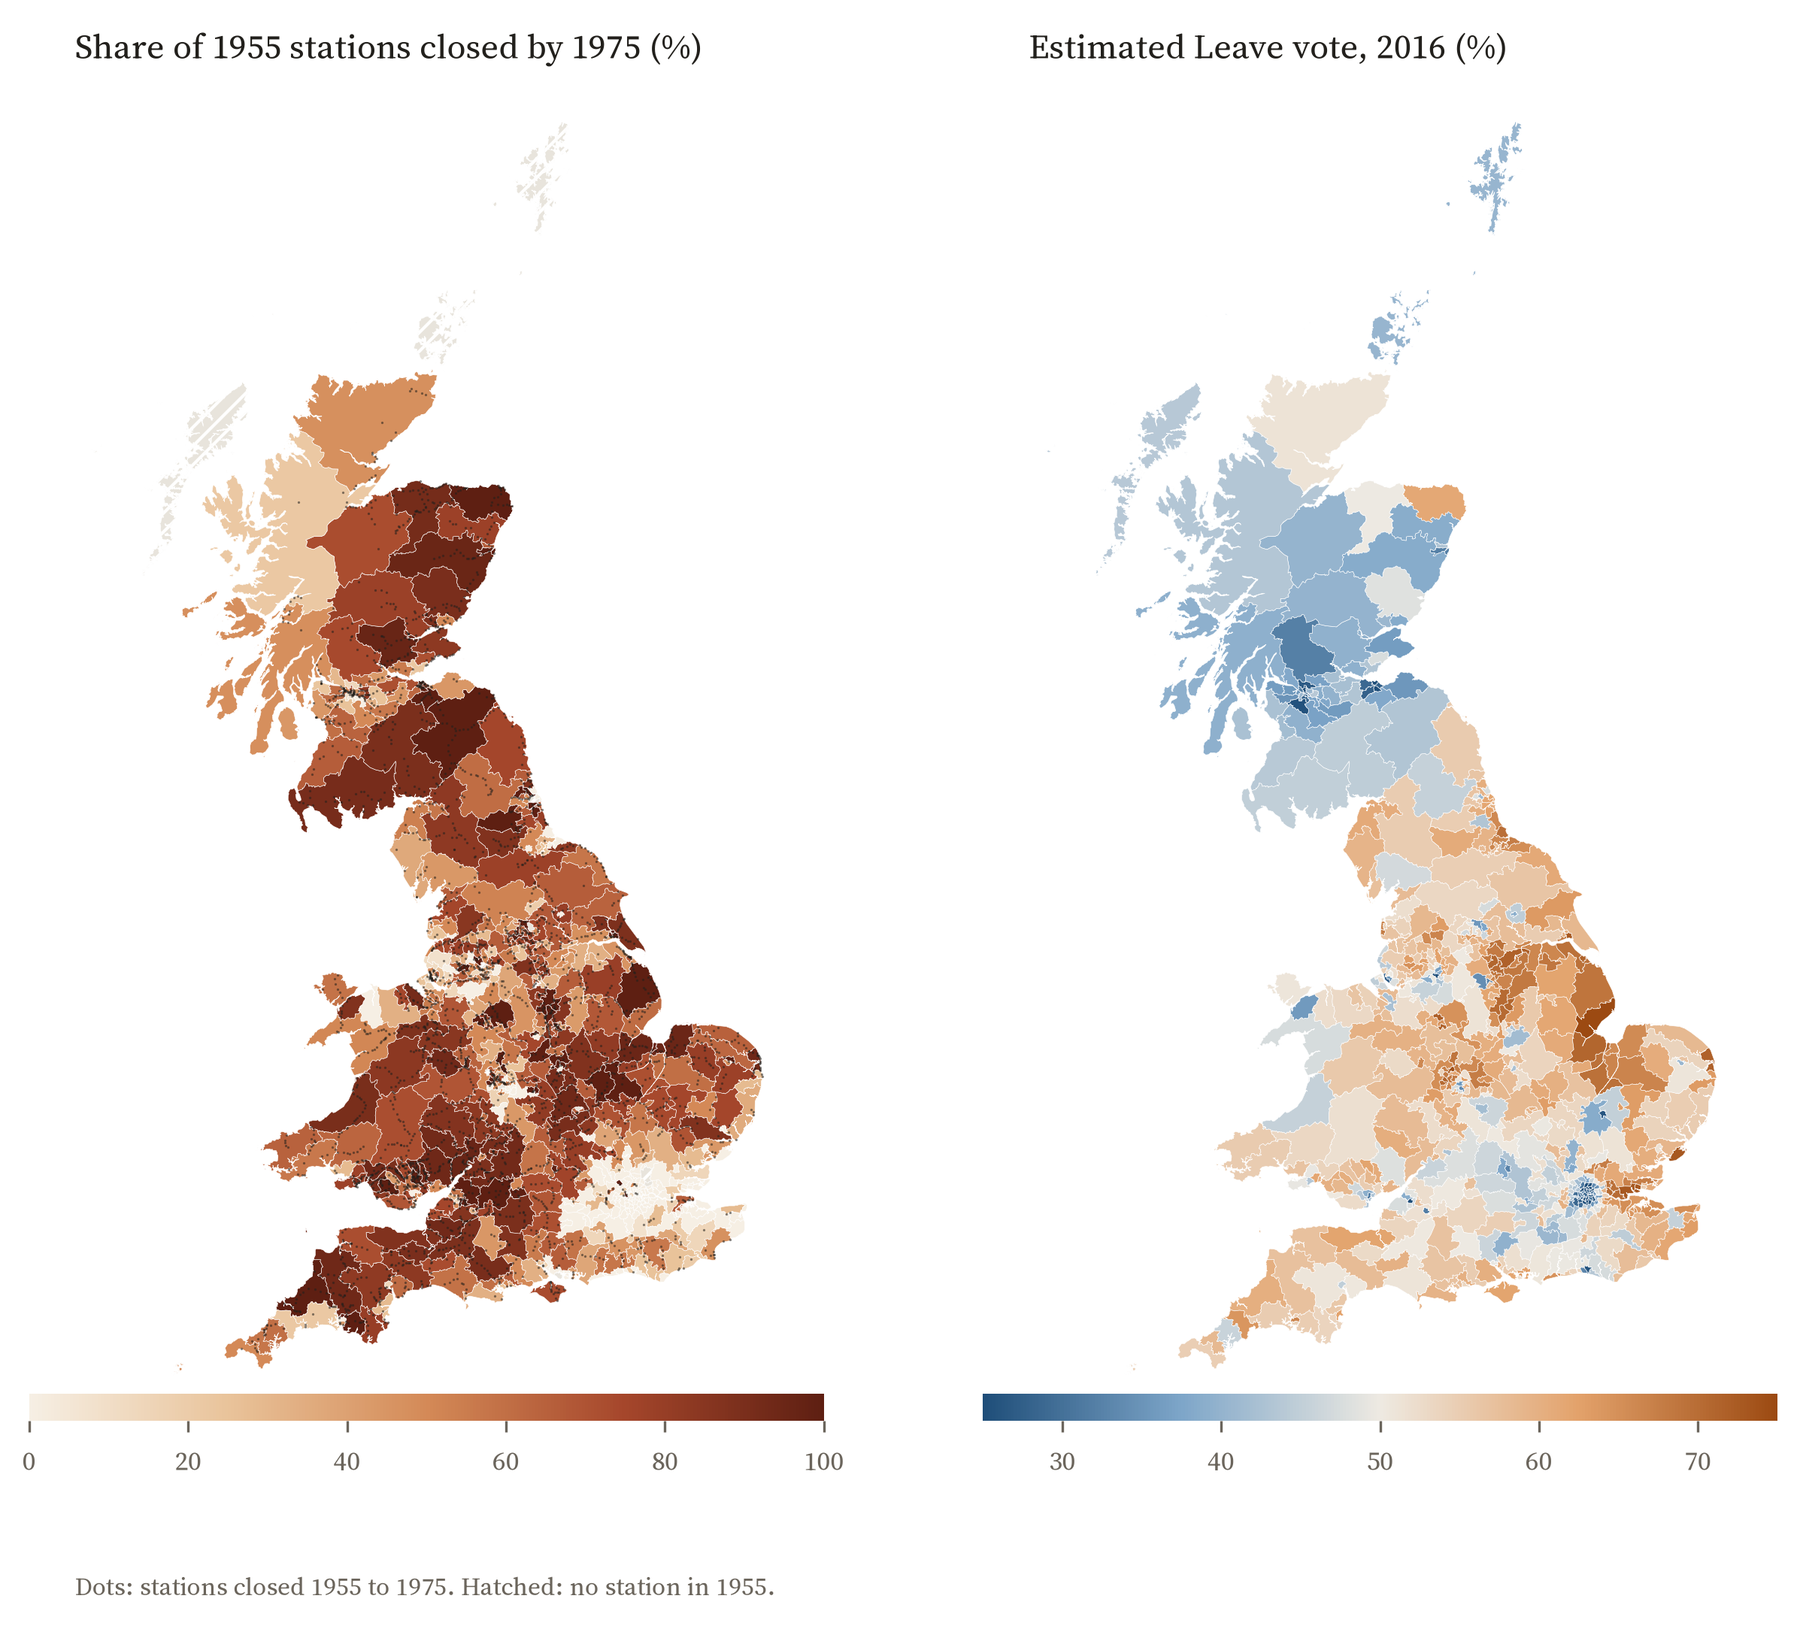
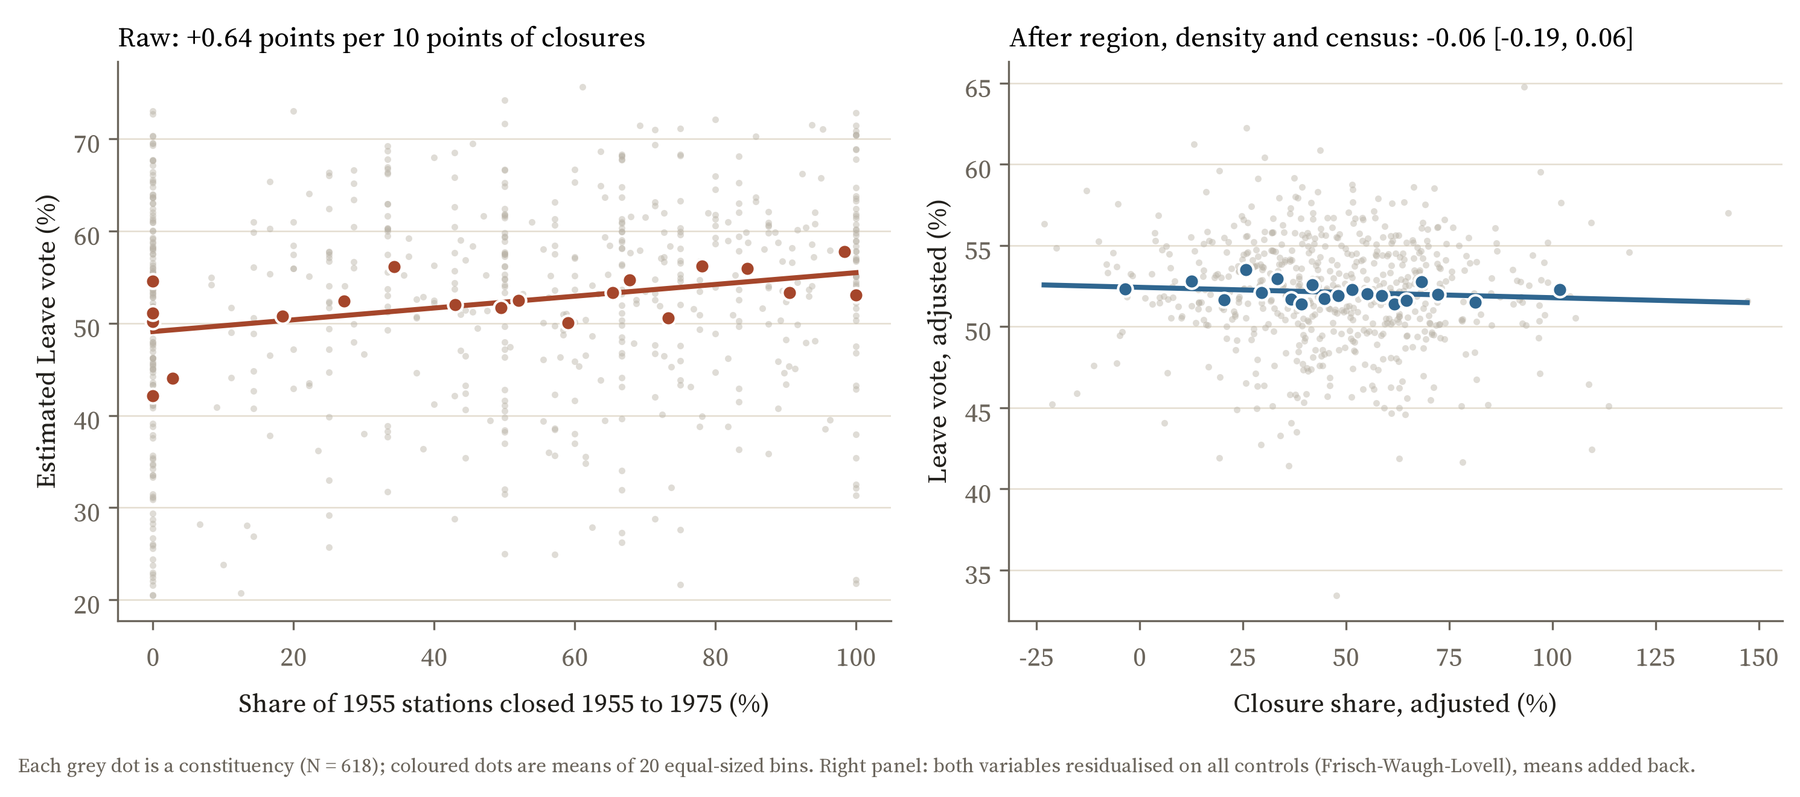
Put that map next to the referendum and the resemblance is there. Seats that lost more of their railway voted Leave more often: 0.64 percentage points more for every extra 10% of their stations closed. The third of seats that lost the most voted Leave by 5.2 points more than the third that lost the least.
Comparing like with like
The trouble is that the cuts did not fall at random. Beeching closed lines that few people used, and few people used them because they ran through thinly peopled country. The seats that lost most of their stations were more rural, further from a city, older and whiter, with fewer graduates and more people in routine jobs. Those are exactly the things that predicted a Leave vote anyway, railway or no railway.
So the real question is whether two seats that are alike in all those ways, but differ in how much railway they lost, voted differently. I compared seats in the same region, with the same density of people, the same distance from a city of 100,000, the same size of railway in 1955, and the same mix of ages, qualifications, jobs, birthplaces and housing from the 2011 census. The gap vanishes. It comes out at -0.06 points for every 10% of stations closed, with a 95% range from -0.19 to 0.06. That is very close to nothing, and the range is narrow enough to rule out any effect big enough to matter.
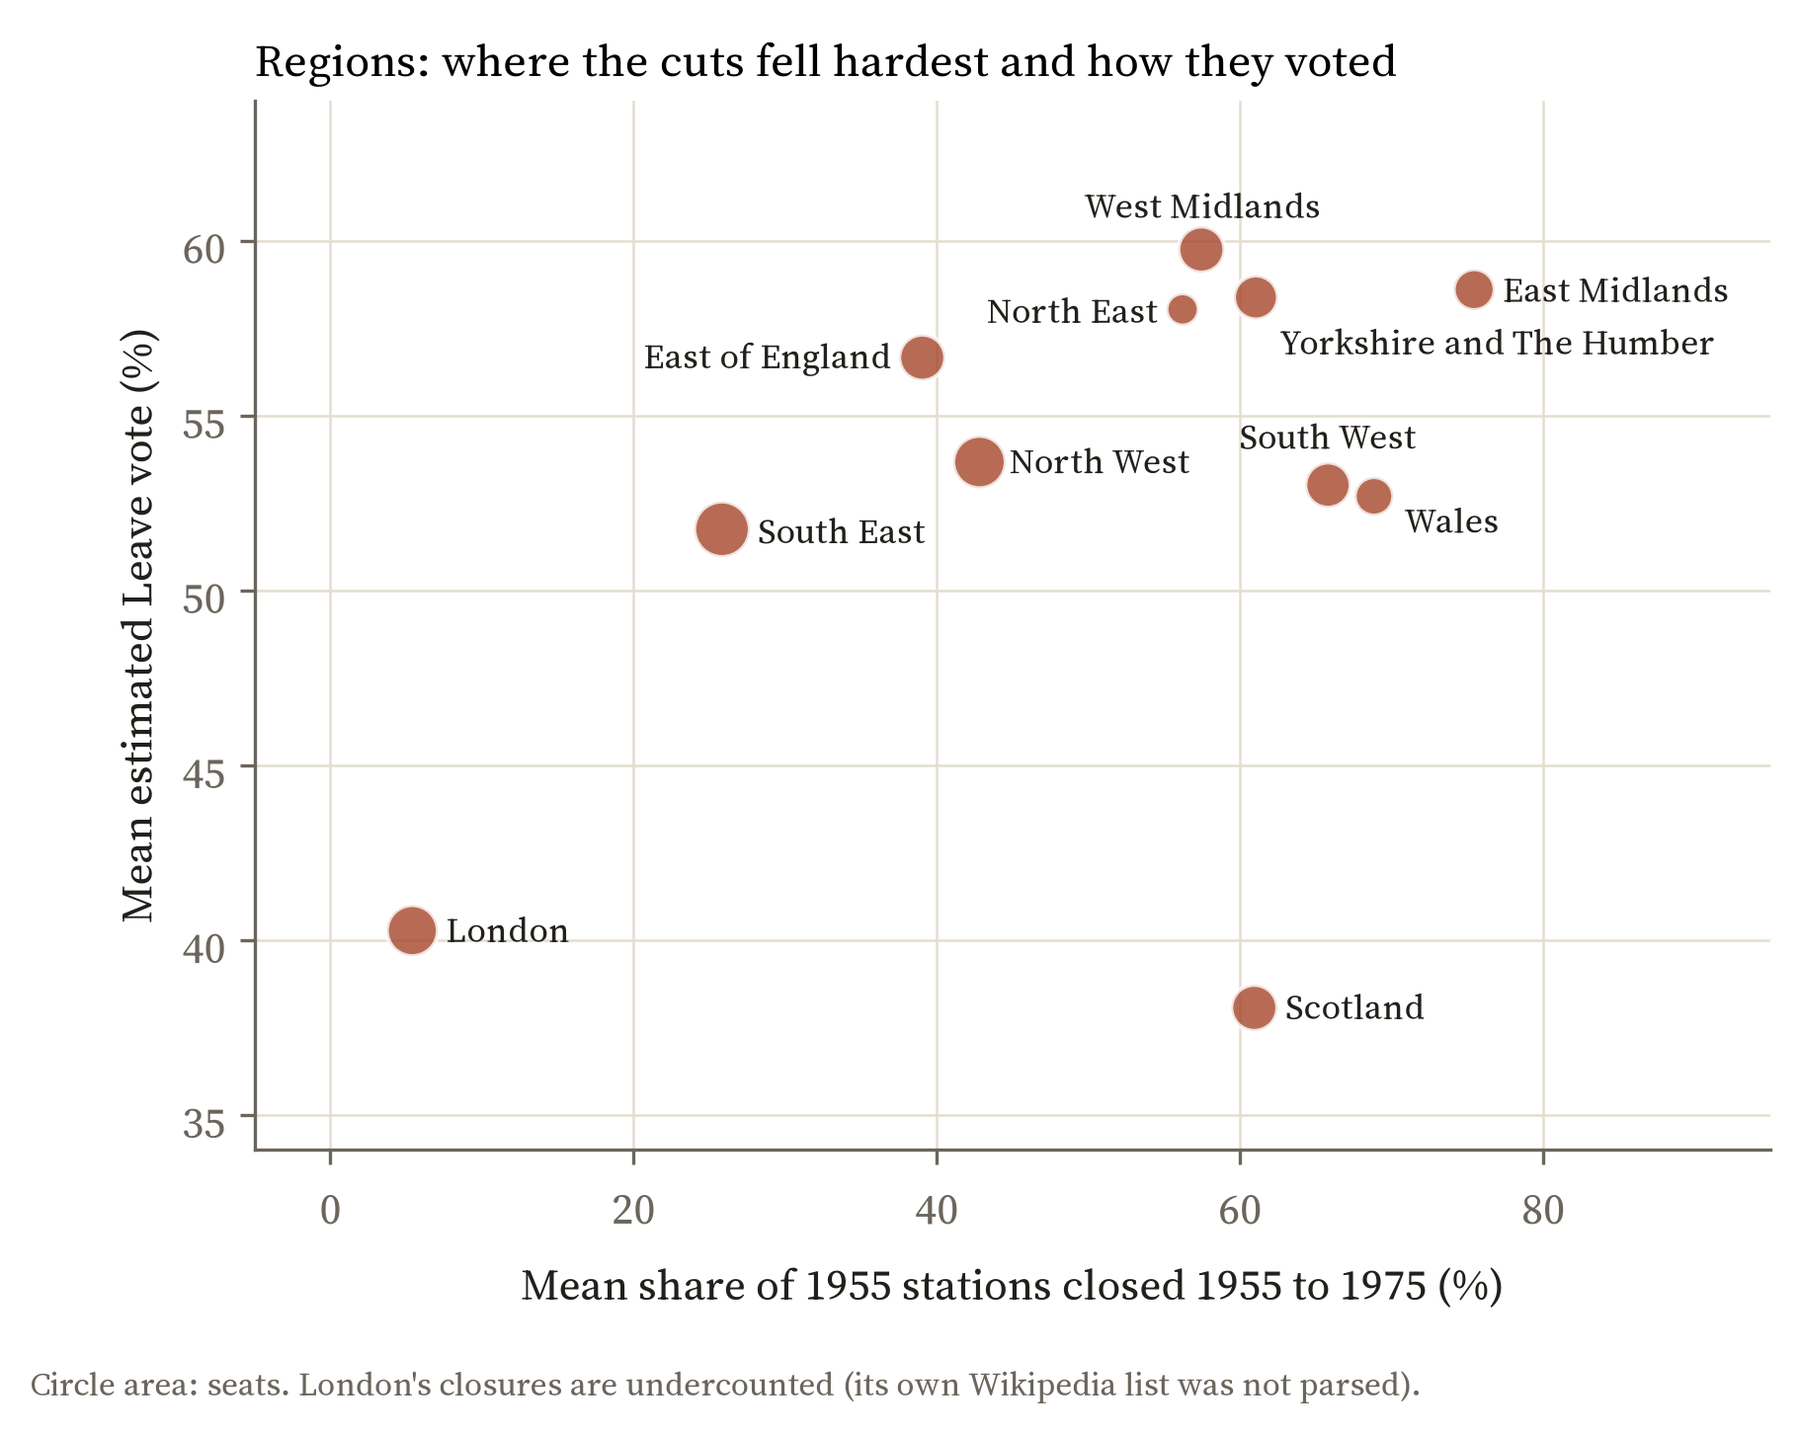
Most of the simple link turns out to be about regions. London, whose closures are also undercounted in the lists I used, voted strongly Remain and lost little. Scotland lost 61% of its 1955 stations on average and voted only 38% Leave. The English Midlands lost a lot and voted Leave heavily. Just comparing seats within the same region removes 83% of the link.
The cuts fell on the kind of places that voted Leave. Compared with similar places nearby, the places that lost their railway voted no differently.
Trying hard to find something
A null result is only worth reporting if you have looked properly, so I ran every check I had planned. Closures before 1950, which had nothing to do with Beeching, show no link. Closures that were later reversed, where the trains came back, show none either. The answer is the same if I use only the seats where the referendum was actually counted ward by ward, leave out the areas where the station lists are incomplete, look at England alone, count closed stations per head instead of as a share, or pair up each high closure seat with its most similar low closure neighbour in the same region. Of the 13 variations, the only one that comes out clearly different from zero points the other way: counting only the peak Beeching years of 1963 to 1970, seats that lost more voted slightly less Leave.
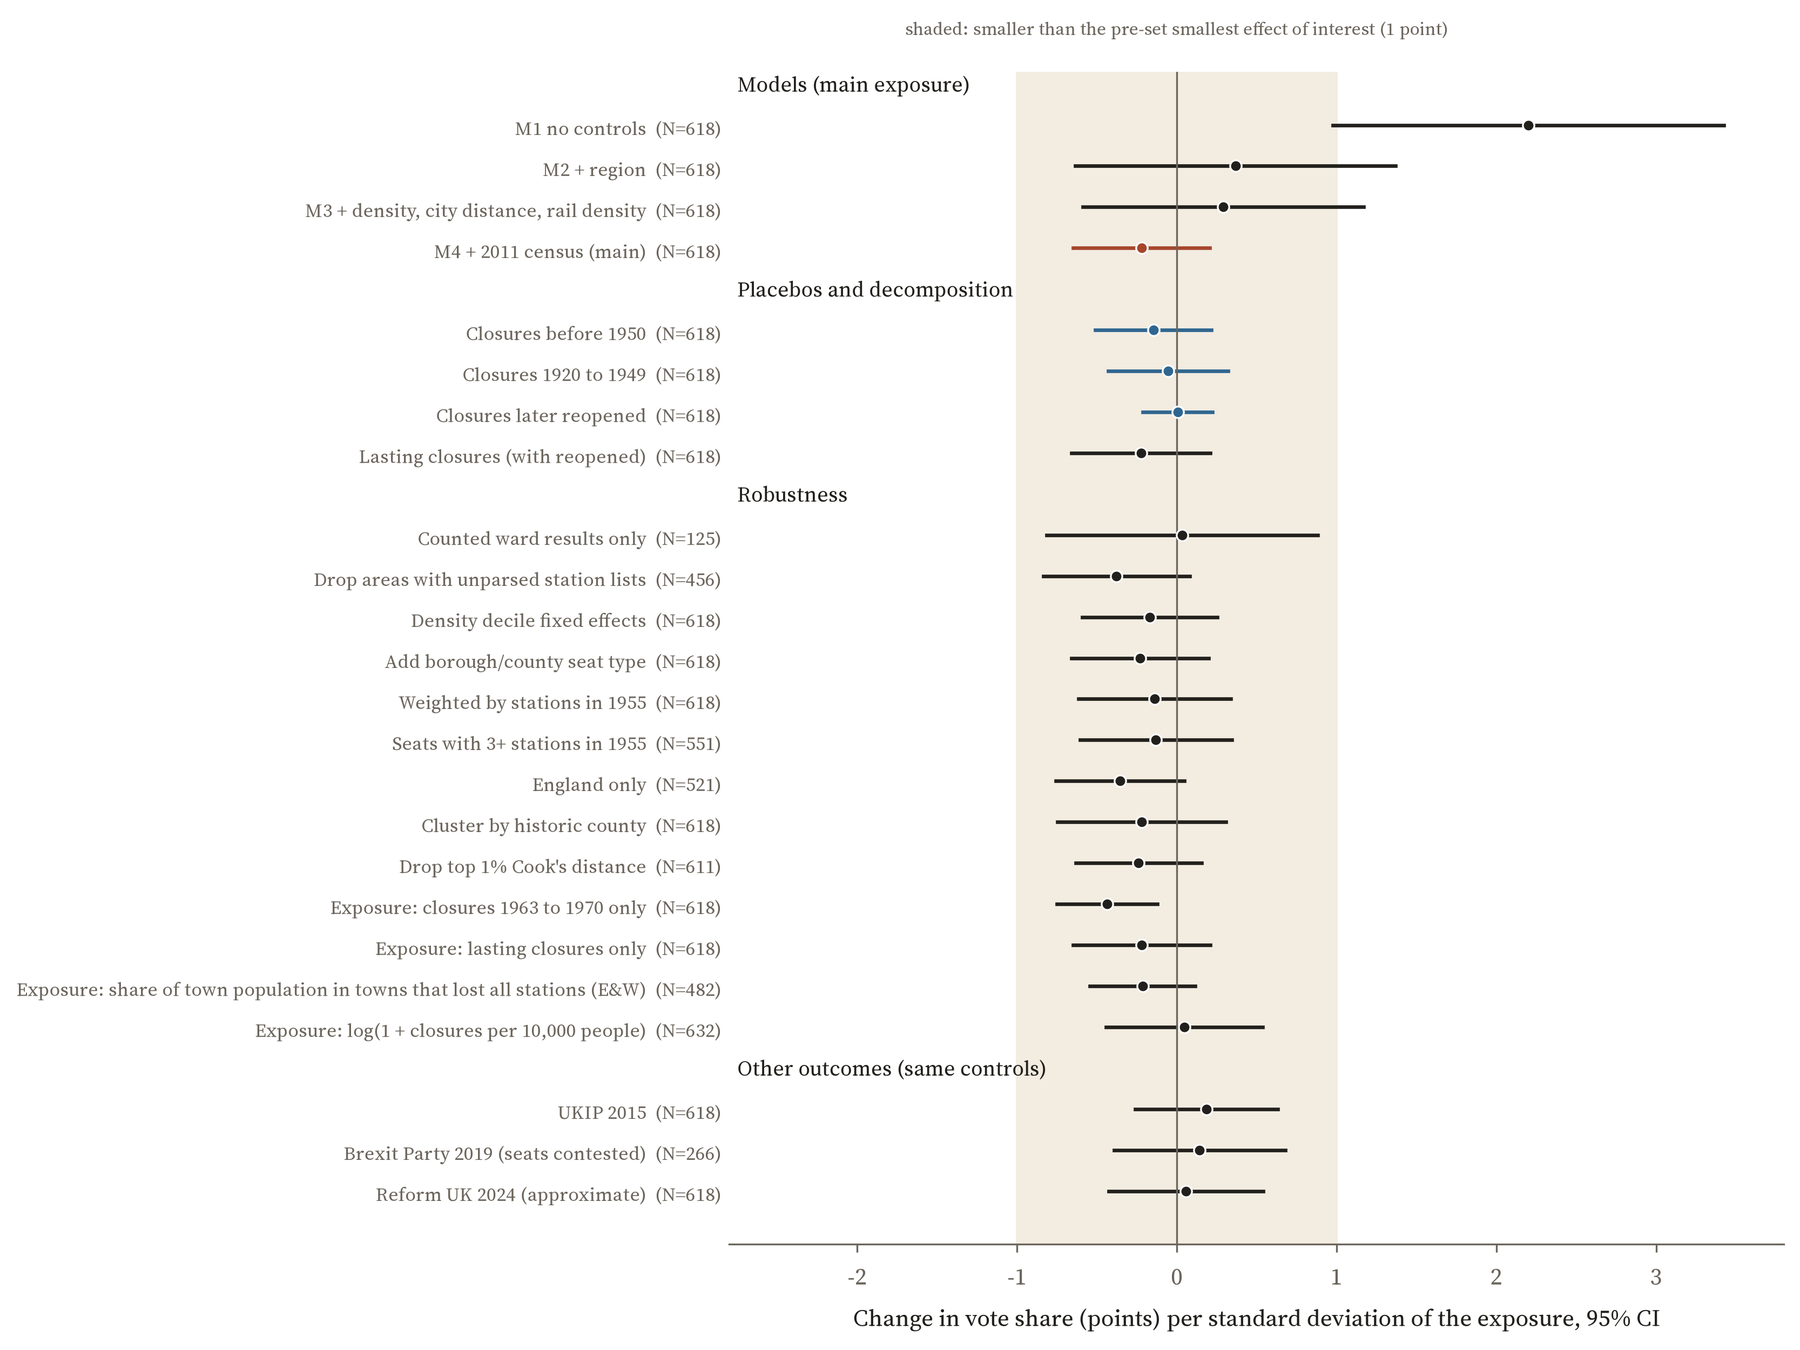
The later votes tell the same story. Seats that lost more stations gave more votes to UKIP in 2015, the Brexit Party in 2019 and Reform UK in 2024, but once like is compared with like the differences shrink to a fraction of a point: 0.05, 0.04 and 0.02 points per 10% of stations closed, none of them distinguishable from zero.
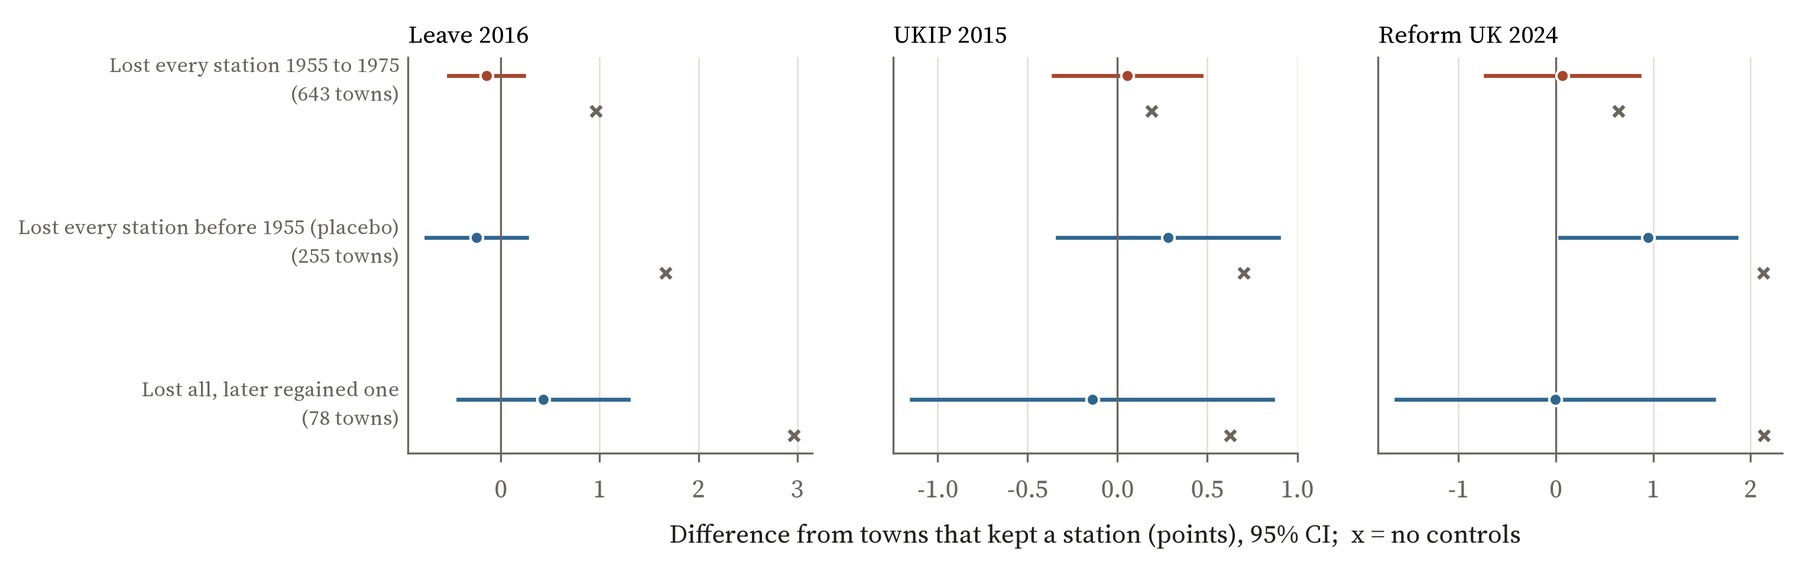
I also looked at towns rather than constituencies. 643 towns in England and Wales lost every station they had between 1955 and 1975 and still have none, among them Louth, Mablethorpe, Coningsby and Alford in Lincolnshire. 981 similar towns kept a station. Once size, region and their surroundings are taken into account, the Leave vote around the two groups differs by -0.15 points.
What this does and does not say
It does not say the cuts were harmless. Economists who have studied the Beeching closures find that places which lost their rail links lost people, jobs and young, skilled workers over the following decades. If that is right, the cuts helped to make some places older and less qualified, and those are the very things that went with voting Leave. Some of the Leave vote in those places may trace back to the cuts in that roundabout way, and my comparison, which holds age and qualifications fixed, cannot see it.
What it does say is that there is no sign of a separate trace of the cuts themselves: no extra Leave vote in places that lost their station, over and above what you would expect from the kind of place they are today. The memory of Beeching is vivid, and the politics of reopening old lines has often been framed as making up for places left behind. But on this evidence the lost station did not, by itself, change how those places voted half a century later. The seats where closures were later reversed voted just like the rest.
It is also a lesson about maps. Two maps of Britain that look alike are not much evidence of a link between the things mapped, because so much of Britain’s political geography follows the same lines of town and country, young and old. The interesting question is always what is left once you compare like with like. Here, the answer is nothing that the data can detect.
How I did this
The stations come from my earlier study, Did Beeching kill your town?, which mapped every entry in Wikipedia’s lists of closed stations in Great Britain and today’s National Rail stations, with their state in 1975. I placed each station in a 2010 Westminster constituency. A seat’s closure share is the number of its stations that closed from 1955 to 1975, divided by the number open in 1955. Because the referendum was counted by council, not by constituency, the Leave figures are Chris Hanretty’s estimates for each seat, using the actual ward counts where councils released them. The census figures are from 2011. The comparisons are regressions, with the uncertainty allowing for seats in the same council being linked. I wrote down the plan, the checks and what would count as a meaningful effect (one point of Leave for a typical difference in closures) before running anything.
The caveats. This is a comparison of places, not an experiment, so it cannot prove what caused what. The Leave figures are estimates. Wikipedia keeps separate lists for London, Greater Manchester, Merseyside, the West Midlands, Lancashire and Norfolk that I did not use, so closures there are undercounted, although leaving those areas out changes nothing. A constituency is a big unit for a loss felt by a town or a village. And people move: most of the voters of 2016 were not living in the same place when the trains stopped. Tap any seat or town on the map to see its own numbers.
Notes and sources
- Closed stations: Wikipedia, “List of closed railway stations in Great Britain” (CC BY-SA 4.0), placed with Wikidata (CC0) and OpenStreetMap (ODbL). National Rail stations: uk-railway-stations by David Wheatley (ODbL).
- Leave estimates: Chris Hanretty, Areal interpolation and the UK’s referendum on EU membership, Journal of Elections, Public Opinion and Parties (2017), via the parlitools R package by Evan Odell. Census 2011 by constituency: ONS and National Records of Scotland (Open Government Licence). 2019 results: British Election Study. 2015 and 2024 results: elections-since-1832 dataset. Boundaries: ONS and Ordnance Survey (Open Government Licence).
- On the long-run effects of the closures: Stephen Gibbons, Stephan Heblich and Edward Pinchbeck, The spatial impacts of a massive rail disinvestment program: the Beeching axe, Journal of Urban Economics (2024). On “places that don’t matter”: Andrés Rodríguez-Pose, Cambridge Journal of Regions, Economy and Society (2018).
- I wrote the text, with drafting and editing assistance from Claude (Anthropic), which also helped prepare the analysis code. I reviewed and checked all text and results.

