
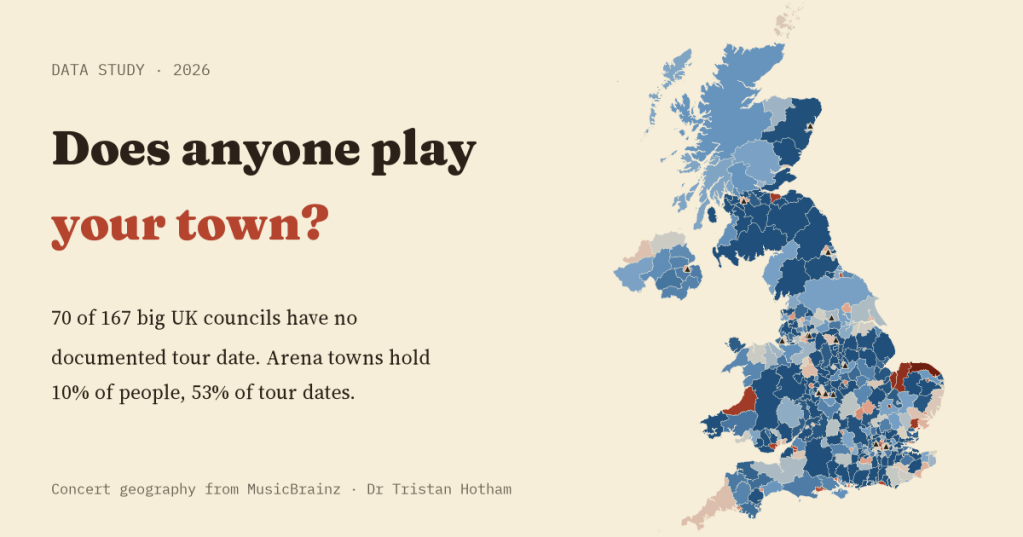
Volunteers have typed 7,615 UK concerts from 1960 to 2025 into MusicBrainz, the open music encyclopaedia. I put every one on the map to see which towns this record remembers. 70 of the 167 council areas with 150,000 or more people have no documented tour date at all.
Every gig leaves a trace somewhere: a ticket stub, a poster, a review, a blurry photo. Some of those traces end up in MusicBrainz, a free database of music that anyone can edit. It records events too: a date, a venue and the acts who played. It is the kind of source that makes a data person’s ears prick up. Could it tell us which towns bands actually play, and which they drive straight past?
Short answer: not quite. What it can tell us is which towns the record remembers. That turns out to be a story in itself.
A thin, lumpy record
I streamed the whole MusicBrainz event dump and placed every event in the UK into its local council area. There are 11,329 UK events in all, and 7,615 concerts dated 1960 to 2025. Since 1980 the record holds a median of 120 UK concerts a year. For scale, the 2017 UK Live Music Census found at least 241 spaces where live music is played in Glasgow alone. Across 66 years, MusicBrainz knows of concerts at 57 Glasgow venues.
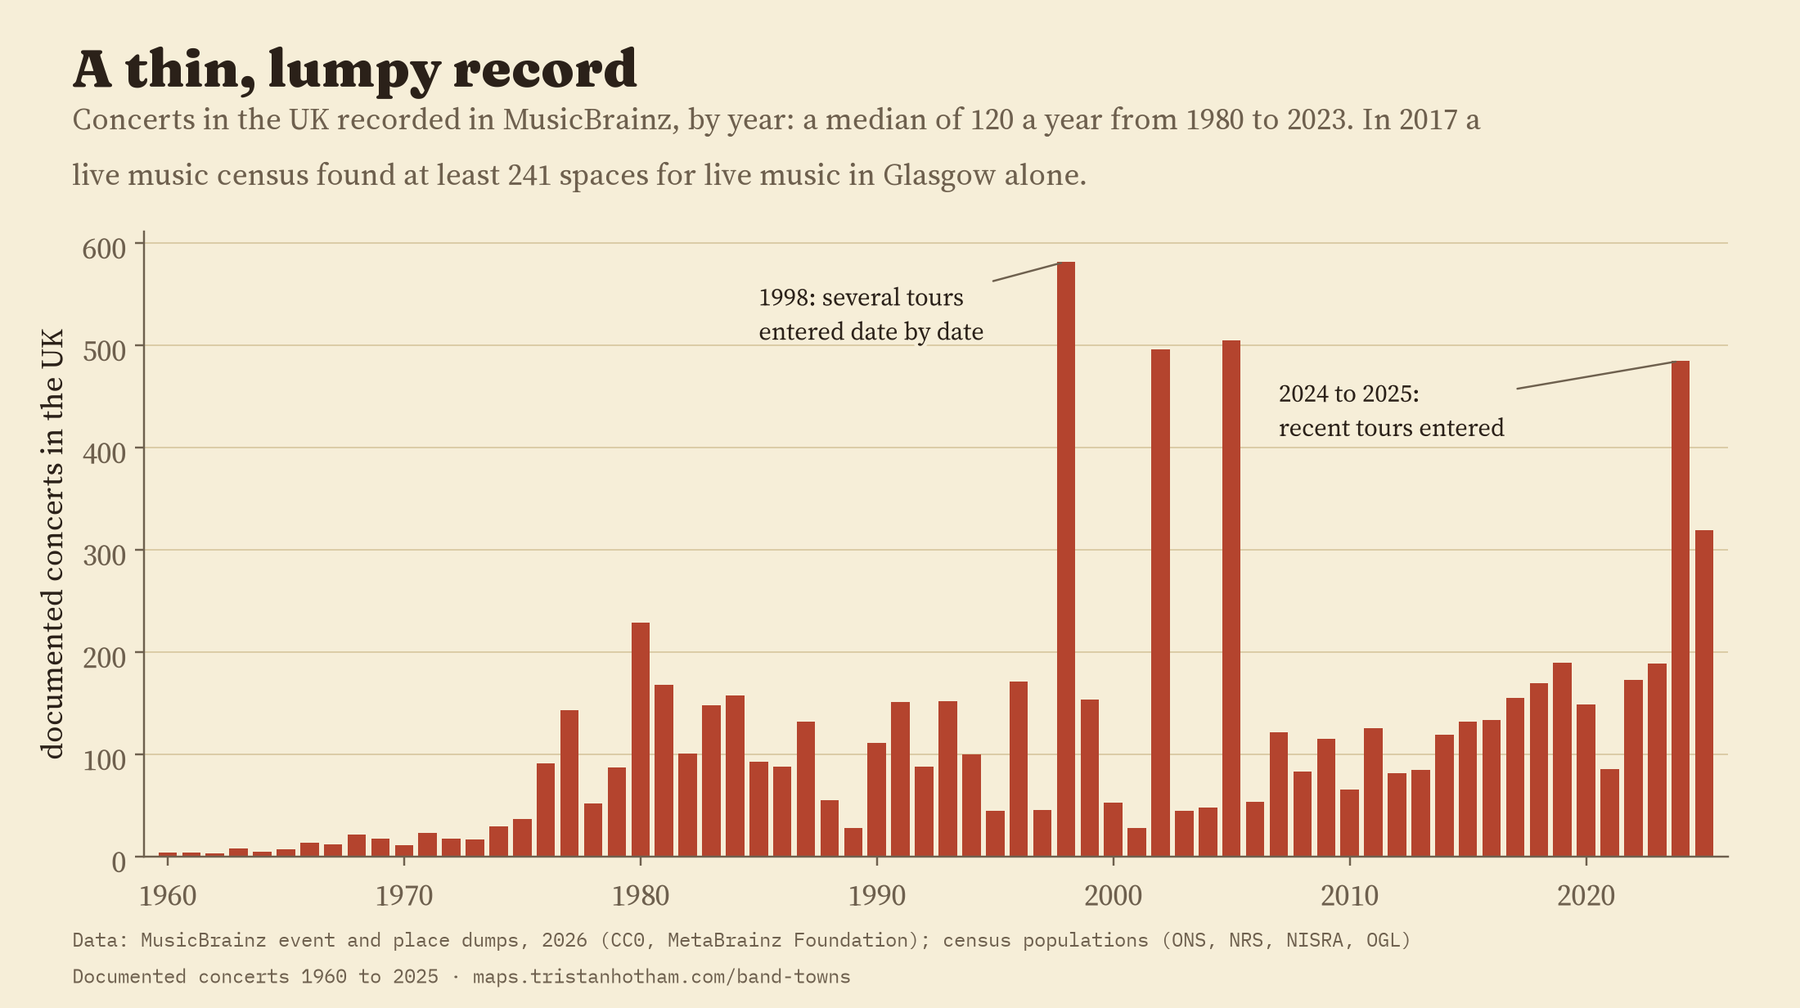
It is also lumpy. The ten most documented acts account for 12% of all documented concerts, led by Barry Manilow with 234. The ten most documented venues hold 26%. Number two is the West Runton Pavilion, a venue in a village on the north Norfolk coast, with 335 concerts, every one from 1975 to 1983. Somebody, bless them, entered a long run of its gigs. That one archive makes North Norfolk the fourth most documented council area in the UK.
So this is a map of memory, not of music. With that firmly in mind, here is what the memory looks like.
Big places, bigger memories
Bigger places have more documented concerts, and more than their size alone would suggest. Double the population of a council area and you get about 213% more documented gigs, not 100%. Researchers who study cities find this pattern for all sorts of things that feed on crowds and networks, from wages to patents, usually with smaller exponents. Here it is steeper (1.64), which is what you would expect if the volunteers who document gigs also favour the big shows in the big places.
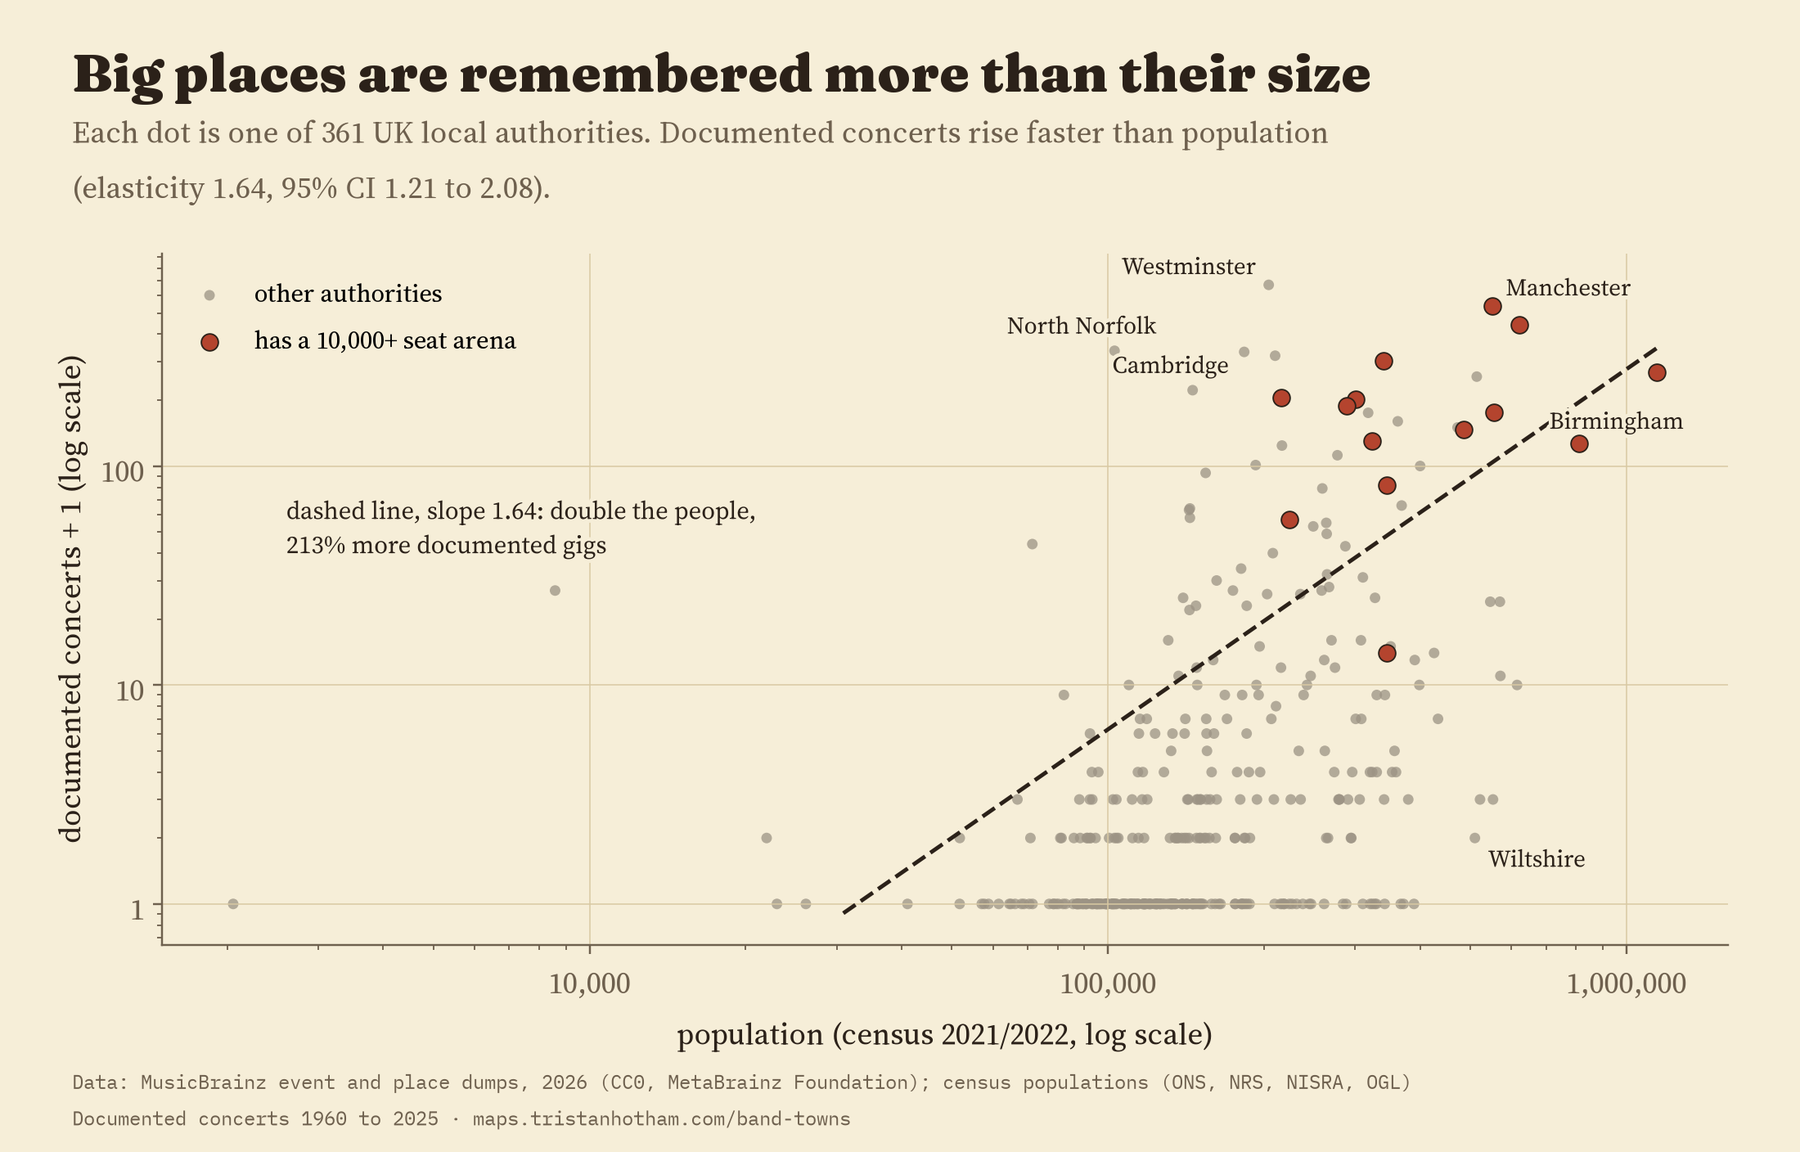
And 161 of the 361 council areas have no documented concert at all. Between them they are home to 21.8 million people.
The arena circuit
The clearest pattern is the arena circuit. Fourteen council areas have an indoor arena with 10,000 or more seats: Manchester, Glasgow, Birmingham and Solihull, Leeds, Sheffield, Newcastle, Liverpool, Nottingham, Coventry, Belfast, Aberdeen, and in London, Greenwich and Brent. Together they hold 10% of the UK’s people. They hold 38% of documented concerts and 53% of documented tour dates, which I define as an act’s year with five or more UK dates.
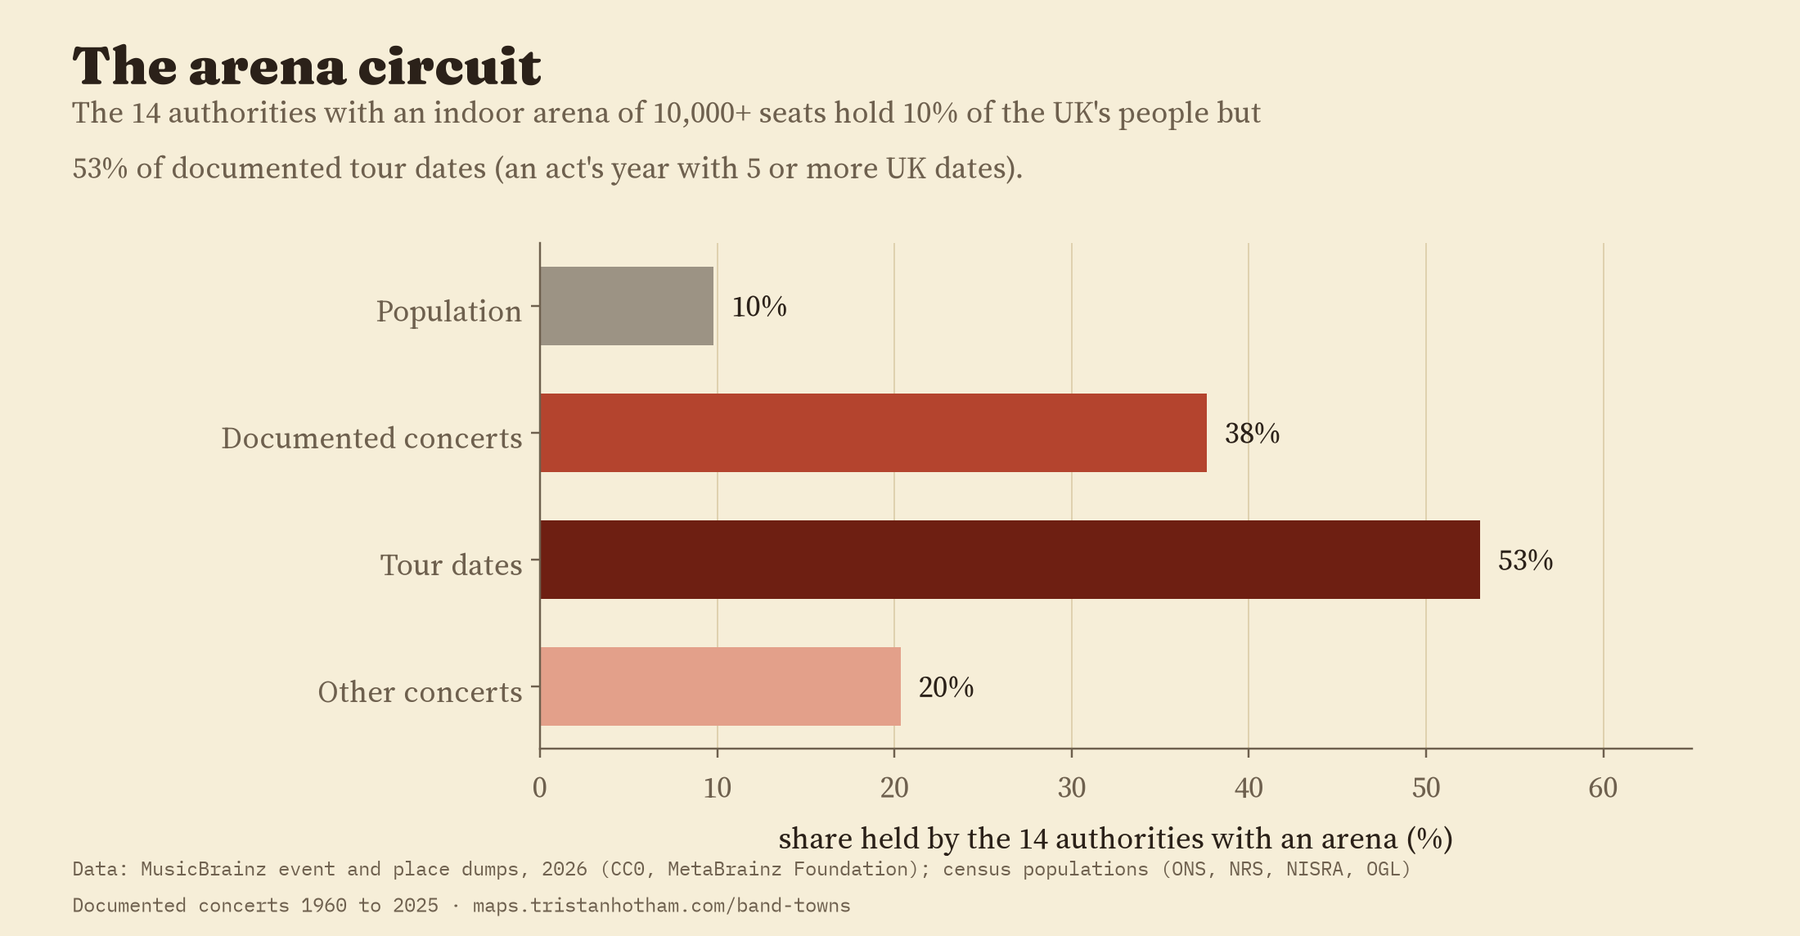
Allowing for size and nation, a council area with an arena has 3.8 times the documented concerts of one without. For tour dates the arena premium is 7.0 times bigger again than for other gigs. When I gave “arena” status to random council areas of similar size, 500 times over, the real arenas beat the fake ones in all but 0.4% of tries. The premium does get less certain if I cap each act at three concerts per area or drop the ten most documented acts, so a handful of heavily documented tours matter a lot.
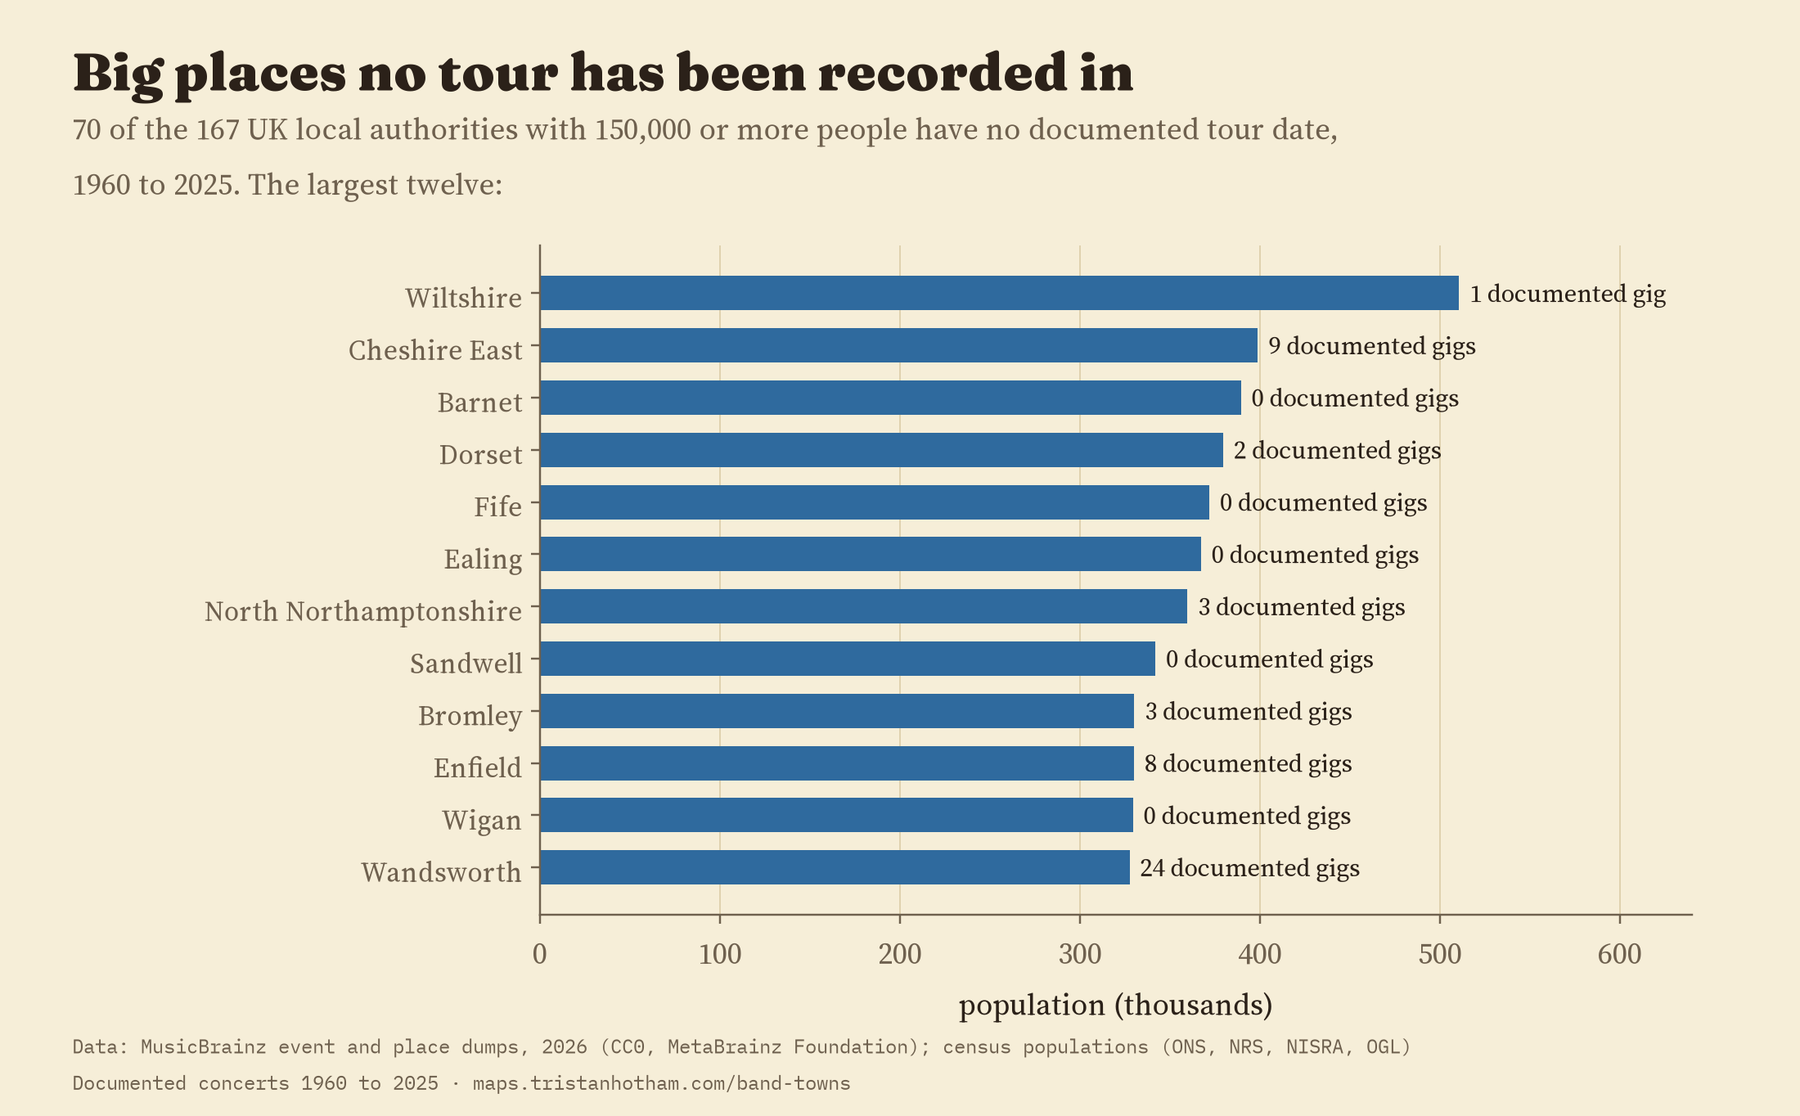
70 of the 167 UK council areas with 150,000 or more people have no documented tour date at all.
The flip side is the towns the circuit skips, or at least the towns where nobody has written down the circuit stopping. Wiltshire has more than half a million people and 1 documented gig. Barnet, Fife, Ealing, Sandwell and Wigan have none. Fans of those places will know perfectly well that bands play there. That is the point: the record does not.
The shadow that wasn’t
Before counting anything by area I wrote down what I expected. One expectation was a shadow: towns close to an arena city should see fewer big gigs than towns of the same size far away, because their audiences can just get the train. In the planned model the shadow is not there. It only shows up if I set London aside, where boroughs close to two arenas are also full of famous theatres and halls. That is interesting, but it was not the plan, so I treat it as a hint rather than a finding.
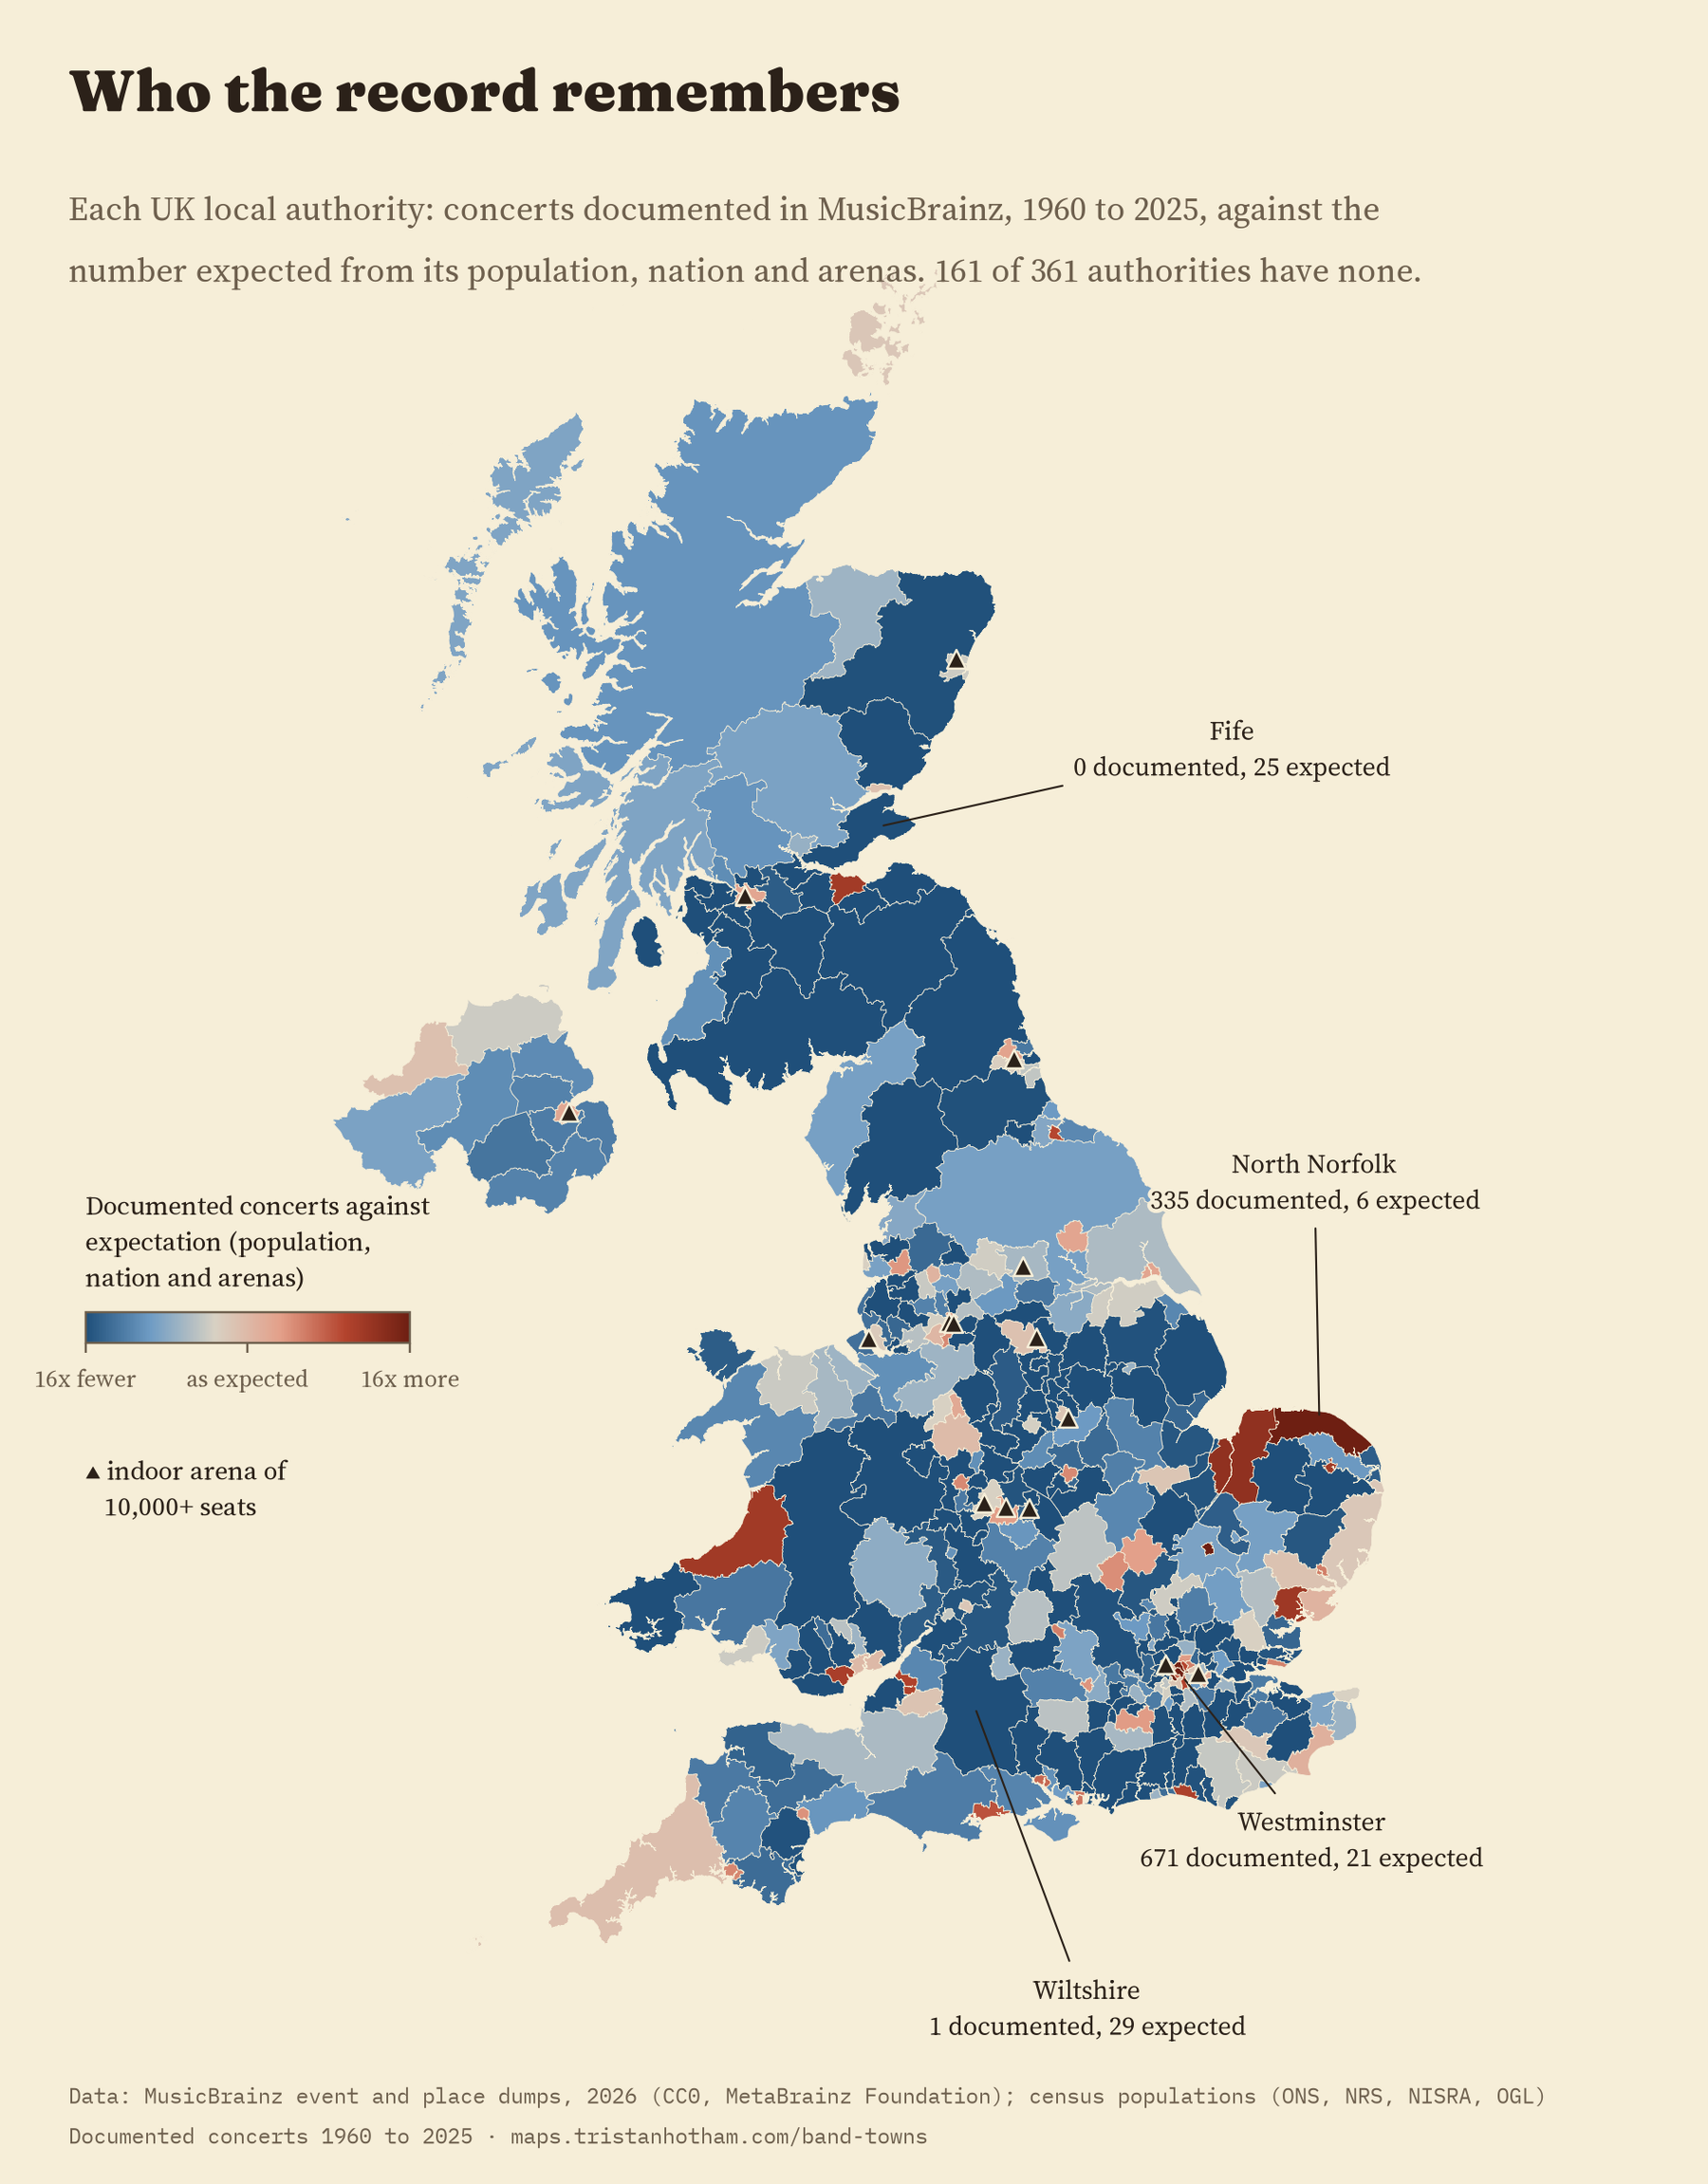
On the map, red areas have more documented concerts than their size predicts and blue areas fewer. The reddest are the venue archives and the capital: North Norfolk (335 documented against about 6 expected), Westminster with the Royal Albert Hall, Cambridge with its Corn Exchange. The bluest are big places with nothing documented at all, like Ealing and Barnet, expected to have around 44 and 40. Slide through the decades on the interactive map and you can watch the record move from a 1970s Norfolk venue and London theatres to the arena cities.
How I did this
I streamed the MusicBrainz event and place dumps straight from their compressed files and placed each UK event by its venue’s coordinates inside a council boundary. About 8% of events had a venue without coordinates; I placed those at the largest UK settlement with the same name as the venue’s area. The outcome is every event typed Concert, not cancelled, from 1960 to 2025. Populations come from the 2021 census (2022 in Scotland). The arena list is Wikipedia’s list of UK indoor arenas, keeping those with 10,000 or more seats.
The analysis was pre-specified in a written plan before I made any council-level count: Poisson models of documented concerts on population, nation, arenas and distance to the nearest arena, a stacked model comparing tour dates with other gigs, and a long list of checks, including the placebo arenas. Everything is in the paper and the code.
What this can’t tell you: how many concerts actually happen in your town. MusicBrainz holds a small and uneven slice of the UK’s live music, shaped by which acts and venues its volunteers care about. A blank town is a town nobody has written up, not a town without music. If that annoys you, the good news is that anyone can add a gig.
Notes and sources
- Concerts and venues: MusicBrainz JSON data dumps, 2026, MetaBrainz Foundation (CC0).
- Population: Census 2021 (ONS, NISRA) and Scotland’s Census 2022 (NRS). Boundaries: local authority districts 2023 (ONS, OSNI). Open Government Licence v3.0.
- Arenas: Wikipedia, List of indoor arenas in the United Kingdom (CC BY-SA 4.0). Venue counts for Glasgow: E. Webster, M. Brennan, A. Behr, M. Cloonan and J. Ansell, Valuing Live Music: The UK Live Music Census 2017 Report (2018).
- Further reading: S. Frith, M. Brennan, M. Cloonan and E. Webster, The History of Live Music in Britain; L. Bettencourt and colleagues, Growth, innovation, scaling, and the pace of life in cities, PNAS (2007); M. Graham and colleagues, Uneven geographies of user-generated information, Annals of the AAG (2014).
- I wrote the text, with drafting and editing assistance from Claude (Anthropic), which also helped prepare the analysis code. I reviewed and checked all text and results.

