
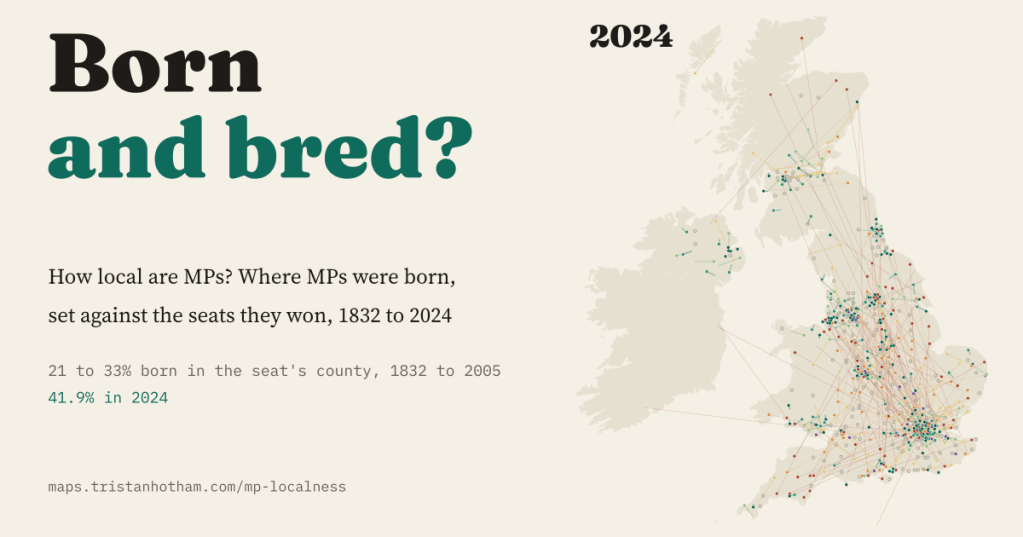
Where were MPs born, and how far is that from the seats they won? 31,737 MPs returned at 49 general elections, 1832 to 2024, on one map. For 170 years the answer barely moved. Then it did.
“Local candidate” is one of the most common claims in British campaigning, and the research on voters suggests it is a sensible one to make: people say they prefer someone from the area. But how local have MPs actually been? Local can mean many things, from growing up somewhere to living there or serving on the council. Most of those are hard to trace over two centuries. Birthplace is not. It is fixed, it is often recorded, and it can be put on a map.
So I took every member returned at a UK general election since the Great Reform Act, 31,737 returns of 10,094 people, found where each was born, and measured the distance to their seat. I also asked three simpler questions: were they born in the same county as the seat, in London, or abroad?
Lines home
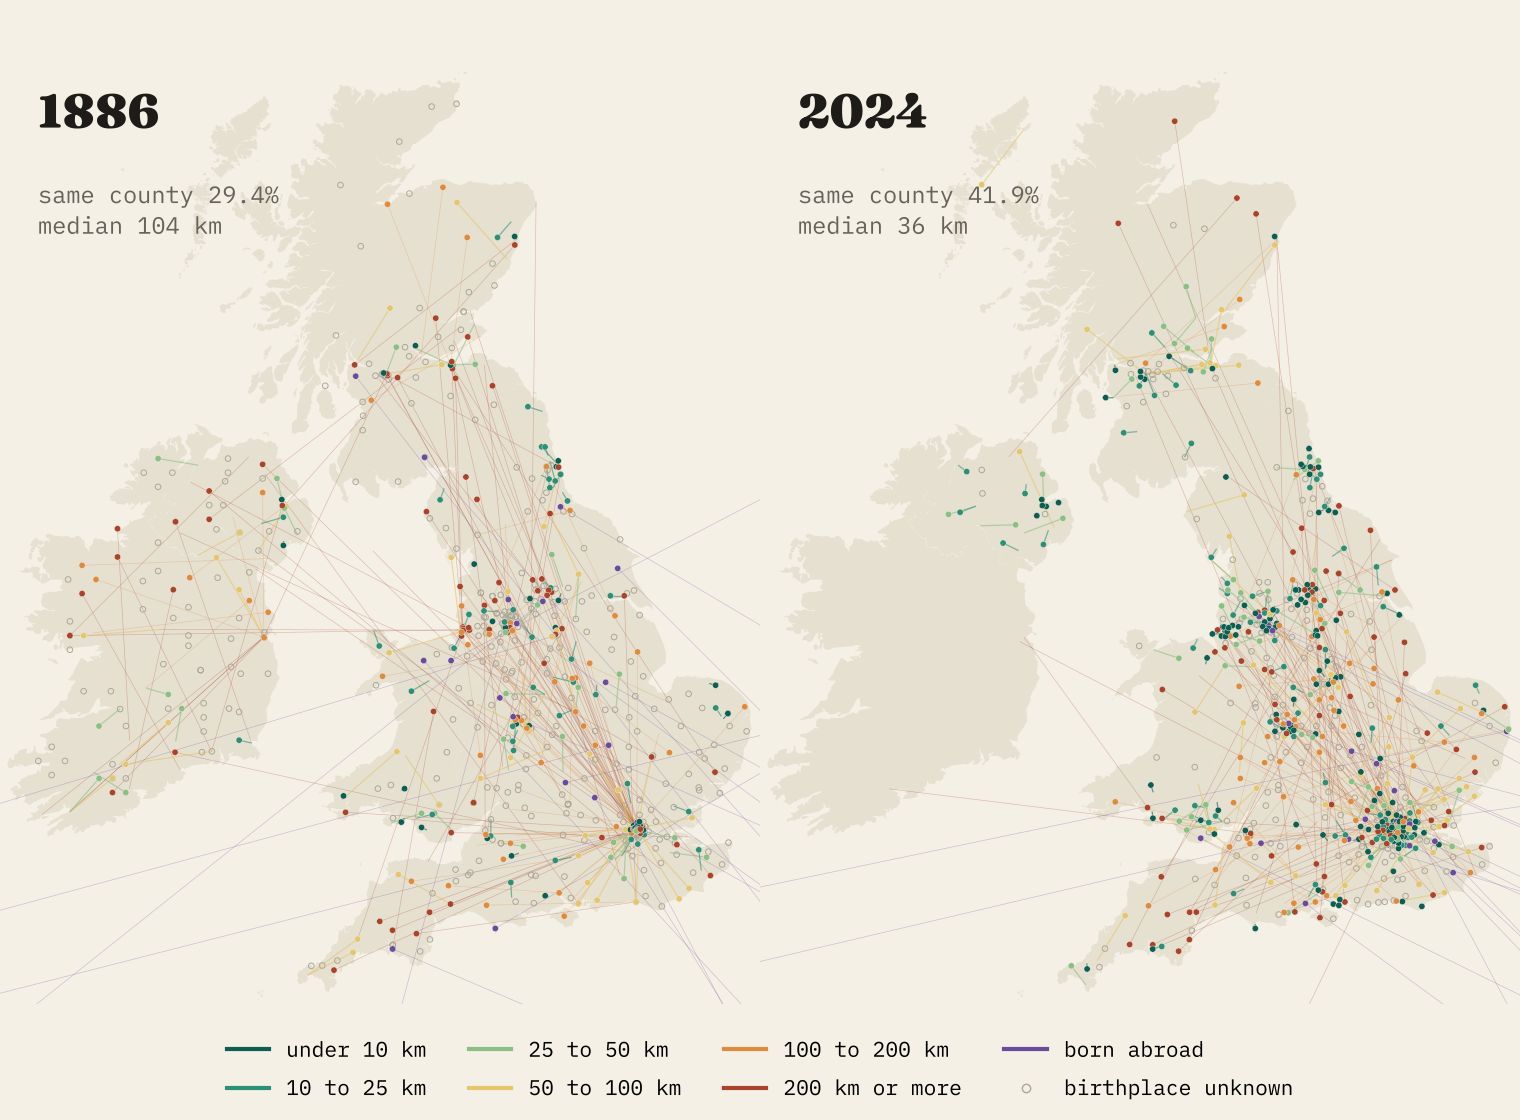
The 1886 map is a web of long lines. Many run to London, many cross between England, Scotland and Ireland, and a few run off the map altogether, to birthplaces overseas. The 2024 map is tighter: short green stubs in the big cities, the North East and the central belt of Scotland, with the long lines thinning out.
A quarter, for 170 years
The headline measure is simple: was the MP born in the same county as their seat? (I use one modern county map for every year, so the test is the same in 1832 and 2024.) At the first reformed election, 25.9% of the MPs I can place were. At every general election from then until 2005 the figure stayed between 21.1% and 33.4%. Reform acts, the end of most two-member seats, the rise of Labour, votes for women: none of it moved the line much.
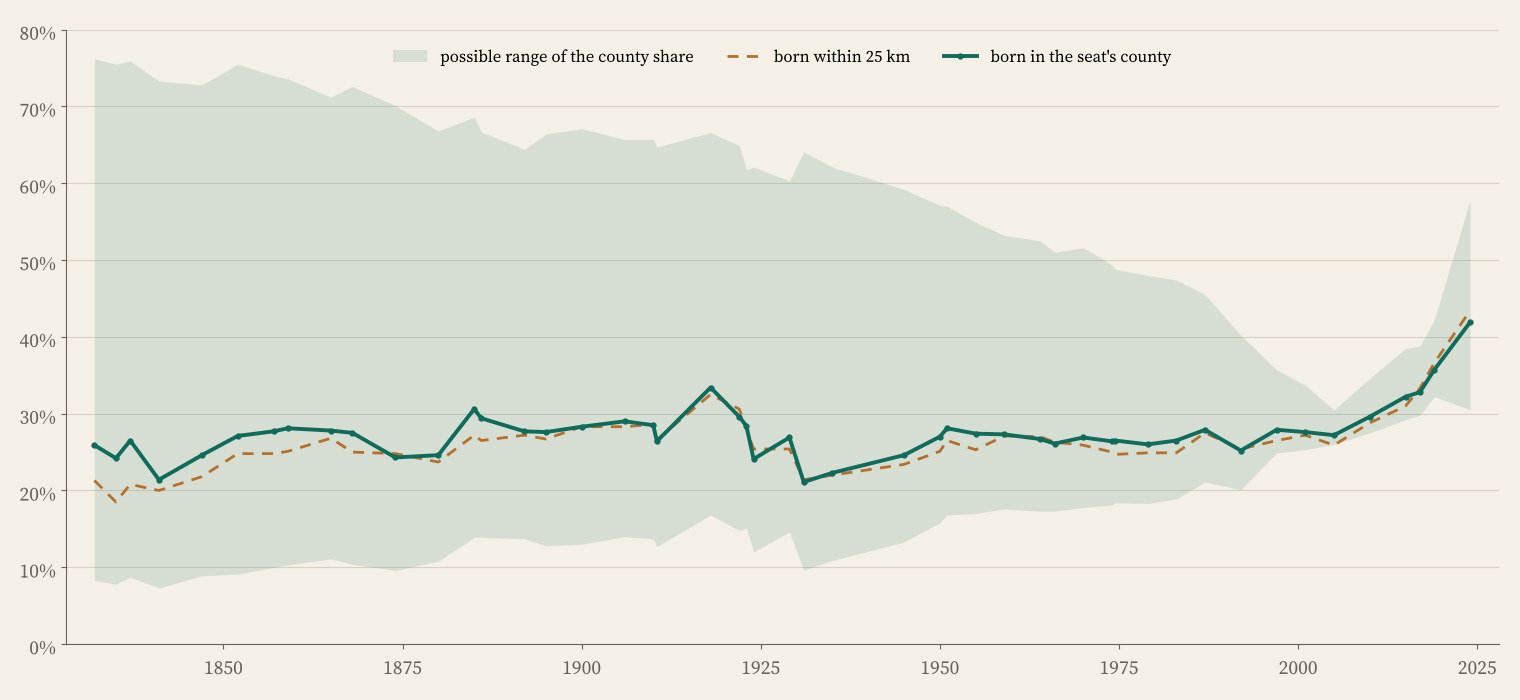
Then, after 2010, it climbed: 29.6% in 2010, 32.8% in 2017, 35.7% in 2019 and 41.9% in 2024. The median MP’s birthplace moved from 82.7 km from their seat to 35.8 km.
For most of the last two centuries, about one MP in four was born in the county they represented. Since 2010 it has been heading towards one in two.
It is the new MPs
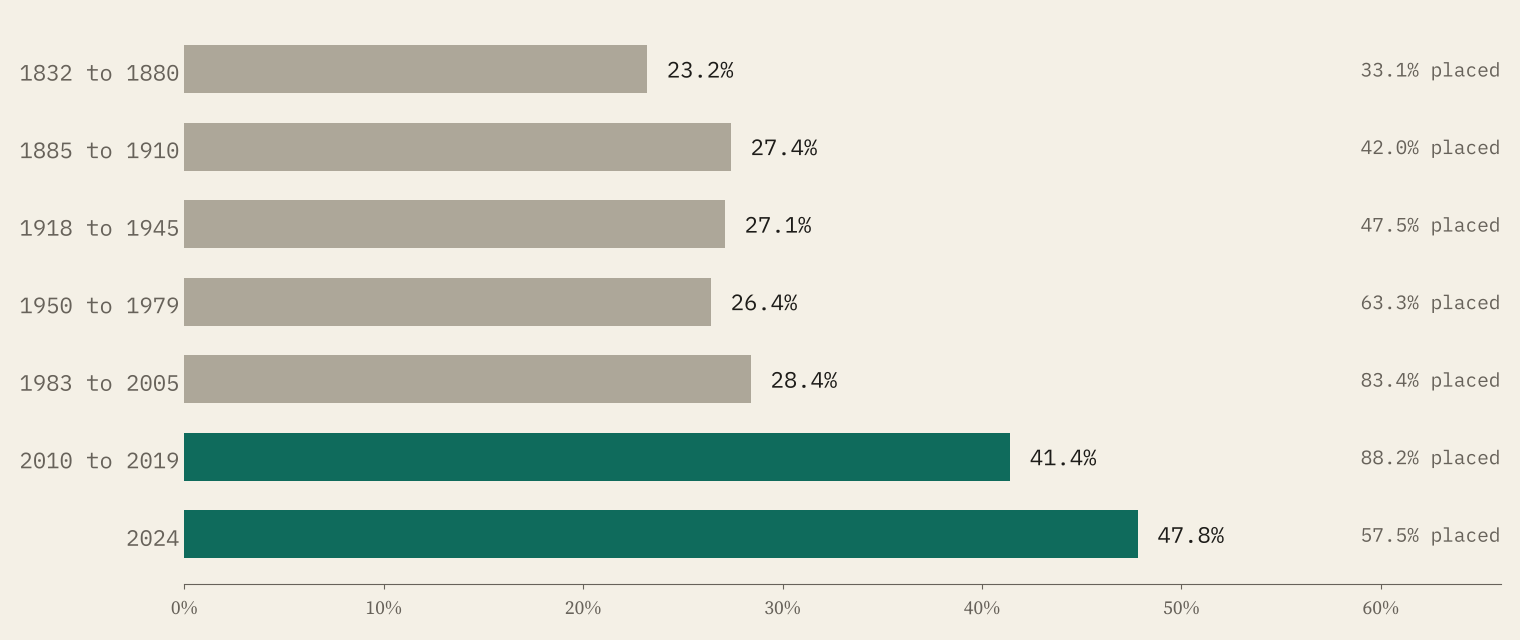
Counting every MP at every election mixes long-serving members with new ones, so I also counted each person once, at the first general election they won. Of MPs first elected between 1983 and 2005, 28.4% were born within 25 km of their seat. Of those first elected from 2010 to 2019 it was 41.4%, and in the 2024 intake 47.8%.
Parties and places
Labour MPs are more often born locally than Conservative ones, and have been in every era since Labour won seats in numbers. From 1997 to 2024, 37.7% of placed Labour MPs were born in their seat’s county, against 18.7% of Conservatives, 31.0% of Liberal Democrats and 34.4% of SNP MPs. The parties hold different kinds of seats, so this is a description, not a verdict. Both big parties moved after 2005: the Conservatives from 12.6% to 22.1% (2010 to 2019), Labour from 33.5% to 41.7%. Part of the 2024 jump is simply that Labour won far more seats.
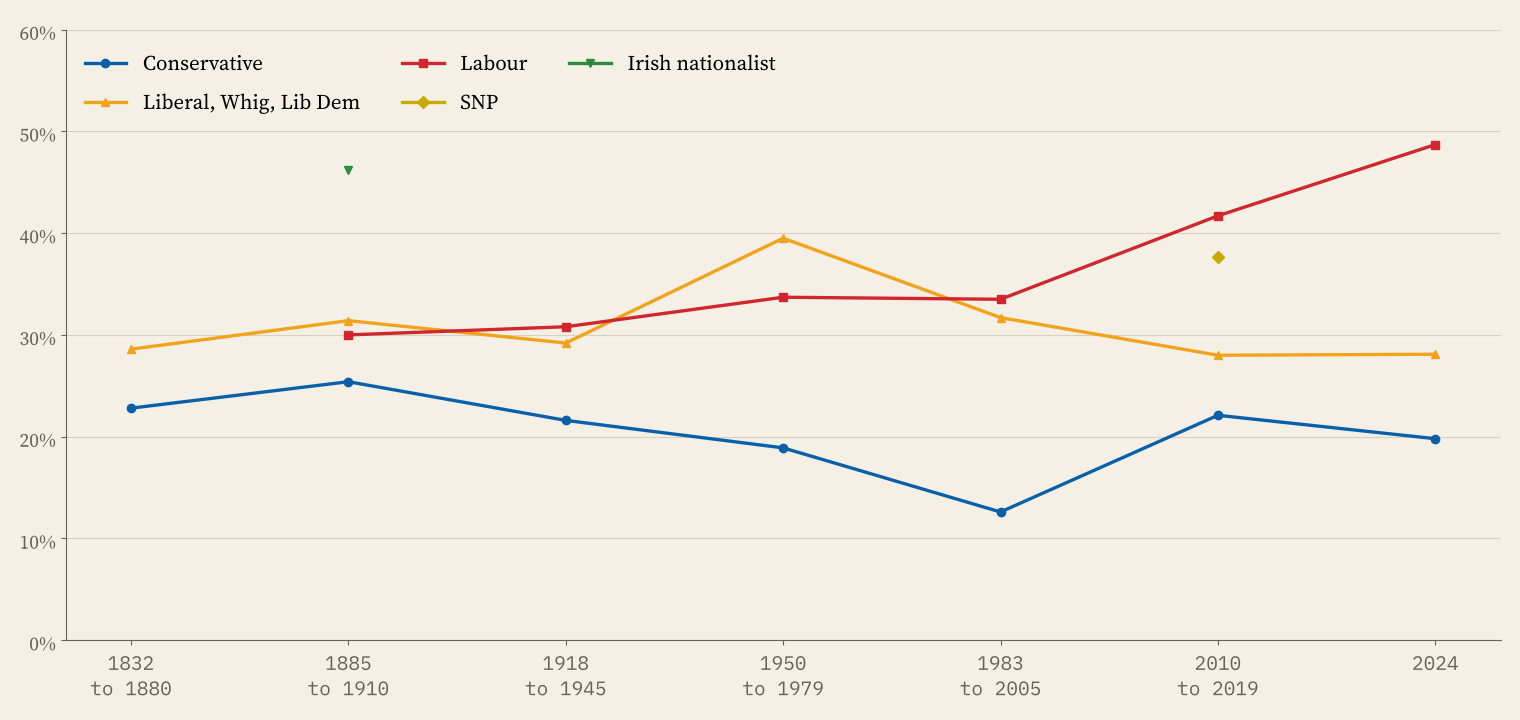
Geography matters more than party. Since 2010, 53.6% of North East MPs were born in their seat’s county. In the East of England it was 14.7%, and 34.5% of those MPs were born in London: the commuter belt elects people who grew up in the city next door.
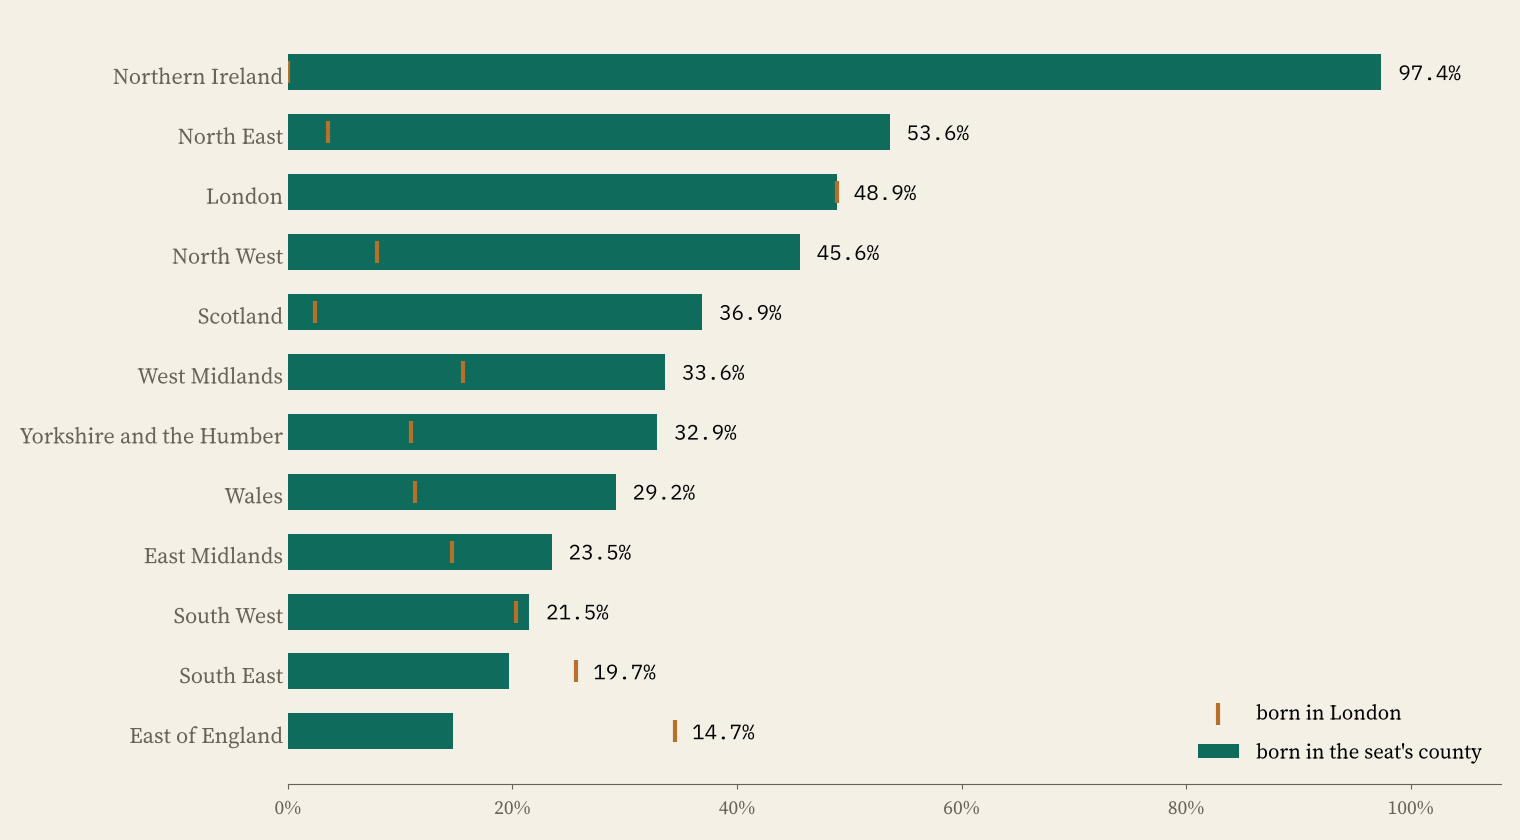
London’s pull on the House has weakened. In 1832, 28.2% of the MPs I can place were born there; at every election since 1992 it has been between 16.2% and 20.1%. About one MP in twenty was born outside the British Isles (5.7% of all returns), most often in continental Europe (88 people) and South Asia (71).
What the data cannot tell us
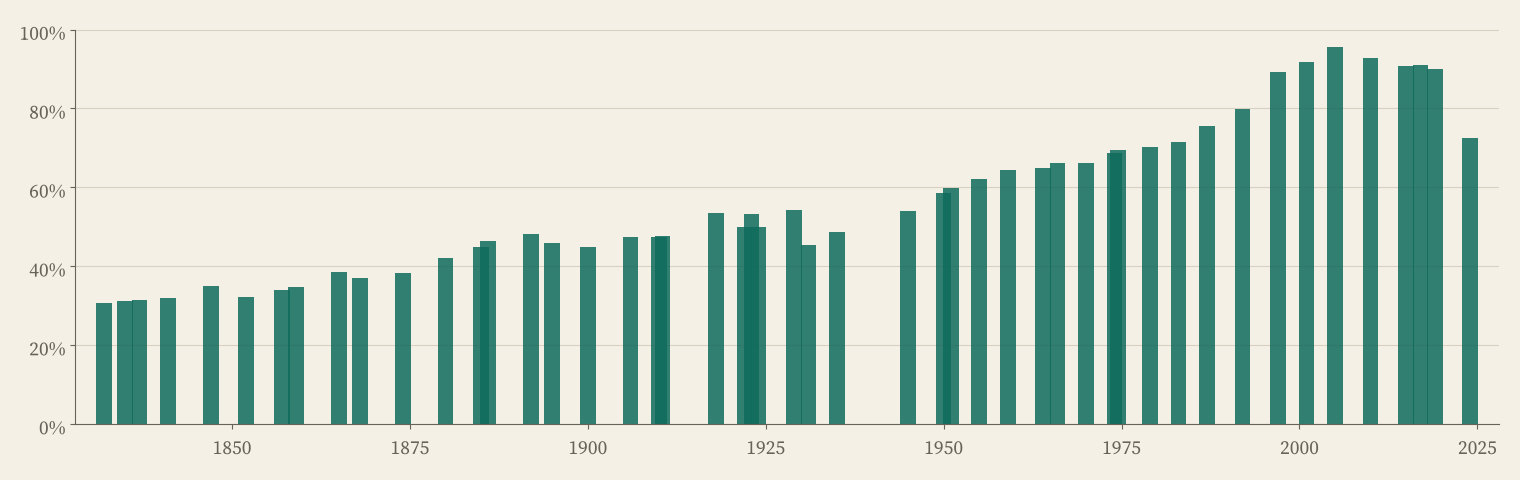
Birthplaces are well recorded for recent MPs and badly for early ones. I could place 30.7% of the MPs returned in 1832, 58.7% in 1950 and around nine in ten from 1997 to 2019. For 2024 it is 72.6%, because many new MPs have no recorded birthplace yet. That is why the long-view chart carries a band: in 2024 the county share could be anywhere from 30.5% to 57.8%. The rise from 2010 to 2019 rests on much firmer ground.
Birthplace is also a narrow idea of local. Someone born in a London hospital and raised in Lancashire counts as a Londoner here. It says nothing about where MPs lived, worked or went to school, and it is not a judgement on anyone. The interactive map lets you check any seat: tap a dot to draw the line home and to see every MP the seat has returned since 1832.
How I did this
MPs and seats come from Wikidata, which records each member’s seat and the general election they won it at. Birthplaces come from Wikidata, and where it has none, from the birth place in the English Wikipedia infobox or the first place linked after “born” in the article; on a test sample of 400 MPs with a Wikidata birthplace, those two methods landed within 5 km of it 96.3% and 94.0% of the time. Birthplaces recorded only as a county or country count as unknown. Seats are points, not boundaries, taken from my earlier map of every general election since 1832, and party families come from the same results. The paper sets out every definition and caveat.
Notes and sources
- Wikidata: members of each Parliament with constituency and election, places of birth and coordinates, retrieved 29 October 2026 through the QLever endpoint (CC0).
- English Wikipedia: MP articles, birth places only where Wikidata has none (CC BY-SA 4.0).
- UK Parliament Members API: current members, to check the 2024 list (Open Parliament Licence v3.0).
- Who won here? (doi:10.5281/zenodo.23761425): constituency points and party families, from UK Parliament and House of Commons Library results (Open Parliament Licence v3.0).
- County outlines: Office for National Statistics (Open Government Licence v3.0). Contains OS data © Crown copyright and database right 2026.
- Sister project: Mentioned in the House, which places MPs talk about in the Commons.
- I wrote the text, with drafting and editing assistance from Claude (Anthropic), which also helped prepare the analysis code. I reviewed and checked all text and results.

