
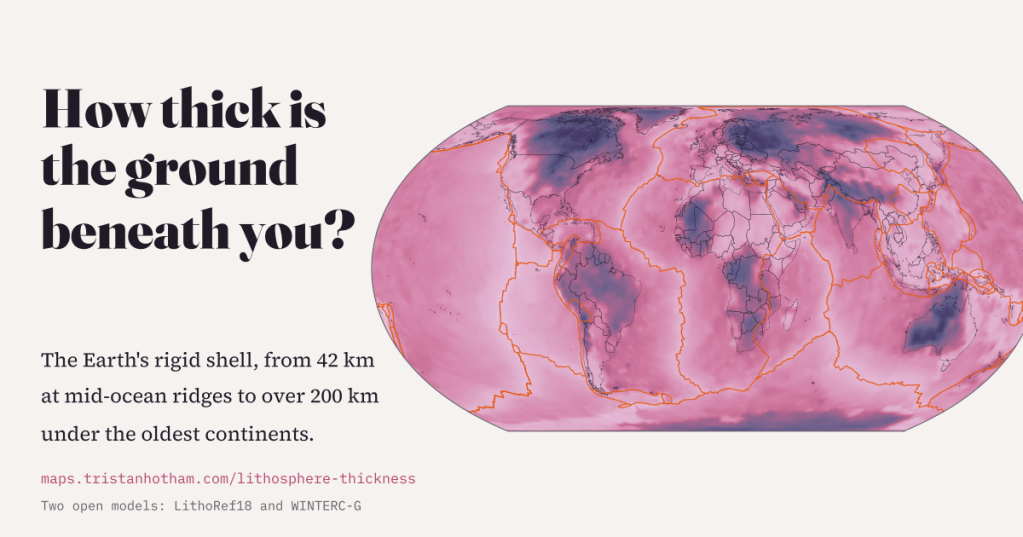
Under some places on Earth the rigid shell of rock we live on is thinner than a marathon is long. Under others it reaches down more than 200 km. I mapped how thick it is beneath every place, from two open global models, and what that has to do with volcanoes, diamonds and Lancashire.
The Earth’s tectonic plates are slabs of lithosphere: the crust plus the cold, stiff top of the mantle beneath it, welded together into one rigid layer. Below that, the mantle is hot enough to creep, and the plates slide over it. How deep that change happens, the base of the plate you are standing on, varies more than almost anything else about the planet.
This started with a lovely map by Fabio Crameri on s-Ink, drawn from a model by Clinton Conrad and Carolina Lithgow-Bertelloni. I wanted to click on it and ask “how deep here?”, but the download is pictures only, not numbers, and I could not find the grid behind it. So I built my own from two newer models that publish their numbers openly: LithoRef18, from Juan Carlos Afonso and colleagues, and WINTERC-G, from Javier Fullea and colleagues. Both are free to reuse.
A map of the world’s floor
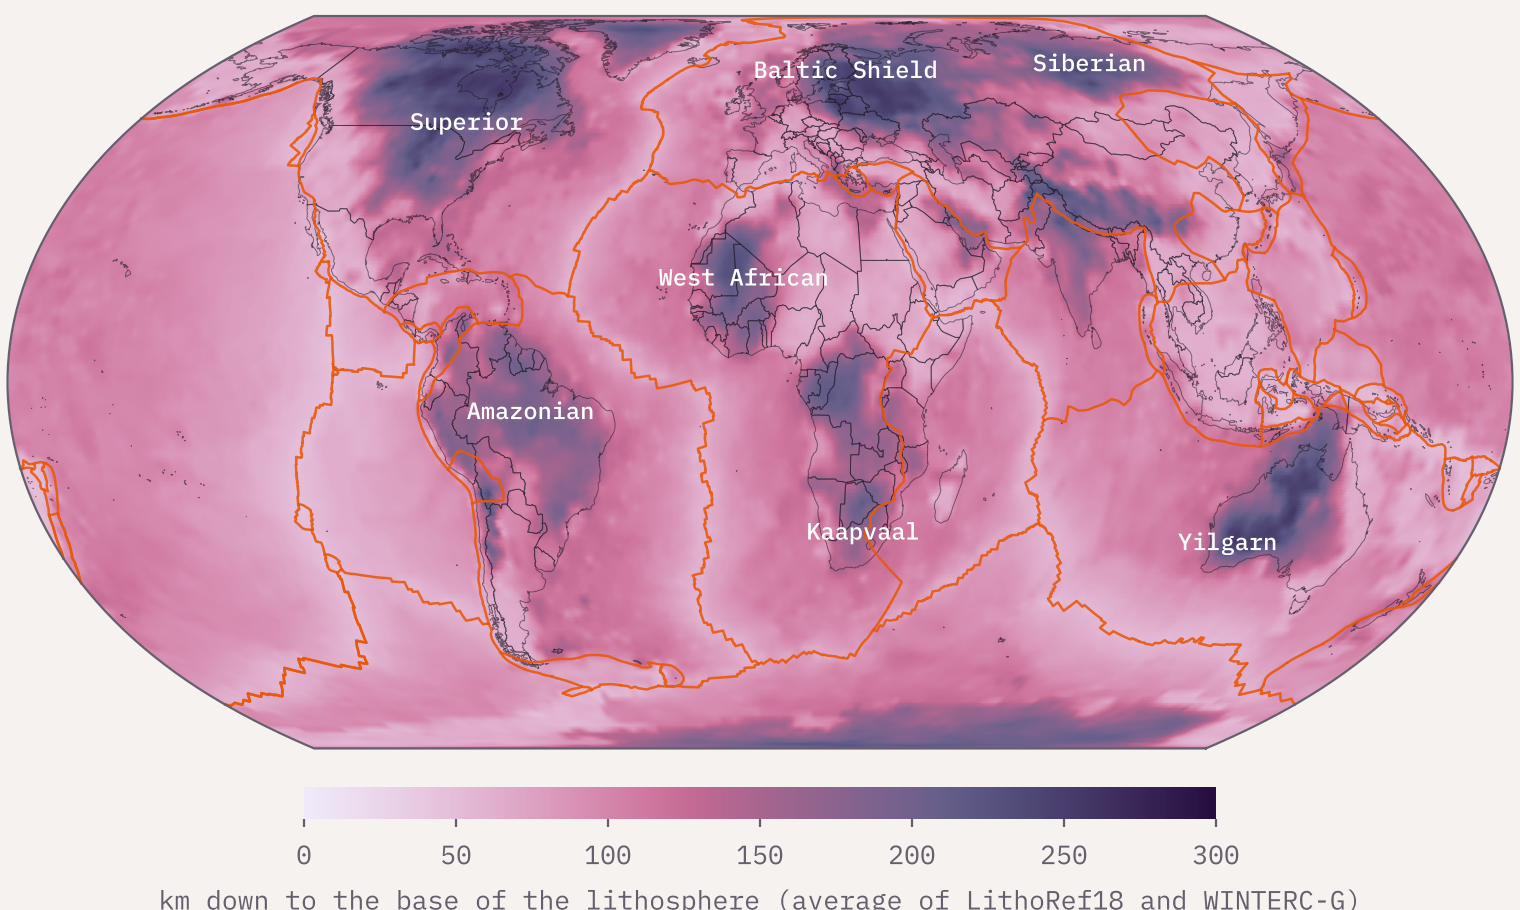
Averaged over the whole planet, both models put the base of the lithosphere about 105 km down. That is a remarkable coincidence of two very different calculations: LithoRef18 gives 104.7 km and WINTERC-G 104.7 km. But the average hides a huge range. The pale lines snaking through the oceans are the mid-ocean ridges, where the plate is thinnest. The deep purple islands on land are the cratons, the ancient hearts of the continents.
Born thin, thickening with age
New ocean floor is made at the ridges, where hot mantle wells up and melts. As the young plate drifts away it cools from the top down, and the cold, rigid layer grows thicker. Textbook physics says it should grow with the square root of its age: four times as old, twice as thick.
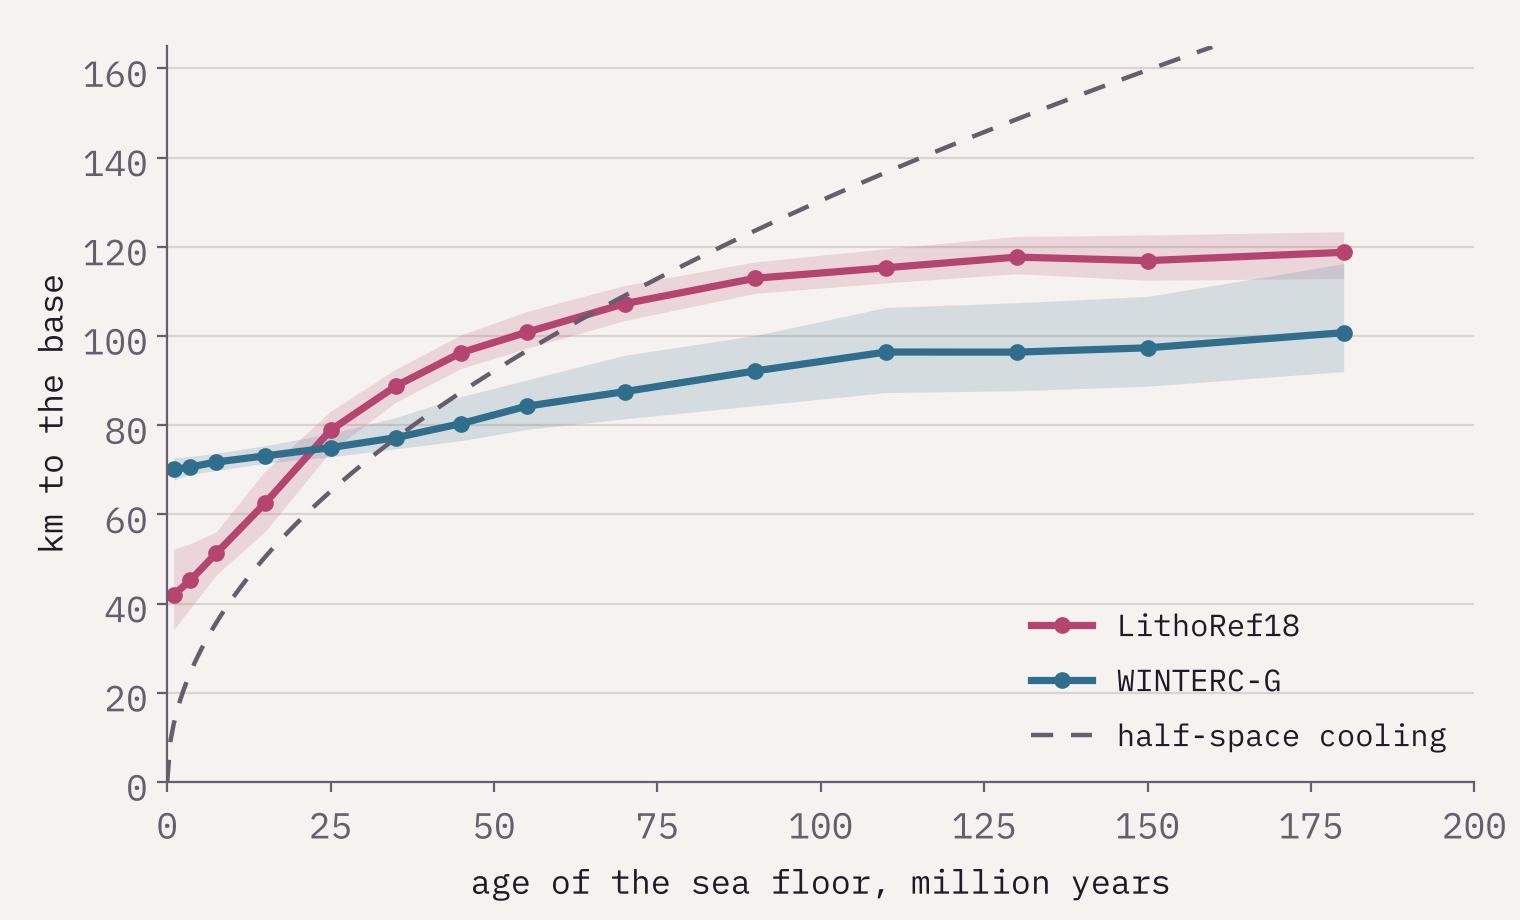
That is roughly what the data show. On sea floor less than 2 million years old LithoRef18 puts the base at a median of 42 km, about a marathon. On sea floor older than 150 million years it is 118 km. WINTERC-G tells the same story more gently, from 70 to 99 km, partly because its points are about 225 km apart, wider than the thin strip along a ridge. Both curves flatten out for the oldest sea floor, as geophysicists expect. The oldest ocean floor in the age grid, about 339 million years old, is in the eastern Mediterranean.
Deep roots, and one that was lost
On land the deepest ground is under the cratons, cores of continents that have survived for billions of years. Geologists think they owe that survival to deep, cold, buoyant roots that resist being dragged back into the mantle. At 14 sample points, the median depth to the base is 178 km in LithoRef18 and 199 km in WINTERC-G.
The odd one out is the eastern North China craton. It is ancient at the surface but sits on only about 66 km of lithosphere, and geologists widely describe it as a craton that lost much of its root. Of the world’s 573 cities of a million people or more, Tianjin has the thinnest lithosphere beneath it (59 km). Moscow has the thickest (254 km).
Volcanoes on thin ground, diamonds on thick
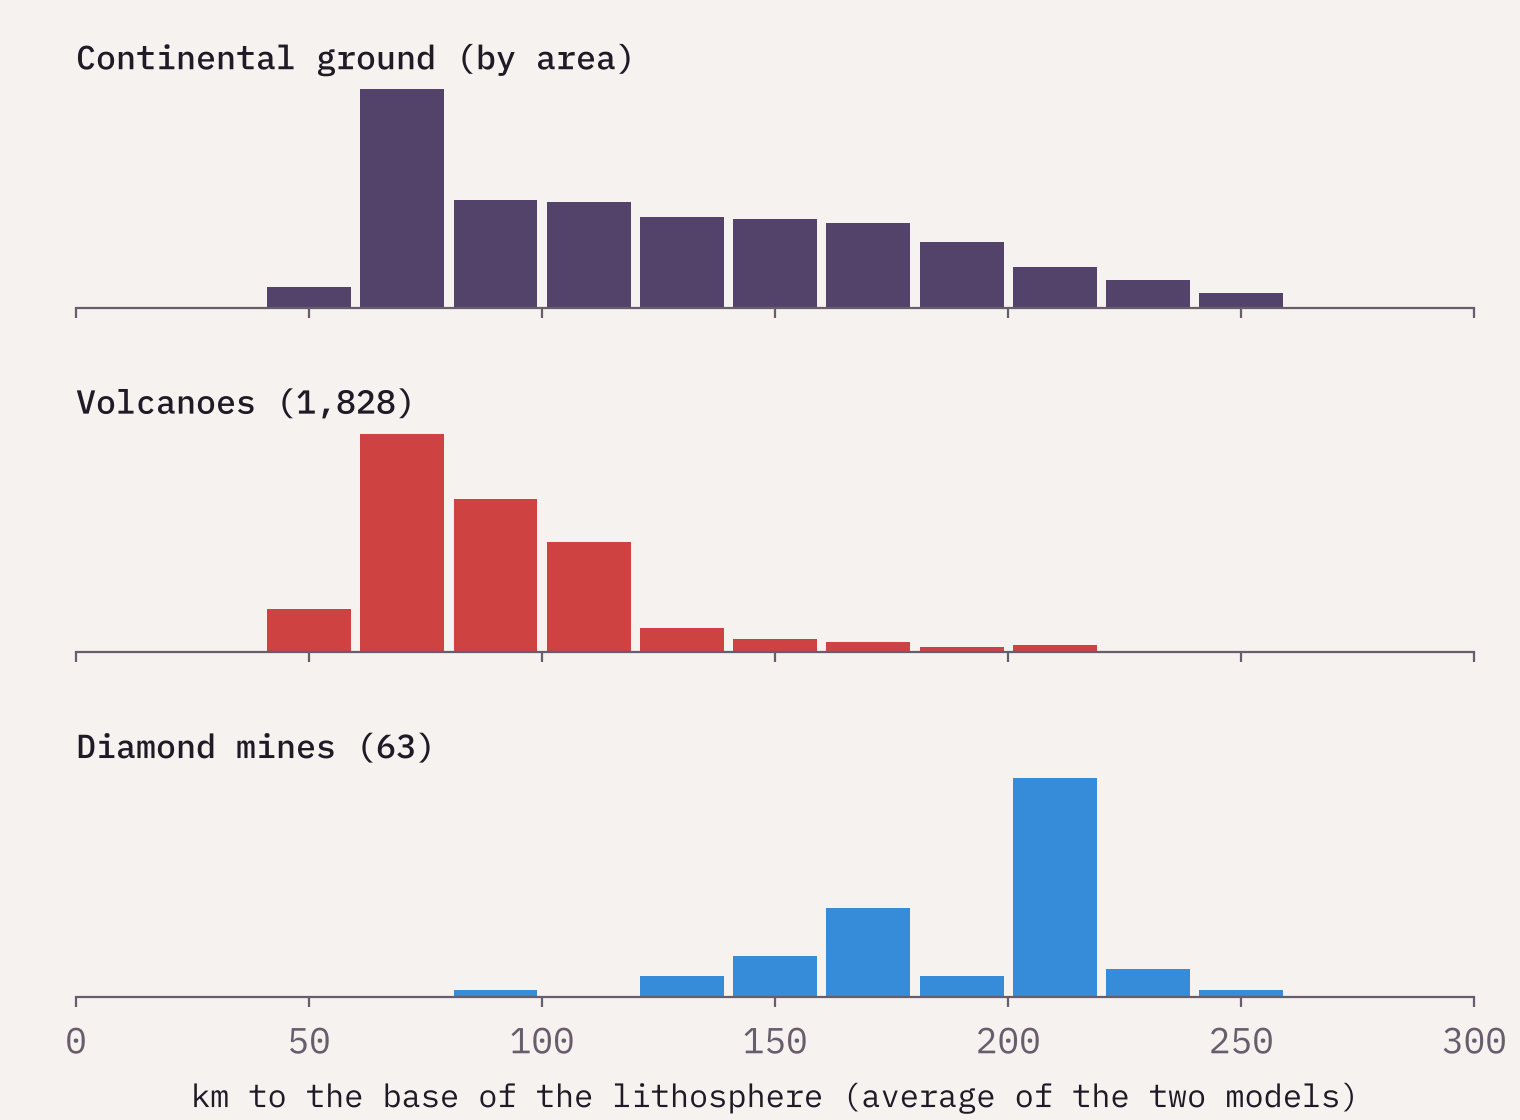
Most volcanoes grow where plates pull apart or dive under each other, and in both places the rigid lid is thin. Of 1,828 volcanoes listed in Wikidata with a Smithsonian volcano number, 71% stand on lithosphere less than 100 km thick.
Diamonds are the mirror image. They form deep in the mantle, roughly 150 km down or more, and only survive where a thick, cold root keeps them stable until a rare, violent kimberlite eruption carries them up. Of the 63 diamond mines in Wikidata with a location, 87% sit on lithosphere more than 150 km thick. Their median root, 207 km, is deeper than 92% of all continental ground. Prospectors have a rule of thumb for this: look on the old cratons.
The typical diamond mine sits on a root deeper than 92% of the world’s continental ground.
Britain, and Lancashire
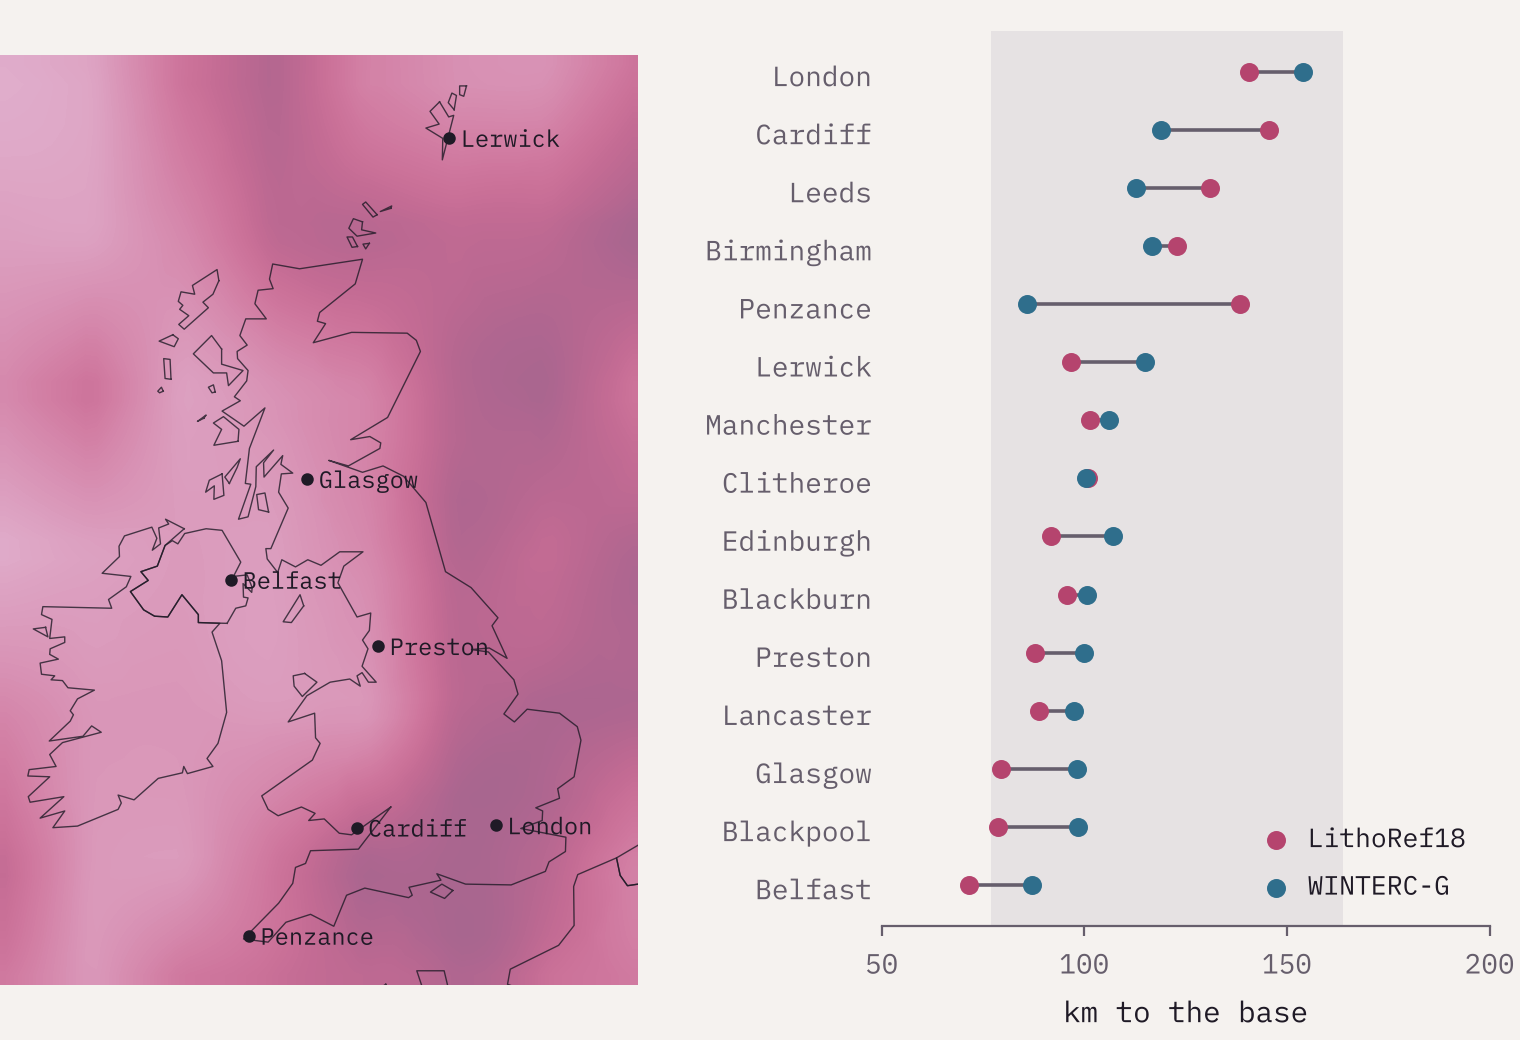
Britain is not a craton. It was pieced together from older fragments and stretched when the Atlantic opened. Its lithosphere is middling: 115 km on average, 73rd thickest of 154 countries, close to the continental median of 117 km. It thins to the north and west. Under Lancashire the base is about 90 km down in one model and 99 km in the other. The nearest ground where both models go below 200 km is in Sweden, about 1,480 km away, on the edge of the Baltic Shield.
Where the experts disagree
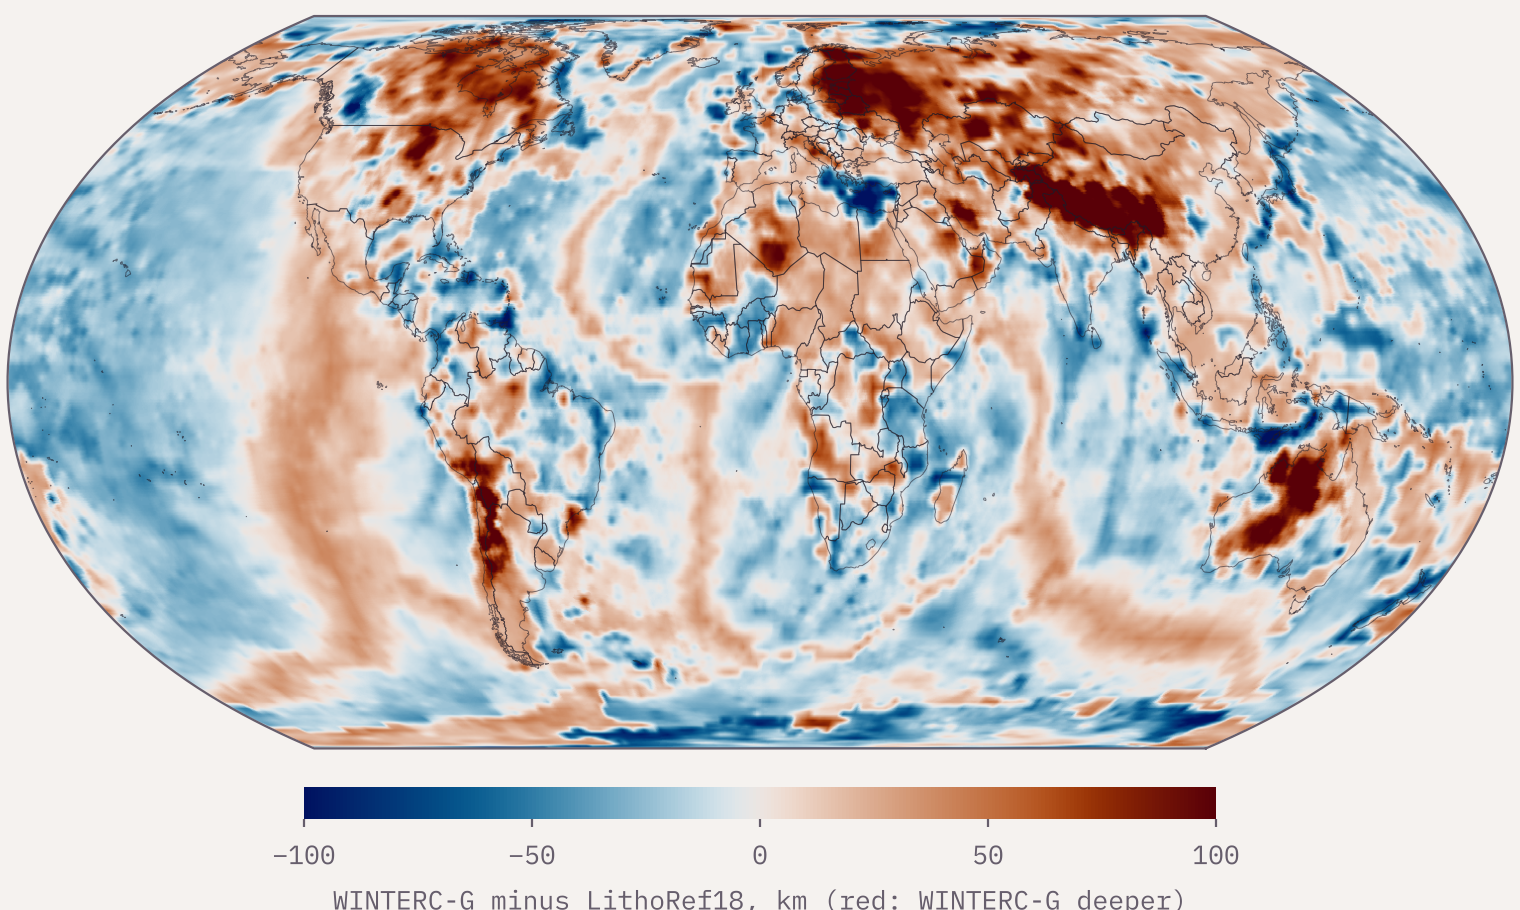
Nobody can drill to the base of the lithosphere, so every map of it is a model. Mine shows two, and they agree on the broad pattern: across the globe they correlate at 0.74, and the typical difference is 19 km. But over 8% of the Earth’s surface they differ by more than 50 km. The biggest argument is under Tibet, where WINTERC-G finds a root of about 297 km and LithoRef18 only 127 km. That is a real scientific debate, not a mistake, and the interactive map lets you flip between the two models and see where they part company.
How I did this
I took LithoRef18’s 2 degree grid from the EarthByte GPlates Portal and WINTERC-G’s thermal lithosphere base from its Zenodo archive, and put both on a common grid of 0.25 degree cells (that step adds no detail). I added sea-floor ages from Seton and colleagues (2020), plate boundaries from Peter Bird’s PB2002 model, volcanoes and diamond mines from Wikidata, and cities from GeoNames. Shares of the surface are weighted by area. The base of the lithosphere is not a sharp line, both models are coarse, and WINTERC-G stops at 300 km, so read every number as an estimate give or take tens of kilometres. The Wikidata mine list is short (63 sites), so the diamond pattern is clear but the exact shares would move with a fuller list. Full methods and caveats are in the paper.
Notes and sources
- LithoRef18: Afonso, J.C. et al. (2019) A global reference model of the lithosphere and upper mantle. Geophysical Journal International. Data via the EarthByte GPlates Portal (CC BY 4.0).
- WINTERC-G: Fullea, J. et al. (2021) Geophysical Journal International 226(1). Model files on Zenodo (CC BY 4.0).
- Sea-floor age: Seton, M. et al. (2020) Geochemistry, Geophysics, Geosystems; EarthByte (CC BY 4.0).
- Plate boundaries: Bird, P. (2003) PB2002, via fraxen/tectonicplates (ODC-BY 1.0).
- The map that started this: Fabio Crameri, s-Ink lithosphere thickness map, based on Conrad and Lithgow-Bertelloni (2006), CC BY-SA 4.0. Colour maps: Crameri’s Scientific colour maps.
- Volcanoes and diamond mines: Wikidata (CC0). Cities: GeoNames (CC BY 4.0). Country outlines: Natural Earth.
- I wrote the text, with drafting and editing assistance from Claude (Anthropic), which also helped prepare the analysis code. I reviewed and checked all text and results.

